
An Evaluation of the MEP: A Cross Study Analysis
Jan Youtie
Georgia Institute of Technology
The Manufacturing Extension Partnership (MEP) has used a diversity of evaluation methods and metrics over its more than two decade history. Many of these studies are sponsored by the program itself. State economic development agencies and federal oversight bodies also engage evaluation efforts. These evaluations have been carried out by various private consultants, university researchers, policy foundations, government examiners, and MEP itself. The aim of this paper is to look across these evaluation reports to identify the methods used, focus of these evaluations in terms of geography and unit of analysis, and the findings. Not all of these reports have recommendations, but for those that do, this paper will present these recommendations so that similarities and trends may be discerned. This work updates a previous effort to catalog and analyze MEP evaluations conducted by the author along with Philip Shapira (Youtie and Shapira 1998; Shapira 2003). The results will show several ongoing themes in MEP assessments including efforts to present and validate its mission, balance multiple program objectives, and adapt program direction to the need for innovative technologies and products.
1. OVERVIEW OF THE MEP EVALUATION SYSTEM
Discussions of MEP evaluation system typically focus on three primary program objectives: (1) delivering service to a broad range of manufacturing enterprises (market penetration), (2) maintaining optimal revenue levels for program operation (revenue generation), and (3) having an impact on clients that are served (client impact).1 These objectives are not always in alignment, which can lead to conflicts (Figure APP-A-1.). For example the need for market
________________
1See for example, Oldsman (2004), Sears and Blackerby (1998), Voytek et al., (2004).
penetration emphasizes widespread service through training or short-term engagements, which can be associated with less revenue generation and lower-levels of impact on clients. Efforts to raise revenue have the potential to be associated with fewer clients served. Efforts to raise impact can also mean larger projects with a smaller set of clients. Maximizing service impact can even effect revenue generation as some types of projects with the potential to yield high impact are stressed over other types of projects that have short-term cost-cutting appeal to potential customers.
Given these potentially diverging objectives, the MEP uses multiple evaluation methods to address them. The core performance measurement activity at MEP is the client survey. This survey, which has been administered since 1996, is conducted approximately one year after an engagement with a client company. The survey draws on a standard nationwide reporting system. Centers populate this system on a quarterly basis with reporting information about center, client, and project and event attributes. The survey is administered by a third party company once a quarter primarily using telephone and web-based methods. The questionnaire has included various questions over the years but the core questions ask clients to report changes in quantitative outcomes such as sales, employment, cost savings, and capital investment. In addition, the current survey asks about factors in using the MEP and strategic challenges the company faces. Prior questionnaires included items about customer satisfaction, but the MEP has reduced these questions, because of lack of variability in overwhelmingly positive responses. The current questionnaire asks clients about the likelihood of recommending the MEP to other companies.
Survey results concerning fiscal year 2010 indicated that the MEP served 34,299 companies. Of the 7,786 participating in the survey (out of 9,654 qualified to do so given their receipt of more intensive services), these clients’ aggregate results attributed to MEP assistance were $8.4 billion in sales, $1.3 billion in cost savings, $1.9 billion investments, and 72,075 jobs created or retained. An economic impact model applied to the results indicated that for every $1 of federal investment, $32 of economic growth is returned (MEP 2011; see also MEP 1994, 1997, 1998). Client responses associated with high impact numbers are authenticated and, if found valid, are profiled as success stories using a mini-logic-based case study method.
The survey is designed to fulfill Government Performance and Assessment Act (GPRA) requirements for metrics on program impacts. Program metrics are reported relative to measurable goals which the program sets as part of GPRA. The survey also forms the basis for tracking center-level performance, since 2003, through a system of Minimally Acceptable Impact Measures (MAIM). 2 MAIM is comprised of five measures: (1) Bottom-line
________________
2NIST MEP Reporting Guidelines, Center Operations, version 6.1. Effective Quarter 2, 2011.
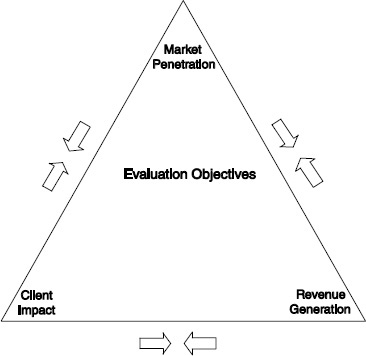
FIGURE APP-B-1 Evaluation objectives.
Client Impact, (2) Cost Per Impacted Client, (3) Investment Leverage Ratio, (4) Percent Quantified Impact, and (5) Survey Response Rate. In early 2012, the MEP instituted a new center performance methodology using a balanced scorecard approach, termed MEP sCOREcard. Roughly half of the score comes from seven center metrics (new sales, retained sales, jobs, investment, cost savings, clients served, and new clients served) and the other half from diagnostics of how the center performs on six dimensions: innovation practice, next generation strategy, market understanding, business model, partnerships, and financial viability.
MEP’s enabling legislation calls for external panel reviews of centers. These reviews are typically conducted every other year for most centers, with panel composition including several directors from other MEP centers. Reviews focus on center operating plans, annual reports, and progress toward goals and follow established criteria based on the Baldridge quality framework. This model enables learning across centers in addition to the primary goal of providing feedback for the center under review. If the reporting and review processes continue to indicate poor performance, panel reviews are conducted more frequently and the MEP may re-compete center contracts.
MEP also has invested in other types of special evaluation studies. MEP has used logic-based case studies to examine clients with exceptionally high impacts from MEP services (Cosmos Corporation 1997, 1998, 1999) and to understand how new services are being implemented (SRI and Georgia Tech
(2009a). The logic models portray the functioning of MEP services, showing inputs, work processes, intermediate outcomes, and impacts on technology adoption, business performance, and broader impacts on the economy. Comparison group studies of clients and non-clients have been widely used to control for selection bias in that MEP is likely to attract clients already on the path to higher productivity (Jarmin 1997, 1997; Nexus Associates 1996, Oldsman 1996, Nexus Associates 1999, Youtie et al., 2008, 2010) and to account for observable and unobservable factors (Cheney et al., 2009). The 1990s saw the role of evaluations of several service delivery pilots including inter-firm networking (Welch et al., 1997) and SBDC-MEP partnership programs (Yin et al., 1998). Experimentation in evaluation approaches was evidenced in several workshops and evaluation working group sessions in the 1990s; this experimentation period has yielded to a more standardized evaluation process at the national level in the 2000s.
In addition to evaluations of the national program, several states have conducted evaluations of their particular state centers or system of centers. New York invested in independent evaluations of their centers in the 1990s (Oldsman et al., 1996, Nexus Associates, 1996). Pennsylvania conducted two highly regarded assessments of the centers in the Industrial Resource Center system (Nexus Associates 1999, Deloitte 2004). The state of Ohio included MEP program analysis as part of their assessment of the Third Frontier and other technology-based economic development programs (SRI and Georgia Tech 2009). Many states’ requirements of centers focus on activity reporting metrics, but the presence of these large scale evaluations bring forth the possibility of differences between national program and state-level evaluation and reporting requirements.
Most centers do not have additional evaluation programs beyond what is required of the national or state sponsor. However, a few centers have developed and maintained special capabilities to support their evaluation efforts. The Michigan Manufacturing Technology Center created a longitudinal data set of survey-based metrics for full-scale comparison, the Performance Benchmarking Service (Luria 1997, Luria and Wiarda 1996). The Georgia MEP has administered a survey of non-clients and clients which has been used for evaluation as well as for conducting studies to address particular needs of the center from time-to-time (Shapira and Youtie 1998; Youtie et al, 2008, 2010).
Trade associations have been responsible for several evaluations of aspects of the program. The National Association of Manufacturers included a question about service use as part of its survey of members’ technology adoption practices (Swamidass 1994). The Modernization Forum (a former association of MEP centers) sponsored several studies to provide information in support of the program’s rationale as well as to aide in system set-up in the early years of the MEP. In the 2000s, the Advanced Small Manufacturers Coalition or AMSC (the current association of MEP centers), along with other non-profit organizations, has turned the emphasis of MEP evaluations towards strategic redirection of the
program (NAPA 2003, 2004; AMSC, 2009; Stone & Associates and CREC 2010; MEP Advisory Board, Yakimov and Woolsey 2010) and international benchmarking efforts (Ezell and Atkinson 2011).
This evaluation system has resulted in a substantial body of evaluation studies related to the MEP program. The table in the Appendix represents 39 evaluative studies in the 1990s and another 26 in the 2000s. Thirty percent of these studies are published in academic journals or books, including in two journal special issues published in the 1990s (Research Policy 1996 issue and Journal of Technology Transfer 1998 issue). More than 10 percent are official federal government publications, with the remainder comprised of state government publications, conference proceedings, “gray” literature reports and white papers, dissertations, and informal memoranda. The most common method used in these evaluations is the customer survey, which was utilized by roughly one-third of the studies represented in this paper. Six of the works in this table used case study methodology (although a few others had case examples within primarily quantitative papers) while five linked client data to administrative databases at the state or national level. Sixteen of the studies utilized comparison groups, which signify the sophisticated nature of the evaluations in terms of controlling for factors besides extension services that could affect client outcomes. Seven of the evaluations involve benefit-cost and/or fiscal impact analysis to represent public and private returns from the program. This paper will show that the characteristics of the evaluations reflect the nature of the program’s evaluation system (which in turn reflects the nature of the program itself). The 1990s was a period of system build-up and exploration in both the program and the evaluation system, whereas greater standardization occurred in the 2000s. Hence, this paper divides the literature into these two groupings to represent trends in evaluation methods and results over the 20-year period.
2. EVALUATION STUDY RESULTS: 1990s
Evaluation studies in the 1990s used diverse and sometimes novel methods to understand program processes and effects. This mix of studies was heavily influenced by the MEP’s setting up of an evaluation working group in the 1993-1999 time period, producing a formal evaluation framework, and sponsoring four workshops on the evaluation of industrial modernization from 1993-1997.3 Feller et al. (1996), Shapira et al. (1996), and Sears and Blackerby (1998) address this early evaluation system as a whole, discussing issues in performance measurement and program improvement amidst conflicting goals such as addressing important program goals while avoiding over-burdening of
________________
3Atlanta Workshops on the Evaluation of Industrial Modernization, Aberdeen Woods, GA, 1993, 1994, 1996, 1997.
the client. As a result, a range of studies was produced with attention given to measurement of penetration, intermediate effects and short and longer-term outcomes on clients and the broader economy.
Swamidass (1994) conducted a survey of members of the National Association of Manufacturers (NAM) to assess their use of modern technologies and techniques. The survey found that only 1 percent of manufacturers say government is an important source of assistance in technology investment decisions; however many MEP centers are known through their university or center name rather than as a source of government assistance. This diversity makes efforts to measure penetration of the program, outside of program counts of manufacturers served, difficult.
How MEP fits in with other service providers has been an important dimension of evaluation efforts related to the market penetration objective of the program. The high cost of private firm service to small manufacturers has long been considered a major barrier to these operations’ productivity. Whether MEP competes or complements private sector consulting was the subject of a major study sponsored by the Modernization Forum and carried out by Nexus Associates through surveys of MEP clients, a comparison group of manufacturers, and private consultants (Modernization Forum and Nexus Associates 1997; Oldsman 1997). Seventy-three percent of manufacturer responses suggested that MEP complemented consultants’ work while only 7 percent of MEP clients reported that the MEP offered the same services as private consultants. Moreover, MEP clients were more likely to experience substantial benefits, in that the probability of a typical MEP customer improving its performance was 5.4 times higher than a manufacturer that acquired consulting services on its own. In another study of manufacturers in the Appalachian region, these enterprises were found to be tradition-bound in their ratings of various types of information sources—preferring their internal staff, customers, and suppliers. This study suggested that MEP service efforts would need time to build credibility and trust in their clientele base (Glasmeier et al, 1998). The MEP engaged in several formal efforts to collaborate with other service providing organizations. Shapira and Youtie (1997) found that MEP sponsorship led to greater service coordination than individual center efforts alone or state government demands would have provided, which in turn, generally improved the services to MEP clients, albeit at a significant expenditure of resources for validating and coordinating with these providers. On the other hand, Yin et al (1998) found that SBDC centers in a special MEP-SBDC pilot program did not have substantially better service delivery than a comparison group of MEP centers with their own SBDC collaboration initiatives.
Partnership with state governments has been an important element to MEP’s funding formula. This formula has assumed an equal contribution of state and federal funding, with remaining revenue coming from client fees or other sources. A simulation of the federal-state relationship concluded that two-
thirds of the states would not provide state funds if federal funding was discontinued. (MEP 1998)
Center-to-center comparisons were the subject of a few evaluation studies. Chapman (1998) conducted a distinctive data envelope analysis of MEP centers. This work showed that different centers were at the frontier of different service areas, with no one center consistently in the lead. Wilkins (1998) also performed center comparisons involving 14 centers, similarly finding that no one center excelled on all measures.
The mix of services and delivery methods was the subject of various evaluations in the 1990s. GAO’s seminal 21-year-old manufacturing center review found there was a misalignment between the legislation establishing the centers—which emphasized technology transfer from the federal laboratories— and the needs of small manufacturers for assistance with proven technologies (GAO 1991). A 1993 National Academies study reiterated that although the program’s enabling legislation focuses on technology upgrading, center specialists emphasize that a broader range of management and training, as well as technology, services are required. (National Academy of Sciences, 1993). Youtie and Shapira (1997) observed that the type of outcome is associated with service mix; marketing and product development services were 60 percent more likely to lead to sales outcomes, energy products more likely to lead to cost savings, plant layout and environmental projects more likely to capital expenditure avoidance, and quality projects not strongly associated with any type of outcome. Oldsman and Heye (1998) performed a simulation which showed that services which enable a manufacturer to raise piece prices generate more profit than services which enable reduction in scrap rate. Luria (1997) maintained that the program’s service mix attracts cost-minimization/lean companies that are not on the path to increasing productivity. Cosmos Corporation led case studies of high impact projects with 25 manufacturing clients (1997) six manufacturing clients (1998) and seven different highly transformed manufacturers (1999). The results indicated the importance of integration of services and making discontinuous changes across multiple systems with leadership by top management.
Although most MEP technical assistance services are delivered on a one-on-one basis to a single manufacturing client at a time, MEP invested in a networking service delivery pilot from 1996 to 1998. This pilot had an extensive evaluation component, capped by a survey 99 members of 13 separate business networks. The results indicated that the median net benefit of network participation to the firm was $10,000, while some members experienced significantly higher benefits, raising the mean to $224,000 (Welch et al., 1997). Kingsley and Klein (1998) further found, in a meta-analysis of 123 case studies of networks, that networks with private sector leadership and funding were more likely to be associated with new business outcomes.
Intermediate outcomes were a major source of examination in 1990s-era evaluations. Several client survey-based studies qualitatively indicated that a higher percentage of companies engage in implementation following MEP
assistance. Two-thirds of Georgia MEP customers took action on center recommendations (Youtie and Shapira 1997). Nearly 30 percent of Massachusetts center customers would not have carried out changes without MEP assistance (Ellis 1998). Many client surveys also suggested positive views of performance improvement, with the GAO (1995) finding that 73 percent of manufacturing respondents across the nation had better business performance and Ellis (1998) indicating that 71 percent of Massachusetts manufacturers improved their competitiveness as a result of center assistance.
Technology adoption was an important focus of several evaluation studies. Shapira and Rephann (1996) observed that manufacturing technology assistance program participants in West Virginia were more likely to adopt individual technologies and be amenable to technological investments than non-participants, but did not have significantly higher aggregate adoption across a range of technologies. The Luria and Wiarda (1996) Performance Benchmarking database analysis indicated that MEP customers adopted most technologies (with the exception of information technologies) more quickly than non-MEP customers. Evidence from case studies of centers in Northern Pennsylvania, Michigan, Minnesota conducted by Kelly (1997) led to the conclusion that the use of one-on-one services militates against widespread diffusion of knowledge and skills important for advanced technology usage.
Most of the evaluations try to get at business outcomes such as productivity as measured by value added. Several challenges in doing so are observed in these studies. The lion’s share of impacts was found to come from a small number of manufacturing clients, with many reporting small or no impacts (Oldsman 1996). Most manufacturers had difficulty calculating impacts, and the timing of measurement was found to be an issue in that customers overestimate benefits, especially sales impacts, and underestimate costs close to point of survey, except for small number of high impact projects (Youtie and Shapira 1997).
Customer surveys tended to present positive outcomes. Quantitative business outcomes tended to present a more moderate picture, however, particularly when comparison groups were used to control for other factors and explanations besides program assistance. Some comparison group studies surveyed all manufacturers in a particular region (as in Youtie et al. 1998) or in a national sample (as in Luria 1997 and Luria and Wiarda 1996). Others linked MEP customer information to administrative datasets at the Census Bureau or Department of Labor and selected enterprises from these datasets to match client profiles (Jarmin 1997, 1999; Oldsman 1996; Nexus Associates 1996). Most of these studies focused on productivity as measured by value-added per employee, although other outcomes metrics were used as well. Jarmin (1997, 1999), Shapira and Youtie (1998), and Nexus Associates (1999) found clients to have higher growth in value-added per employee than non-clients. These analyses tended to focus on a few centers/network of centers (Georgia in the case of Shapira and Youtie, and Pennsylvania in the case of Nexus Associates).
Jarmin’s analysis of eight MEP centers from 1987 to 1992 found productivity increases in clients over non-clients ranging from 3.4 to 16 percent. Nexus Associate’s analysis of Pennsylvania centers reported higher labor productivity of 3.6-5 percent in clients as compared with non-clients. The average Georgia client had $366,000 to $440,000 higher in value-added than non-clients. Other comparison group-based evaluations found fewer differences between served and un-served manufacturers. Analysis of the Performance Benchmarking dataset showed that MEP clients do better than non-clients in sales growth, job growth, and adoption of some process improvements, but clients are not significantly better than non-clients in growth in wages, profits, and productivity (Luria 1997). Evaluation of the New York program indicated that participating manufacturers added 5.7 percent fewer workers than similar, non-participating companies (Oldsman 1996). Because the MEP seeks to enhance productivity, implementation of efficiency measures may result in a diminishment of some factory worker positions. This reduction is not automatically a drawback as the program’s aim to promote long-term manufacturing competitiveness can lead to some declines along other dimensions.
The costs and benefits of manufacturing extension beyond those of the individual clients served was the subject of another set of studies. The results of these studies were reasonably positive. Cost-benefit analyses by Shapira and Youtie (1995), Nexus Associates (1996), and Michigan Manufacturing Technology Center (1996) demonstrate net public and private benefits of MEP assistance outpaces costs by a ratio in the 1:1 to 3:1 range. A Pennsylvania study (Nexus 1999) reported much more positive net returns to the state investment of 22:1. Thompson (1998) found the taxpayer payback to Wisconsin varied from slightly below break-even to positive. Several of these studies put forth methods to address various issues in cost-benefit analysis such as accounting for the full range of private and public costs and benefits, addressing returns and investments over time, and giving consideration to zero-sum re-distribution of benefits and value-added capture through downward adjustment of sales impacts for export sales and value-added (Shapira and Youtie 1995).
3. EVALUATION STUDY RESULTS: 2000s
The studies conducted in the 2000s reflected a different climate than was seen in the previous decade. Whereas the 1990s was a period of program expansion and experimentation, the 2000s saw substantial fluctuations in the program’s budget, a systematizing of services, and consolidation of the number of centers as certain centers were combined into statewide or regional programs. The MEP evaluation system itself became more standardized as the evaluation working group of the 1990s was ended, center-level personnel became reporting rather than evaluation specialists, and metrics decisions were raised to the level of the center director rather than to center-level evaluators. This systematization is reflected in the MEP evaluation plan and metrics published by Voytek and colleagues in 2004 (Voytek et al., 2004). Evaluations in the 2000s presented in
this paper were distinctive in their greater use of international comparisons and program assessment using expert panelists and document review. The table in the Appendix shows that six of the nineteen assessments published in the 2000s involved expert panelists or document review. Five used survey methods and three used comparisons with services or manufacturers in other countries.
Market penetration was addressed in several of these studies. Stone & Associates and CREC (2010) found penetration to be a concern in that the MEP only serves 10 percent of manufacturers, 2 percent with in-depth assistance. Although this level of service could be argued a reflection of cherry picking of clients, Deloitte (2004) reported that Pennsylvania manufacturing extension centers did not engage in “creaming;” a comparison of the credit rating of Pennsylvania manufacturing clients and a matched group indicated that the differences were not statistically significant. On the other hand, GAO (2011) examined the relationship between fees charged and penetration, finding that 80 percent of MEP centers were very or somewhat likely to prioritize revenue generation projects with larger clients.
Concerns about mission in terms of the programs’ relationship with the private sector were raised to higher policy levels in the 2000s. Four governmental assessments—OMB (2002), National Commission on Fiscal Responsibility and Reform (2010), Schact (2011) and GAO (2011)—were devoted to this issue. OMB’s Program Assessment Rating Tool (PART) evaluated the MEP program purpose and design, strategic planning, management, and results and accountability. Rated moderately effective, the assessment determined that “It is not evident that similar services could not be provided by private entities.” The National Commission on Fiscal Responsibility and Reform concluded that MEP provides services that exist in the private sector. GAO’s review of the cost share match requirements for centers reported that rural areas, which often are too costly for private consultants to serve, also were harder for the MEP to serve as centers increasingly found it necessary to develop cost share. Schact’s Congressional Research Service report also addressed the issue of the appropriate level of federal investment for the program. To address the concerns raised in the OMB assessment, the National Academy of Public Administration (NAPA 2003) used a panel and document review and interview process to conclude that barriers to productivity improvement continue for small and medium-sized manufacturers and these firms are underserved by the private market.
Management of the program is another major substantive area of study in 2000-era evaluations. The 2003 NAPA review concluded that “MEP is effective in its core mission of helping small manufacturers reduce the barriers to productivity improvement” (p. 44). The GAO (2002) PART review of the program also gave MEP top ratings along many program management dimensions including program purpose, need, program and performance goals, strategic planning, collaboration, quality evaluations, budgetary goal alignment, financial management, proposal and grantee oversight, and achievement of
performance goals and cost efficiencies and effectiveness. Shrank and Whitford (2009) found the program to advance experimentation, diversity, and access to local knowledge. Although center-to-center variability continued to be observed as it was in the Chapman and Wilkins studies, center-level evaluations also indicated the existence of stronger and weaker performing centers. An analysis of groups of large and small center MAIM scores in 2001, 2003, and 2005 observed that there were no consistent top performing centers from period to period, although a few centers landed near the top in many of the periods under analysis(Youtie 2005). NAPA (2004) found strong performance differences between centers; a substantial association was evidenced between high performing centers and number of clients served, years in operation, number of full time equivalent (FTE) employees for the center per million dollars of federal investment, and ratio of state dollars. A study of the manufacturing extension center in Arkansas found that it and its partners complied with MEP’s implementation resource criteria and program goals (Russell 2011).
Program impacts continued to be a focal point of a set of evaluations. MEP metrics became systematized and focused primarily on the results of the client survey. As Luria noted, centers are accustomed to the survey; however it is marked by issues such as large numbers of clients that cannot monetize the effects of program assistance, the significant role of outliers, attribution concerns, and the importance of focusing on value-added.4 MEP has sought to respond to some of these issues, for example, by applying value-added adjustments to sales results from the MEP survey in its bottom-line client impact MAIM metric (Voytek et al, 2004).
Several states conducted evaluations of their centers’ outcomes and assessments of individual centers or regions of centers were also published during this period. The Deloitte assessment of Pennsylvania extension service impacts concluded that productivity and fiscal impact results from the Nexus Associates 1999 evaluation persisted into the 2000-2003 time period based on findings that the client mix in the more recent period was the same as it was in the earlier study, customer dissatisfaction had not increased, and MEP customer survey results showed the Pennsylvania centers to be high performers in terms of impacts. In contrast, Davila’s evaluation of the Chicago center found that in an earlier period, clients were more likely than non-clients to have adopted new machinery and equipment, but by the next year, clients were similar to the general population in this regard (Davila 2004). Survey-based analyses of Georgia clients and non-clients in 2008 and 2010 maintained prior findings of higher increases in value-added per employee for clients. The Georgia results also differed sharply from those in comparable regions in the UK and Spain in that manufacturing extension customers in Georgia were more apt to engage in product and process innovation than similar non-customers (Roper et al, 2010).
________________
4See Luria (2011).
Georgia survey results were also used to address certain issues, for example, rural-urban differences; the Georgia survey found that although rural and urban manufacturers were similar in their adoption of hard technology, rural manufacturers were less likely to use soft technologies and supply chain integration than their urban counterparts (Youtie and Shapira 2005). SRI and Georgia Tech (2008) found that Ohio MEP customers were more likely to have retained jobs than non-customers, controlling for industry, size, and other factors.
Updating the original Jarmin study into the period in which the MEP achieved full national coverage became a priority for the program. SRI and Georgia Tech released a study in 2009 which aimed to provide this update (Cheney et al., 2009). The study was not without problems, in that measures of selection bias used in the earlier study—such as proximity to an MEP office or location in a metropolitan area—did not work in the 2009 study when MEP offices were more widely accessible. The study used two different models to assess productivity impacts of clients and non-clients from 1997 to 2002 and the results of these two models diverged sharply, with one indicating positive effects and the other, negative effects. However, both models found positive and significant productivity growth was associated with MEP assistance for smaller establishments, certain types of MEP services, and a short delay (one or two years) after receipt of service.
The most significant focus of 2000s-era evaluations was the need for a strategic shift in the program’s orientation towards product development, marketing, and technology rather than cost reduction. The Next Generation Manufacturing (NGM) survey, led by ASMC, indicated that one-quarter of small manufacturers did not engage in world-class practices in six strategic areas. NAPA (2004) found that the MEP cost reduction service orientation was not sufficient to maintain small and medium-sized enterprise (SME) competitiveness. Helper and Wial (2010) suggested that client-level assistance decisions may not pay sufficient attention to national manufacturing policy goals. Ezell and Atkinson (2011) reported, in an international comparison of 16 countries’ manufacturing programs, that the MEP has not made the transition from continuous improvement to growth as many of the other programs had. However, Shapira et al (2011) found that these programs are heavily embedded in their countries’ national innovation system, which limits the ability for facile adoption across country borders. MEP added a set of growth services, Eureka! Winning Ways (E!WW), in 2006 as a pilot and 2007 as a full-service launch to address, in part, these concerns. SRI and Georgia Tech (2008) found that customers of the E!WW pilot program had a distinctive profile in terms of using and experiencing benefits from this service. This profile included attributes such as being in industries with job losses, private family-owned firms, concentrated structure for product development, and history with technological implementation. The observation suggests that there are demand considerations involved in implementation of this type of service area.
4. RECOMMENDATIONS FROM EVALUATION STUDIES
Thirteen of the evaluation studies profiled in this paper included recommendations. Half of these studies explicitly referred to the need for MEP to transition to services that involve new product and market offerings. The integration of advanced technology into products has also been referenced. In addition, there are three, relatively diverging recommendations concerning funding—two for substantial increase federal funding (Stone & Associates and CREC 2010; Helper and Wial 2010), a second for greater flexibility in the funding formula (NAPA 2004), and a third for sun-setting federal funding (National Commission on Fiscal Responsibility and Reform 2010). The NAPA (2004) and Ezell and Atkinson (2011) studies promoted the need for more attention to exporting and global supply chains. MEP Advisory Board (2010) advocated greater green service offerings and (as did Deloitte 2004) workforce retention and development related assistance.
For some 15 years MEP has received recommendations to transition to product development, marketing, and technology-intensive services. The program has certainly integrated aspects of this counsel into its Next Generation MEP strategic plan5—which promotes an enterprise wide and market position orientation to manufacturers rather than a problem-based one —and into certain service offerings, for example E!WW growth services. Given that these recommendations persist in studies published through 2011, however, greater examination of the factors that constrain these types of offerings and approaches, such as those noted in the E!WW pilot evaluation (SRI and Georgia Tech 2008), may merit further attention. The NAPA (2004) study also pointed to the funding mix and business model as constraints on widespread use of these types of services. The need for a different funding mix would allow centers to devote more resources to these types of services rather than to revenue generation. Product development services and greater integration of advanced technology also requires different partnership arrangements, extensive industry familiarity, and cross-geographic boundary operations.
5. DISCUSSION
This collection of manufacturing extension evaluations illustrates the usefulness and merit of understanding who the customer is, what types of assistance are given, what investments and resources are used, and what kinds of outcomes are produced. MEP’s system, which shifted from exploratory to standardized, has shown the usefulness of maintaining center, customer, and
________________
5Manufacturing Extension Partnership, Next Generation Strategy, Gaithersburg, MD
<http://www.nist.gov/mep/ngs.cfm>. (Accessed January 30, 2012).
project information and post-service customer surveying to understanding the value that clients place on the service. While surveys of customers (and non-customers) are the most commonly used method, a broad mix of methods has been relied upon such as cost-benefit and economic and fiscal impact analyses, economic models which draw on administrative databases, performance benchmarking information sets, and logic-based case studies. A range of outcomes have been examined in these studies, including capital investments, cost savings, technology adoption, sales, and employment. Still productivity as measured by value-added per employee remains the “gold standard” for assessing program effects. One of the challenges facing these evaluations is the potential effect of observed and unobserved factors in the economy, industry, and service provision to name a few of these factors. Many evaluations have used comparison groups to distinguish MEP’s intervention from these other factors. Despite the use of comparison group studies, challenges remain in efforts to distinguish the effect of MEP assistance, which is often small in scale, from that of other extraneous factors.
External reviews of the MEP have also been widely used. These reviews typically have relied on interviews, document review, site visits, and analysis of existing program and customer data. These types of reviews have been useful in providing a perspective that is less tied to day-to-day service issues and more strategic and forward-thinking. While the largest share of, particularly quantitatively-oriented evaluations, are useful for program justifications, these external assessments in particular play a central role in enabling program learning about un-served market demand, opportunities not yet fully addressed, and relationships within the manufacturing policy and service system, including the private sector system.
This is not to say that learning from quantitative studies is rare. Although many evaluations emphasize quantitative impacts, these studies have implications for learning. In terms of resources, studies evidenced that the more resources devoted to a client, the more likely the client is to achieve impacts associated with the assistance. In addition, product development and marketing projects have been more likely than other substance areas to yield sales impacts. At the same time, important soft impacts continue to be de-emphasized in favor of quantitative outcomes that help with program justification. Similarly evaluations tend to be oriented around projects, with other forms of assistance such as training and supplier linkage still not receiving much attention. The potential downside is that what the program measures can be what the delivery system emphasizes.
Most consistent across the 20 years has been the recommendation that MEP shift from an emphasis on cost reduction toward product and technologically oriented services. To be sure, MEP has taken considerable steps
TABLE APP-B-1 Summary of Recommendations in Evaluation Studies
| Author/Year | Recommendations |
| Luria (1997) | Nurture distinctive manufacturers with proprietary or design-intensive products and encourage other manufacturers to follow this strategy. |
| Modernization Forum and Nexus Associates (1997), Oldsman (1997) | Enhance work with consultants through using resources to identify them, application materials, project proposals, selecting consultants, developing standard contracts for working with them |
| Oldsman and Heye (1998) | Help companies become more distinctive as well as more efficient. |
| NAPA (2004) | Focus more on technology diffusion, product development, supply chain integration, and integrating the national network with other state/university providers and private sector firms. Provide greater flexibility in funding. |
| Davila (2004) | New evaluation metrics and approaches should be developed to measure adaptive learning, worker benefits, public benefits and costs, spillover effects, and how to allocate scarce MEP resources. |
| Deloitte (2004) | Lower barriers to access; offer more business strategy, product innovation, worker retention services; continue process innovation; support and grow advocacy and research for SMEs |
| Youtie (2005) | Examine consistently high performing centers' service mix and survey practices |
| SRI and Georgia Tech (2008) | Focus marketing on target customer characteristics; think strategically about participant mix; select and train growth coaches; use team-based approaches and fewer idea limitations in service design; evaluate after one year |
| Helper and Wial (2010) | Enhance funding for MEP to provide more product and market development services and greater coordination between MEP and other federal programs for manufacturers. |
| Stone & Associates and CREC (2010) | Expand program scale from current levels of 7,000-8500 firms served to 30,000 with substantially greater funding |
| MEP Advisory Board, Yakimov, Woolsey (2010) | Streamline innovation and growth services, target green services, emphasize exporting, develop talent |
| National Commission on Fiscal Responsibility and Reform (2010) |
Eliminate federal funding for the MEP |
| Ezell and Atkinson (2011) | Offer technology acceleration programs and practices, exporting, energy efficiency, quality, standards, and design |
in this direction through its strategic planning and growth services offerings. This is an important area for a fresh round of evaluation studies to catalog and describe interventions, pilot new measurement approaches and datasets (such as patents or SBIR awards) and their relationship to existing metrics, and include recommendations that go into greater depth concerning service areas and outcomes that have yet to be addressed.
6. CONCLUSION
Does MEP work? Would the country be substantially worse off without the program? Despite this collection of evaluations, one finds limitations in the ability to fully address these questions. MEP is a modestly funded program so it is difficult to separate out the effects of the program from other larger influences. The program’s small size makes it hard to judge it against the broader economic, industrial, and other forces that affect the manufacturing sector in the United States if not globally. In addition, the zero-sum issue (helping one U.S. manufacturer could hurt another) is at play, notwithstanding certain social benefits of having stronger, more internationally competitive manufacturers in the U.S. economy rather than weaker ones. While some national agency reviews and audits of the program call attention to weaknesses in the larger manufacturer sector as an indication of the value of the MEP, one might question the usefulness of this yardstick to judge the orders-of-magnitude smaller MEP program.
Another set of limitations concern the inability of MEP clients to fully report quantitative impacts. The majority of MEP clients do not report quantitative impacts in response to the independent client survey. Many SME clients do not have the capabilities and systems to calculate outcomes in the way that is requested. Shapira et al (2004) found that just under half of the companies interviewed were unable to provide data on total production costs. White et al. (2012) observed that 27 percent of manufacturer responses in the Census of Manufacturers in 2002 and 2007 had imputed values for missing data about the value of shipments (i.e., sales); this same figure for total cost of materials was 42 percent and imputed figures were even higher in certain industries. Moreover, the Cosmos Corporation case studies conducted of exemplary MEP engagements—which had evaluation specialists visiting client companies, interviewing respondents, and reviewing company records—typically found additional quantitative impacts that were not reported to MEP through surveys.
Spillover effects also are difficult to assess without detailed surveys of MEP clients’ customers, notwithstanding the application of econometric models to proxy these indirect effects.
Within these limitations, this paper addresses the question of the MEP’s effectiveness by observing that the lion’s share of evaluations of the MEP found the program to be effective. To examine the question of what would happen in the absence of the MEP, the most helpful evaluations are the 15 studies with a comparison group. Some of these comparison group-based evaluations use administrative databases, which have limited information but greater representativeness of the population, while others use surveys of served and un-served firms, which have some issues in representing the un-served firm population but tend to include more variables of interest for controlling extraneous effects. In addition, most of these are at the state or local level, with only three being nationally representative studies. Within these strictures, all 15 of the studies found some positive and significant effects in firms served by the program relative to un-served firms after controlling for size, industry, and other factors. These effects included improvement in sales growth, productivity (value added per employee) growth, job retention (and in one case, job growth), and technology and process improvement adoption. Six of these also found negative results in non-client gains over client parameters in wage, profitability, productivity, job growth, technology and networking adoption. Thus, while there are some mixed results, most studies find the presence of the MEP to be beneficial.
To understand the effects of the program, it can be useful to trace the chain of assistance to outcomes in the case study volumes published by Cosmos Corporation. Although these case studies are not randomly selected, they do illustrate how program assistance can lead to firm outcomes. A few exemplars follow. One case study company re-vamped its product line, turning profitable for the first time in a few years, by applying cost-based marketing practices, which it learned about from an extension center training program and subsequent engagement. A technological problem was preventing another company from achieving millions of dollars of new orders until the local MEP connected two research laboratories to help the company address this problem. Another company’s mindset and confidence were changed after going through an MEP center-led growth services ideation session, leading to new business lines and sales. The new president of a family-owned business responded to supply chain pressures by transforming the firm, with the help of the extension center, through strategic planning, quality and cellular manufacturing initiatives, adoption of systems integrating manufacturing and accounting, customer-profitability analyses, and human resource training and apprenticeship opportunities; the results included substantial sales gains and payroll increases. Manufacturing clients directly attribute these outcomes to the MEP assistance. These studies illustrate the diverse approaches to serving and benefitting manufacturers.
REFERENCES
American Small Manufacturers Coalition (2009). Next Generation Manufacturing Study: Overview and Findings. Washington DC, June.
Chapman, R. (1998). Using Data Envelopment Analysis to Assess Performance of Manufacturing Extension Centers, NISTIR 6198, Gaithersburg, MD: National Institute of Standards and Technology, July.
Cheney, D, Ordowich. C, Youtie, J, Fernández-Ribas, A, Shapira, P (2009). Evaluating the Impact of MEP Services on Establishment Performance: A Preliminary Empirical Investigation. Technical Report. Arlington, VA: November.
Cosmos Corporation (1997). MEP Successes: A Case Study Approach. NIST Special Publication 916. Washington DC: Government Printing Office.
Cosmos Corporation (1998). MEP Successes: Case Study Series Exemplary Projects Case Studies. Washington DC: Government Printing Office, November 1998.
Cosmos Corporation (1999). MEP Successes: Case Study Series Transformed Firms Case Studies. Washington DC: Government Printing Office, April 1999.
Davila, N. (2004). Evaluating Manufacturing Extension: A Multidimensional Approach. Economic Development Quarterly. Vol. 18, No. 3, pp. 286-302.
Deloitte (2004), Manufacturing Pennsylvania’s Future: Regional Strategies that Build from Current Strengths and Address Competitive Challenges. Submitted to Industrial Resource Centers, PA Department of Community and Economic Development and Team PA Foundation.
Ellis, S. (1998). Evaluation of Massachusetts Manufacturing Partnership: Selected Findings. In P. Shapira and J. Youtie, editors. Manufacturing Modernization: Implications of Evaluation Results for Program Improvement and Policy Development: Proceedings of Fourth Workshop on the Evaluation of Industrial Modernization Programs, Atlanta, Georgia: Georgia Institute of Technology.
Ezell, S., Atkinson, R. (2011). International Benchmarking of Countries’ Policies and Programs Supporting SME Manufacturers. Information Technology and Innovation Foundation: Washington DC, September.
Feller, I. Glasmeier, A., Mark, M. (1996). Issues and perspectives on evaluating manufacturing modernization programs. Research Policy Vol. 25. No. 2, pp. 309-319.
Frazier, R.M. (2011). The Imperatives of Successful Policy Implementation: An Evaluation of the Hollings National Institute of Standards and Technology-Manufacturing Extension Partnership (NIST-MEP) Program’s Implementation in Arkansas (Doctoral dissertation). University of Arkansas.
General Accountability Office (2011). NIST Manufacturing Extension Partnership Program Cost Share, GAO-11-437R. Washington DC: Government Printing Office.
General Accounting Office (1995). Manufacturing Extension Programs: Manufacturers' Views of Services, GAO/GGD-950210216BR. Washington, DC.
General Accounting Office (1991). Technology Transfer: Federal Efforts to Enhance the Competitiveness of Small Manufacturers, GAO/RCED-92-30. Washington, DC.
Glasmeier, A., Fuellhart, K. Feller, I., Mark, M. (1998). The Relevance of Firm-Learning Theories to the Design and Evaluation of Manufacturing Modernization Programs. Economic Development Quarterly, Vol. 12, No. 2, pp. 107-124, May.
Helper, S., Wial, H. (2010). Strengthening American Manufacturing: A New Federal Approach. Washington DC: Brookings.
Hollings Manufacturing Extension Partnership Advisory Board, with Yakimov, G., Woolsey, L (2010). Innovation and Product Development in the 21st Century. Gaithersburg, MD, February.
Jarmin, R. S. (1998). Manufacturing Extension and Productivity Dynamics: Preliminary Evidence. In P. Shapira and J. Youtie, editors. Manufacturing Modernization: Implications of Evaluation Results for Program Improvement and Policy Development, Proceedings of Fourth Workshop on the Evaluation of Industrial Modernization Programs, Atlanta, Georgia: Georgia Institute of Technology.
Jarmin, R. S. (1999) “Evaluating the Impact of Manufacturing Extension on Productivity Growth” Journal of Policy Analysis and Management, 18 (1): 99-119.
Kelly, M. (1997). From Mission to Commercial Orientation: Perils and Possibilities for Federal Industrial Technology Policy, Economic Development Quarterly, November, Vol. 11, No. 4, pp. 313-328.
Kingsley, G., Klein, H. (1998). Interfirm Collaboration as a Modernization Strategy: A Survey of Case Studies, The Journal of Technology Transfer, Vol. 23, No. 1, Spring, pp.65-74.
Luria, D. (1997). Toward Lean or Rich? What Performance Benchmarking Tells Us About SME Performance, and Some Implications for Extension Center Services and Mission. In P. Shapira and J. Youtie, editors. Manufacturing Modernization: Learning from Evaluation Practices and Results: Evaluation of Regionally-Based S&T Programs Proceedings of Third Workshop on the Evaluation of Industrial Modernization Programs, Atlanta, Georgia: Georgia Institute of Technology, 6-29.
Luria, D. (2011). Evaluating the MEP Evaluation. Presentation at the workshop on Strengthening American Manufacturing: The Role of the Manufacturing Extension Partnership. Washington DC, November 14, 2011.
Luria, D., Wiarda, E. (1996). Performance benchmarking and measuring program impacts on customers: lessons from the Midwest Manufacturing Technology Center, Research Policy, Vol. 25, No. 2, pp. 233-246.
Manufacturing Extension Partnership (1994). Making a Difference for America's Manufacturers. Gaithersburg, MD: National Institute of Standards and Technology.
Manufacturing Extension Partnership (1997). MEP National Data Highlights. Gaithersburg, MD: National Institute of Standards and Technology, December.
Manufacturing Extension Partnership (1998). Review of Mission and Operations of Regional Centers of the Manufacturing Extension Partnership, Gaithersburg, MD: National Institute of Standards and Technology, February.
Manufacturing Extension Partnership (1998). Review of Mission and Operations of Regional Centers of the Manufacturing Extension Partnership, Gaithersburg, MD: National Institute of Standards and Technology, February.
Manufacturing Extension Partnership (2011). The Manufacturing Extension Partnership: Partnering for Manufacturing Innovation and Growth, June 2011, <http://www.nist.gov/mep/upload/MEP-PARTNERING-IMPACTSFEB2011.pdf>.
Michigan Manufacturing Technology Center (1996). Fifth Year Review. Ann Arbor, MI: Michigan Manufacturing Technology Center.
Modernization Forum and Nexus Associates (1997). Competition or Collaboration: The Role of Manufacturing Extension Centers in the Private Consulting Market. Working with Consultants: A Tool Kit for Manufacturing Extension Centers, Volume 3. Washington, DC: NIST MEP; Oldsman, E. 1997, May. Manufacturing extension centers and private consultants: collaboration or competition? Technovation. 17 (5), 237-244.
National Academy of Public Administration (2003). The National Institute of Standards and Technology’s Manufacturing Extension Partnership Program Report 1: Re-examining the Core Premise of the MEP Program. Washington DC, September.
National Academy of Public Administration (2004). The National Institute of Standards and Technology’s Manufacturing Extension Partnership Report 2: Alternative Business Models, Washington DC, May.
National Academy of Sciences (1993). Learning to Change: Opportunities to Improve the Performance of Small Manufacturers. Washington DC: National Academy Press.
National Commission on Fiscal Responsibility and Reform (2010). $200 Billion in Illustrative Savings, a supplement to a draft proposal by the co-chairs. Washington, DC.
Nexus Associates, Inc. (1996). Evaluation of the New York Manufacturing Extension Program: Final Report, prepared for the New York Science and
Technology Foundation/ Empire State Development. Belmont, MA, March 18.
Nexus Associates, Inc. (1999). The Pennsylvania Industrial Resource Centers: Assessing the Record and Charting the Future. Report prepared the Ben Franklin/IRC Partnership Board. Belmont, MA, October
Office of Management and Budget (2002). Program Assessment Rating Tool (PART), Detailed Information on the Manufacturing Extension Partnership Assessment, Washington, DC: Government Printing Office.
Oldsman, E., Heye, C. (1998). Waste not, want not—A look at the impact of manufacturing extension centers. Journal of Technology Transfer, Vol. 23, No. 1, pp. 37-41.
Oldsman, E (1996). Does manufacturing extension matter? An evaluation of the Industrial Technology Extension Service in New York. Research Policy, Vol. 25, No. 2, pp. 215-232.
Oldsman, E., (2004). Evaluating SME Programs: Learning from the NIST Manufacturing Extension Partnership. Paper presented at the SME Evaluation Workshop, Mexico City, September 23, 2004.
Roper, S, Youtie, J, Fernandez-Ribas, A. (2010). Knowledge, Capabilities and Manufacturing Innovation: A USA–Europe Comparison. Regional Studies Vol. 44, No. 3, pp. 253-279
Schact, W. (2011). Manufacturing Extension Partnership Program: An Overview, 7-5700. Washington DC: Congressional Research Service.
Schrank, A., Whitford, J. (2009). Industrial Policy in the United States: A Neo-Polanyian Interpretation. Politics and Policy Vol. 37, No. 4, pp. 521-553.
Sears, D, Blackerby, P. (1998). The MEP Evaluation Approach: Past, Present and Future In P. Shapira and J. Youtie, editors. Manufacturing Modernization: Implications of Evaluation Results for Program Improvement and Policy Development, Proceedings of Fourth Workshop on the Evaluation of Industrial Modernization Programs, Atlanta, Georgia: Georgia Institute of Technology, 161-170.
Shapira, P. (2003). Evaluating manufacturing extension services in the United States: experiences and insights in : P. Shapira and S. Kuhlmann (editors), Learning from Science and Technology Policy Evaluation: Experiences from the United States and Europe, Cheltenham, UK and Northampton, MA: Edward Elgar, 2003.
Shapira, P, Youtie, J, Kay, L (2011) “Building Capabilities for Innovation in
SMEs: A Cross-Country Comparison of Technology Extension Policies and Programs,” International Journal of Innovation and Regional Development Vol. 3-4, pp. 254-272.
Shapira, P., Youtie, J. (1995). Assessing GMEA's Economic Impacts: Towards a Benefit-Cost Methodology. Atlanta, Georgia: Georgia Institute of Technology, March (Revised October, 1996).
Shapira, P., Youtie, J., Roessner, J.D., (1996). “Current Practices in the Evaluation of U.S. Industrial Modernization Programs,” Research Policy, Vol. 25, No. 2, 1996, pp. 185-214.
Shapira, P., Youtie, J. (1997). Coordinating Manufacturing Extension Services, The Journal of Technology Transfer, Vol. 22, No. 1, Spring, pp. 5-10.
Shapira, P., Youtie, J. (1998). Evaluation Industrial Modernization: Methods, Results, and Insights from the Georgia Manufacturing Extension Alliance” The Journal of Technology Transfer, Vol. 23, No. 1, Spring, pp. 17-28.
Shapira, P., Rephann, T. (1996). The adoption of new technology in West Virginia: Implications for manufacturing modernization policies, Environment and Planning C: Government and Policy, Vol. 14, pp. 431-450.
Shapira, P., Youtie, J., Wang, J., Hegde, D., Cheney, D., Franco, Q., Mohapatra, S. (2004). Re-assessing the Value of Information and its Impact on Productivity in Small and Midsize Manufacturers. Atlanta Georgia and Arlington, VA: Georgia Tech Policy Project on Industrial Modernization and SRI International.
SRI and Georgia Tech (2008) Eureka! Winning Ways: Analysis of Early Client Experiences. Arlington, VA, August.
SRI and Georgia Tech (2009) Making an Impact: Assessing the Benefits of Ohio's Investment in Technology-based Economic Development Programs. Arlington, VA, September.
Stone & Associates and the Center for Regional. Economic Competitiveness (2010). Re-examining the Manufacturing Extension Partnership Business Model: Alternatives for Increasing the Program’s Impact on US Manufacturing Sector Performance” Gaithersburg, MD, October.
Swamidass, P. (1994). Technology on the Factory Floor II: Benchmarking Manufacturing Technology Use in the United States, Washington DC: The Manufacturing Institute.
Thompson, C. (1998). Local Politics, National Policy, and the Taxpayer-Payback of Manufacturing Extension, The Journal of Technology Transfer, Vol. 23, No. 1, Spring, pp.37-42.
Voytek, K., Lellock, K., Schmit, M. (2004). Extension Partnership Program Developing Performance Metrics for Science and Technology Programs: The Case of the Manufacturing. Economic Development Quarterly, Vol. 18, No. 2, May, pp. 174-185.
Welch, D., Oldsman, E. Shapira, P., Youtie, J., Lee, J. (1997). Net benefits: An assessment of manufacturing business networks and their impacts on member companies. Chapel Hill, NC: USNet and Regional Technology Strategies.
White, T.K., Reiter, J., Petrin, A. (2012). Plant-level Productivity and Imputation of Missing Data in U.S. Census Manufacturing Data. National Bureau of Economic Research Working Paper No. 17816.
Wilkins, T. (1998). Benchmarking Manufacturing Extension Centers. In P. Shapira and J. Youtie, editors. Manufacturing Modernization: Implications of Evaluation Results for Program Improvement and Policy Development: Proceedings of Fourth Workshop on the Evaluation of Industrial
Modernization Programs, Atlanta, Georgia: Georgia Institute of Technology.
Yin, R., Merchlinsky, S., Adams-Kennedy, K. (1998). Evaluation of MEP SBDC Partnerships. Bethesda, MD: COSMOS Corporation.
Youtie J., Shapira, P. (1997). Tracking Customer Progress: A Follow-up Study of Customers of the Georgia Manufacturing Extension Alliance, Journal of Technology Transfer, Vol. 22, No. 2, Summer, pp. 43-52.
Youtie, J., Shapira, P. (1997). GMEA 1997: Review of Results. Evaluation Working Paper E9701. Atlanta, Georgia, March.
Youtie, J., Shapira, P. (1998), Summary of Manufacturing Extension Impact Studies, Georgia Tech Policy Project on Industrial Modernization, Atlanta, GA: Georgia Institute of Technology.
Youtie, J., Shapira, P. (2005). The Challenge of Manufacturing Innovation:
Industry, Rurality, and Competitiveness in the State of Georgia. Evaluation Working Paper E2501. Atlanta, Georgia, June.
Youtie, J., Shapira, P., Kay, L., Rivera, A., Lynch, B., Cutler, G., Fernandez-Ribas, A. (2008). Innovation in Manufacturing: Needs, Practices, and Performance in Georgia 2008-2010. Atlanta Georgia: Georgia Tech Program in Science, Technology, and Innovation Policy.
Youtie, J., Shapira P., Kay, L, Dodonova, D., Sabbarese, D., Morales, C. (2010). Innovation in Manufacturing: Needs, Practices, and Performance in Georgia 2010-2012. Atlanta Georgia: Georgia Tech Program in Science, Technology, and Innovation Policy.
SUMMARY OF MANUFACTURING EVALUATION STUDIES
| Author/Year | Method | Focus | Main Findings |
| GAO (1991) | Interviews, legislative history, on-site visits | Four original Manufacturing Technology Centers | Legislation establishing these centers set transferring laboratory technologies to small businesses, but the centers find that most manufacturers need off-the-shelf technologies. |
| National Academy of Sciences (1993) | Expert panel, workshops | Seven Manufacturing Technology Centers | Despite emphasis of enabling legislation on technology upgrading of small manufacturers, a broader range of services is required; sunset provisions encourage large company focus. |
| MEP (1994) | Center surveys of customer impacts | MEP customers | Benefits per company anticipated by 610 firms responding to MEP center surveys in 1994 included 5.5 jobs added or saved, $43,000 savings in labor and material costs, and an increase of almost $370,000 in sales. Benefits exceeded federal costs by 8:1 ratio. |
| Swamidass (1994) | Member survey | National Association of Manufacturers members | Only 1 percent of manufacturers say government is an important source of assistance in technology investment decisions, suggesting that market penetration of modernization services is low. |
| Author/Year | Method | Focus | Main Findings |
| GAO (1995) | Survey of MEP manufacturing customers | Nationwide | 73 percent of 389 respondents indicated that their overall business performance had been improved. |
| Shapira and Youtie, (1995) | Benefit-cost study | Georgia, MEP customers | Combined net public and private economic benefits exceed costs by a ratio of 1.2:1 to 2.7:1 |
| Feller, Glasmeier, and Mark (1996) | Review of existing evaluations | Various federal and state programs assisting SMEs | Methods do not address key areas of significant program-level need. |
| Luria and Wiarda (1996) | Benchmarking survey, comparison group | Michigan MTC customers; nationwide manufacturers | MEP customers improve faster than comparable firms in a comparison group. However, assisted firms had smaller increases in computer-based technologies. 17 key technology and business performance metrics used; ITI Performance Benchmarking Service dataset. |
| Michigan Manufacturing Technology Center (1996) | Benefit-cost study | Michigan, MTC customers | Combined net public and private economic benefits exceed costs by a ratio of 1.45:1 |
| Nexus Associates (1996) | Survey of NYMEP customers, comparison group, benefit-cost study | NYMEP customers | NYMEP generated $30 million to $110 million of value-added income; 510 to 1920 jobs. Benefit cost ratio of 0.14:1.0 to 0.51:1.0. Cobb-Douglas Production Function; A priori prediction of high impact oversampling; ITI |
| Author/Year | Method | Focus | Main Findings |
| Performance Benchmarking Service dataset is control group. |
|||
| Oldsman (1996) | Customer Survey, comparison group | New York Industrial Technology Extension Service customers | Total annual cost savings for the 1,300 companies participating in the program between July 1990 and March 1993 is $30 million. Majority companies said their ability to compete was improved as a result of the program. The average customer added 5.7 percent fewer workers than similar, nonparticipating companies. |
| Shapira and Rephann (1996) | Survey with comparison group, multivariate regression | West Virginia, manufacturing extension customers and non-customers. | Participation in a manufacturing technology assistance program is not yet associated with higher levels of aggregate new technology use, but it is found to associated with adoption of specific technologies and receptivity to new technology investment. The study’s results also confirm the value of training and suggest that a strategy of targeting smaller and medium-sized plans with services focused on multiple clustered locations may be effective in stimulating new technology use among these manufacturers. |
| Author/Year | Method | Focus | Main Findings |
| Shapira, Youtie, and Roessner (1996) | Review of existing evaluations | Various federal and state programs assisting SMEs | Most evaluations emphasize activity reporting and customer valuation to avoid burdening clients, but important issues require comparative approaches and control groups. |
| Cosmos Corporation, NIST MEP, 1997 | Case studies | 25 MEP engagements in 13 states | Structured case studies of MEP projects show that program services help smaller manufacturers to modernize their operations, improve quality, and increase profitability through such means as reducing waste, redesigning plant layouts, and improved inventory control and employee training. |
| Jarmin (1997) | Longitudinal study, comparison group | Longitudinal Research Databases, 1987-1992, MEP customer data from 8 centers | Manufacturing extension clients had 3.4-16 percent higher growth in value-added per worker than non-clients . Standard value-added production function; Controls for self-selection. |
| Kelly (1997) | Case studies of 3 centers | Northern Pennsylvania, Michigan, Minnesota | MEP's focus on one-on-one assistance fails to address problems that limit the diffusion of knowledge and skills in using more advanced technologies. |
| Luria (1997) | Performance Benchmarking Service dataset, comparison | Michigan MTC customers | Customers improved to a greater extent than non-customers in sales growth, employment |
| Author/Year | Method | Focus | Main Findings |
| group | growth, and adoption of certain process improvements and technologies. However, center customer growth in wage rates, profitability, and labor productivity were not significantly different from that of non-customers. The author attributes the results to the center’s service mix, which attracts companies that are not on a rising productivity path, combined with intense customer price pressures. |
||
| MEP (1997) | Telephone survey of MEP customers by U.S. Census Bureau | Nationwide, MEP customers | MEP customers report $110 million increased sales, $16 million from reduced inventory levels, $14 million in labor and material savings, 1,576 net jobs created, 1,639 total jobs retained as a direct result of MEP services. Information provided 9-10 months after project close. |
| Modernization Forum and Nexus Associates (1997), Oldsman (1997) | Survey, comparison group | 750 MEP clients, 800 comparison companies, 202 private consultants nationwide | Only 7 percent of MEP clients report that the MEP offers the same services as private consultants. The probability of a typical MEP customer improving its performance is 5.4 times greater than a manufacturer that secured consulting services on its own. |
| Author/Year | Method | Focus | Main Findings |
| Shapira and Youtie (1997) | Case studies and analysis of reporting data | 6 MEP centers and their partnerships | MEP sponsorship has led to increased service coordination not readily obtained through individual center efforts alone or through demands of state governmental funders. Increased service coordination, in turn, has mostly improved the assistance delivered to firms, though significant expenditure of resources was required to achieve these benefits. |
| Welch, Oldsman, Shapira, Youtie, and Lee (1997) | Survey of manufacturing network customers | 99 members of 13 separate business networks | The median net benefit of network participation to the firm is $10,000 (the average was $224,000). |
| Youtie and Shapira, (1997) | Customer survey - longitudinal tracking study | Georgia, MEP customers | 68 percent assisted firms took action, with more than 40 percent percent reporting reduced costs, 32 percent improved quality, 28 percent capital investment . Customers overestimate benefits and underestimate costs close to point of survey, except for small number of high impact projects. |
| Youtie and Shapira (1997) | Customer survey; project-impact analysis | Georgia, MEP customers | Product development, marketing projects are 60 percent more likely to lead to sales increases; energy projects are most likely to lead to cost savings; |
| Author/Year | Method | Focus | Main Findings |
| plant layout, environmental projects help companies avoid capital spending. Quality projects do not rate highly anywhere, although they require the largest MEP customer time commitment. |
|||
| Chapman (1998) | Data envelopment analysis of MEP reporting data. | Compares 51 MEP centers using second half of 1996 data. | Centers excel in different areas. (Specifically, MEPs on the frontier in one area may move out of/not be on the frontier in another area). |
| Cosmos Corporation (1998) | Logic-based case studies | 6 case studies from 6 centers | Integration of certain interventions lead to substantial outcomes. |
| Ellis (1998) | Surveys of MEP customers | Massachusetts MEP customers | 29 percent MMP customers may not have undertaken changes without MMP assistance. 71 percent of MMP customers reported some improvement in competitiveness. |
| Glasmeier, Fuellhart, Feller, and Mark (1998) | Survey of 51 manufacturers | Information requirements of plastics industries the Appalachian Regional Commission’s counties in Ohio, Pennsylvania, and West Virginia. | Firms most often use traditional information sources because of their credibility and reliability, so MTCs need time to establish a history to demonstrate their effectiveness to firms. |
| Author/Year | Method | Focus | Main Findings |
| Kingsley and Klein (1998) | Meta-analysis of 123 case studies | Cases of industrial networks in Europe, North America, and Asia | Network membership can be built with the sponsorship of parent organizations and with public funding, but the networks that generate new business are associated with private sector leadership and at least some private sector funding. |
| MEP (1998) | Telephone survey of MEP customers by U.S. Census Bureau | Nationwide, MEP customers | MEP customers report increased sales of nearly $214 million, $31 million in inventory savings, $27 million in labor and material savings, and a $156 million increase in capital investment as a direct result of MEP services. Information provided 9-10 months after project close. |
| MEP (1998) (with Nexus Associates) | Simulation model | MEP centers nationally | 2/3 of states would end state funding if federal funding were ended; 60-70 percent of centers would not be able to maintain a focus on affordable, balanced service. |
| Oldsman and Heye (1998) | Simulation | Hypothetical metal fabrication firm | Reducing scrap by 2 percent raises profit margins by 1.2 percent, but increasing piece price by 2 percent adds $200,000 a year. |
| Sears and Blackerby (1998) | MEP evaluation plan and metrics | National system | MEP’s evaluation is designed to contribute to center-level and system-level performance through attention to customer |
| Author/Year | Method | Focus | Main Findings |
| information, data quality, data analysis, and producing results. |
|||
| Shapira and Youtie (1998) | Survey of manufacturers, comparison group | Georgia manufacturers with 10+ employees | The average client plant had a value-added increase of $366k-$440k over non-clients. Cobb-Douglas Production function; Controls include use of other public and private sector service providers. |
| Thompson (1998) | Benefit-cost study, simulation | Wisconsin taxpayers | Taxpayer payback ratios of 0.9:1.0 to 3.5:1 from the point of view of the state taxpayer who receives a federal subsidy. However, there is considerable variation in payback ratios by industry and by service type. Increasing sales shows the greatest taxpayer-payback. |
| Wilkins (1998) | Center management benchmarking | 14 MEP centers | No single measure designates a high or low performing center. Costing rate of $200-$400 per hour resulted. Field staff tend to develop more projects than they close. 75 percent of centers have moved from subsidizing services to generating positive cash flow. |
| Yin, Merchlinsky, Adams-Kennedy (1998) | Survey and case studies, comparison group | 7 pilot centers (receiving $750,000 over 3 years to | Pilot and comparison centers did not differ markedly either in the nature of their partner |
| Author/Year | Method | Focus | Main Findings |
| establish a manufacturing SBDC) and 7 comparison centers with SBDC relationships but no special funding | relationships with SBDC or in the seamlessness of their service delivery. |
||
| Cosmos Corporation (1999) | Logic-based case studies | 7 case studies from 5 MEP centers | A transformed firm has made significant changes in four of five systems; many paths to transformation were observed. |
| Nexus Associates (1999) | Quasi-experimental comparison group study, fiscal impact analysis | SME client cohorts from 1988/1989-1998/1999, longitudinal research dataset | On an annualized basis, IRC clients increased labor productivity by 3.6-5.0 percentage points and output by 1.9-4.0 percentage points more than they would have done without assistance. Productivity gains resulted in an inflation-adjusted $1.9 billion increase in gross state product between 1988-1997. A benefit-cost analysis finds returns to state investment of 22:1. |
| Jarmin (1999) | Panel, longitudinal study | Longitudinal Research Database, Annual Survey of Manufacturers 1987-1993, MEP customer data from 9 centers | The timing of observed productivity improvements at client plants is consistent with a positive impact of manufacturing extension. |
| Author/Year | Method | Focus | Main Findings |
| OMB (2002) | Program assessment | National MEP program | with concerns raised that the program serves only 7 percent of manufacturers, that competition with the private sector exists, efforts to pursue self-sufficiency without federal funds have not be pursued. |
| NAPA (2003) | Panel review | National MEP program | SME barriers to productivity improvement persist and these firms are underserved by the market. |
| NAPA (2004) | Panel review | National MEP program | MEP has performed well but its basic service model, funding formula, and role of the national office need to evolve. |
| Davila (2004) | Chicago Manufacturing Center clients and Performance Benchmarking Service firms | Chicago area | Clients were more likely than non-clients to have adopted machinery and equipment but in the next year, this difference was insignificant. |
| Deloitte (2004) | Detailed review of NAICS growth, company credit scores, comparison group | SME clients of Industrial Resource Centers (IRCs) in Pennsylvania | IRCs are not creaming; mean credit rating of 2.92 for clients v. 2.81 for non-clients not significantly different in multinomial regressions. Impacts reported in the Nexus 1999 evaluation continue to hold true. |
| Author/Year | Method | Focus | Main Findings |
| Voytek, Lellock, and Schmit (2004) | MEP evaluation plan and metrics | National system | Center-level metrics can be used to diagnose performance. |
| Youtie (2005) | MEP system metrics | MEP centers in the ntional system | No consistent “top center” exists in terms of key Minimally Acceptable Impact Measures (MAIM) metrics. |
| Youtie et al. (2008) | Survey of clients and non-clients | Georgia MEP | Georgia Tech clients experienced a 12 percent increase in value-added per employee over non-clients. |
| SRI and Georgia Tech (2008) | Logic-based case studies | 8 case studies from 4 MEP centers | Companies in industries with job losses, private family-owned firms, concentrated structure for product development, history with technological implementation were more apt to experience benefits from E!WW. 3 of 8 case study firms gained tangible benefits and 4 of 8 took steps toward growth. |
| ASMC (2009) | Survey | Manufacturers in 18 states | One-quarter of manufacturers do not engage in world-class practices in six strategic areas. |
| SRI and Georgia Tech (2009) | Longitudinal study, comparison group | Ohio MEP served and unserved firms in Ohio unemployment security data | Comparing 443 MEP clients to 14,062 non-client manufacturers, the average manufacturing establishment shrank by 6.28 employees |
| Author/Year | Method | Focus | Main Findings |
| between 1998 and 2002. The average firm that received treatment during this period shrank by just 0.53 employees. This difference is statistically significant at the 0.1 level. |
|||
| Cheney et al., (2009) | Longitudinal study, comparison group | Census of Manufacturers, MEP customer data, all 59 centers | Manufacturing extension clients had growth in value-added per worker vs. non-clients ranging from - 5.8 percent to 1.7 percent for 713,330 observations depending on whether a difference in differences or lagged dependent variable model is estimated. |
| Schrank and Whitford (2009) | Review of SME policy | US policy | MEP promotes experimentation, diversity, and access to local knowledge. |
| Helper and Wial (2010) | Policy review | Great lakes region manufacturing | MEP serves individual manufacturers willing to pay for assistance rather than what may be needed to implement national policy goals. |
| Roper et al. (2010) | International survey models | Manufacturers in Georgia USA and three regions in Europe | University intervention is significant in Georgia product and process innovation but complementaries are not well captured. |
| Stone & Associates and CREC (2010) | Interviews, document review | National, MEP clients | MEP serves 10 percent of manufacturers, 2 percent with indepth assistance. |
| Author/Year | Method | Focus | Main Findings |
| MEP Advisory Board, Yakimov, Woolsey (2010) | Advisory board review | National MEP program | Streamline innovation and growth services, target green services, emphasize exporting, develop talent. |
| National Commission on Fiscal Responsibility and Reform (2010) | Budget analysis, working groups | National MEP program | MEP provides services that exist in the private sector and helps firms that should close. |
| Youtie et al. (2010) | Survey of clients and non-clients | Georgia MEP | Georgia Tech clients had $11,000 higher value-added per employee than non-clients. |
| Ezell and Atkinson (2011) | International comparison | MEP and similar programs in 10 other countries | Countries' manufacturing support programs have made a transition from continuous improvement to growth but the US program is under-funded. |
| GAO (2011) | Program assessment, surveys | National MEP program | Clients fees comprise more than half of non-federal funds for 26 centers; 80 percent of MEP very or somewhat likely to prioritize revenue generation projects with larger clients. |
| MEP (2011) | Client and fiscal impact | Nationwide, MEP customers | $1 of federal investment in MEP generates $32 of return in economic growth, $3.6 billion in new sales nationally. |
| Russell (2011) | Historical documents, | Little Rock, Arkansas | The center and its partners comply with |
| Author/Year | Method | Focus | Main Findings |
| interviews, survey | MEP’s implementation resource criteria and program goals. |
||
| Schact (2011) | Legislative history review | National MEP program | Issues around federal funding for the program and the match level of this funding remain. |
| Shapira et al (2011) | International comparison | 7 technology extension services in 6 countries | Countries' technology extension services reflect their distinctive national innovation systems. |


