
Development of MEP Center Metrics
The Manufacturing Extension Partnership (MEP) has for many years sought to use detailed metrics as a means both of measuring the performance of individual centers and as a means of establishing the value of the program overall.
This chapter reviews the systems and approaches used by MEP in developing and implementing metrics, covering both the system used in recent years (along with criticisms made of that system), as well as the new system of metrics currently being introduced.
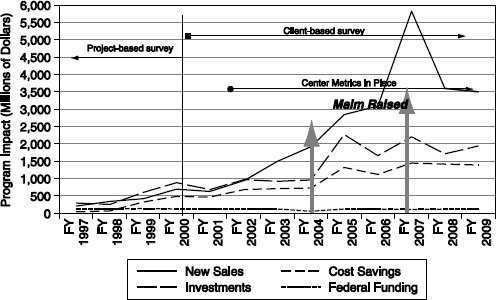
Figure 4-1 shows the evolution of MEP metrics. Formal metrics were developed in the mid-1990s, and were until 2000 focused on tracking individual projects. In 2000, the project-based approach was replaced by a focus on companies, taking the view that the company was the more relevant unit of analysis for impact assessment. The new approach was formalized by FY 2002. After that, adjustments were made as needed, for example, through an increase in the minimally acceptable score for individual centers in FY 2007. Starting in 2009, MEP undertook an effort to address some of the criticisms that were raised with existing metrics and their use for evaluation, notably that they rely on data from the client survey, which some critics held to be unreliable. These criticisms and the new metrics that followed are discussed in detail in subsequent sections.
Figure 4-1 charts the system of metrics against broad measures of program impact, discussed below.
MEP PERFORMANCE METRICS
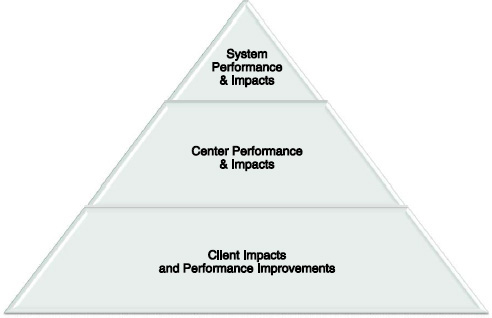
MEP’s performance metrics system addresses performance at three levels, shown in Figure 4-2.
The data underpinning these evaluations come from two primary sources: The first source is a survey of MEP clients implemented by a contracted survey organization, which generated dollar estimates of MEP project impacts. The second is detailed data about center operations that has been entered into MEP’s system database by staff at individual centers. This generated detailed information about center costs and activities (in effect, the input counterpart of the survey’s output metrics).
System-level Metrics
At the highest level, MEP aggregates data from all centers and clients to generate cost, services, and outcomes data for the MEP system as a whole. At this level, there are three key sets of metrics:
- Reach or penetration, which indicates the number of clients served and projects completed and undertaken.
- Bottom line impact, which is calculated using data from the MEP survey of center clients, including both cost savings and revenue growth.
- Job impacts, which indicates direct and indirect employment creation.
Reach
MEP overall reaches approximately 7,000-8,000 clients annually, in the course of approximately 12,000 projects. MEP data indicate that both metrics spiked substantially in FY 2007, reaching 9,000 and 14,500 respectively, and have since declined, in line with the recent dramatic shifts in the United States and world economy. Most recent data is for FY 2010, where MEP served just under 7,000 clients through about 10,000 projects (see Figure 4-3).
It is clear that successful centers do work hard to reach out into the community. Magnet Ohio, for example, ran 57 events attended by 1,601 people from 791 companies in FY 2011, which contributed to acquiring 99 client projects.1
Bottom-line Impact
MEP has traditionally measured the program’s bottom-line impact by aggregating data on client cost savings and new sales, drawn from the client survey. This is the source of MEP's claims about overall program effectiveness,
________________
1James Griffith, “The MAGNET Story: From Lean Manufacturing to Partnerships for Innovation,” National Academies Workshop on “Diversity and Achievements: The Role of the Manufacturing Extension Partnership in the Midwest,” March 26, 2012.
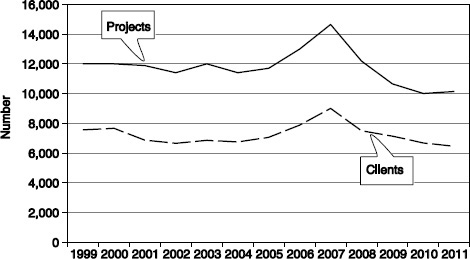
FIGURE 4-3 MEP projects and clients, 1999-2010.
SOURCE: NIST MEP Program.
for example, that its efforts led directly to $9 billion in new and retained sales for its customers in FY 2008.2
Jobs
MEP also utilizes aggregate metrics focused on jobs. The most recent MEP performance report leads off its summary data section by indicating that according to the MEP client survey, MEP clients in aggregate claim to have generated or saved more than 53,000 jobs in FY 2010.3
CLIENT-LEVEL METRICS AND PERFORMANCE ASSESSMENT
Client-level metrics are (except for success stories) based on a survey of MEP participants undertaken by an external marketing and survey research firm. Client surveys have been sponsored by the National Institute of Standards and Technology (NIST) MEP since 1996. The following section provides an overview of the FY 2009 survey and reports, which was undertaken by Turner Marketing Inc.
The survey was deployed to about 8,900 MEP participants, and generated an overall response rate of 85.7 percent—a remarkably high percentage. This high rate partly reflects the pressure on MEP centers to ensure that their clients complete the survey, as until recently a very substantial component on the center’s overall assessment was pinned to the survey and included scoring based on survey response rates.
________________
2NIST MEP, “Delivering Measurable Results,” January 2010, p. 2.
3NIST 2010, p. 2.
The survey is deployed two quarters after completion of the MEP engagement, and does not track outcomes longitudinally. Firms with multiple MEP engagements were more likely to respond.4
About 40 percent of projects reported that they worked with other service providers, but a majority used only MEP.
Firms identified three top challenges:
- Ongoing continuous improvement (72 percent).
- Identifying growth opportunities (59 percent).
- Product innovation and development (45 percent).
MEP outcomes analysis tends to emphasize aggregate sales impacts (these numbers are found in many MEP documents). The survey sought to identify “increased” and “retained” sales that resulted directly from MEP engagement. The survey identified a total of $3.3 billion in increased sales and $5.5 billion in retained sales, as shown in Figure 4-4.
The report for FY 2009 indicated that about 29 percent of projects reported increased sales and 38 percent reported retained sales. These published data are, however, insufficient to provide a more robust analysis (leaving aside the question of control groups). Key questions might include:
- How many firms reported both increased and retained sales? I.e., what was the total universe of firms reporting some positive impact?
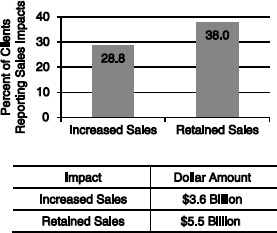
FIGURE 4-4 New and retained sales from MEP projects.
SOURCE: FY 2009 MEP client survey. Data provided by MEP.
NOTE: Sales impacts reported by MEP clients (n=7,648 clients).
________________
4The survey methodology is described in NIST 2010, p. 3.
- What was the distribution of impacts by size of impact? These data are likely to be highly skewed.
- What was the distribution of both overall impacts and the distribution of impacts by geography?
- Are there breakouts by demographics? By women- and minority-owned firms, for example.
The report’s review of employment impacts indicates that 24 percent of projects resulted in new jobs (total 14,000) and 40 percent resulted in retained jobs (total 39,000). Further breakouts are apparently available in other unpublished reports. The published report does not make the connection to the cost of these jobs—at MEP’s current budget, preliminary calculations suggest that these 53,000 jobs cost a total of about $100 million in federal funds or just under $2,000 each. MEP might consider comparing the cost per job here against that from other federal or state programs with job-related impacts.
Cost savings are a very important part of the MEP mission, and reflect the priority focus of many participant firms on lean manufacturing and continuous improvement. As with other metrics, the report provides no further breakouts. Cost savings include both direct cost savings reported by 59 percent of respondents.
The report also covered investment resulting from MEP activities. Respondents reported investments in four categories, although in none did more than half of respondents report investments, which overall totaled approximately $1.75 billion (Appendix B, Table 8):
- Plant and equipment (35 percent).
- IT/software (23 percent).
- Workforce development (50 percent).
- Other (17 percent).
While encouraging, a closer examination of these numbers can provide a more nuanced understanding of how MEP has helped firms make these investments and whether the investments were successful.
Finally, the survey sought to identify “promoters” and “detractors” of the MEP program, a metric used to measure customer satisfaction. Respondents are asked whether they are likely to recommend MEP center services to other local companies. The survey found that about two-thirds of respondents are “promoters” and only 10 percent are “detractors.” However, the published material does not link these results to other outcomes or program demographics.
As Luria has noted, centers are accustomed to the survey; however, the survey has a number of flaws, notably that a large number of clients cannot monetize the effects of program assistance, outliers play a significant role, and
the existence of attribution is of concern.5 There are also concerns about incentives within the scoring system for centers to ensure that the most positive possible answers are provided by surveyed clients.
MEP has sought to respond to some of these issues, for example, by applying value-added adjustments to sales results from the MEP survey in its bottom-line client impact MAIM metric.6
CENTER LEVEL METRICS: THE MAIM APPROACH7
MEP has since the early 2000s evaluated center performance against what it has called Minimally Acceptable Impact Measure (MAIM), which MEP aimed to review and adjust over time as center performance improved. It has apparently been adjusted once, in 2007. MAIM is a bar against which to measure center performance which is either minimally acceptable or not.
Each center is reviewed quarterly using four-quarter rolling averages, then again annually and biennially, using a weighted scoring system:
- Cost per impacted client (30 points). The federal investment in a center divided by the total number of clients responding to the survey.
- Bottom-line client impact ratio (30 points). This is the sum of cost savings reported by all center clients plus 15 percent of total sales impact (new sales and retained sales) reported by center clients, divided by the federal investment in the center.8
- Investment leverage ratio (20 points). This is the sum of new investment reported by all center clients divided by the federal investment in a center.
- Percent quantified impacts (10 points). This is the number of center clients responding with some positive quantified impact to the client survey, divided by the number of center clients selected to be surveyed.
- Clients served per million federal dollars (10 points).
Items 1 and 5 above are measures of relative input cost, items 2 and 3 are outcome metrics. Item 4 can be viewed as either or both. All items except 5 rely on data from the client survey.9
In order to generate these benchmark metrics, MEP collects data from two sources: the centers themselves, via electronic submission of numerous data about their activities; and the client survey which is focused on client outcomes.
________________
5See Luria, 2011.
6Voytek et al., 2004.
7Center performance metrics are currently under review at MEP.
8Based on an MEP analysis of data from the 1998 Annual Survey of Manufacturers published by the U.S. Census Bureau.
9See Appendix A for a list of data fields provided by MEP.
1. Center data. There are three primary input metrics:
- Federal funding. Amount of federal funding provided through MEP
- Other funding. Amount of other funding from state and industry sources as well as user fees
- Staffing patterns. Centers report on the numbers of staff provided through the program. Data cover total full-time equivalent staff, as well as breakouts for technical specialists, sales start, and management and support staff, the number of hours worked, use of third-party service providers, etc.
2. Center cost and utilization metrics. MEP calculates a number of cost metrics for each center. These include federal cost per project hour, federal funds as percentage of total expenditures, federal funding per full-time equivalent position, and total expenditure per client.
3. Output metrics include:
- Center report on total number of clients. This measure is all clients that the center claims to have touched in some way and is much larger than the number with whom centers have contracts. No further detailed information is available from MEP about these clients.
- Center report on impacted clients. These are clients with whom the center has had substantial interaction based on MEP funding, and on which it has expended actual resources. These clients are all included in the client survey.
- Bottom-line impact drawn from the client survey, defined as the sum of the company’s direct cost savings plus 15 percent of its additional sales. This is an effort to measure the direct impact of the MEP engagement on the firm’s bottom line. Fifteen percent of sales are used as part of the metric because the average margin for small manufacturing companies is, according to MEP, 15 percent. Cost savings are seen as falling directly on to the bottom line.
- Bottom-line impact ratio. This measure divides bottom-line impacts by federal expenditures.
- Investment leverage ratio. This aggregates additional investments reported through the client survey for the center, divided by the center’s federal funding.
- Job impacts reported via the client survey. The MEP survey asks respondents to indicate how many jobs were created or retained as a result of the MEP project.
Using the metrics as defined by MEP, it is possible to track median center performance over time.
Figure 4-5 shows median performance for 2001, 2004, 2008, and 2010.
Minimally Acceptable Impact Measure (MAIM)
Each of the five components of MAIM has its own minimally acceptable level of performance and weighted score (see Table 4-1). The five scores are weighted to reflect the relative importance of each.
Individual scores are aggregated across the measures to generate a MAIM score for each center.
A rolling four-quarter average of MAIM scores is used for measuring Center performance. If a Center meets or exceeds the minimally acceptable level of performance for a particular measure, they receive all the points assigned to that measure. If they do not meet or exceed the minimum performance level for a particular measure, they do not receive any of the points assigned to that measure.
Aggregate scores can range from a minimum of 0 (failing to meet the minimum threshold for any of the five indicators) to 100 (meeting or exceeding the minimum threshold for all five
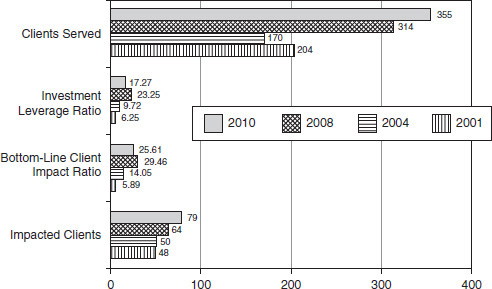
FIGURE 4-5 Median Center performance over time.
SOURCE: MEP.
TABLE 4-1 MAIM Minimum Levels and Weights
| Performance Metric | Cost Per Impacted Client | Bottom-line Client Impact Ratio | Investment Leverage Ratio | Survey Response Rate | Percent Quantified Impact |
| Minimally Acceptable Level | $31,000.00 | 3.00 | 3.00 | 70.00% | 32.00% |
| Weighted Score | 30 | 30 | 20 | 10 | 10 |
SOURCE: Thomas, op. cit.
indicators). A Center with an aggregate score of 70 or more is considered to satisfy the MAIM requirements.10
Meeting the MAIM score benchmarks has been a real and not a formal requirement. For example, in 2008 and 2010 the Nebraska MEP struggled to meet those benchmarks, and was provided with a series of recommendations by the MEP Advisory Board. In its 2010 annual report, the Nebraska center explicitly addressed each recommendation and showed how it had or was attempting to meet them.11 Once the Nebraska MEP got into trouble, it reached out not only to MEP headquarters staff but to other centers (such as Ohio and Arkansas) for help.12
Perhaps most interestingly, it appears that the single most important factor in helping MEP of Nebraska increase scores to meet MAIM benchmarks was improved reporting via the MEP survey, rather than an actual improvement in service.13
MAIM’s Weaknesses
MEP itself has recognized that the existing MAIM approach has a number of significant weaknesses:
- It is heavily reliant on data from the client survey.
- Centers and their staff are rewarded based on high levels of positive responses, which may lead some to coach clients on their responses.
- The focus on minimally acceptable standards has numerous problems:
________________
10NIST, “Report on NIST/MEP’s Center’s Performance Reporting,” January 2007.
11MEP of Nebraska, “2010 Center Progress Report,” May 26, 2011, section 1-12.
12MEP of Nebraska, op. cit., pp. 1-12.
13Ibid.
![]() It provides no guidance once centers meet the minimum.
It provides no guidance once centers meet the minimum.
![]() It is binary (pass-fail) when center performance is not.
It is binary (pass-fail) when center performance is not.
![]() It relies on data that is strongly tilted toward lean manufacturing as the core suite of services.
It relies on data that is strongly tilted toward lean manufacturing as the core suite of services.
![]() It provides no detailed information for centers about their relative strengths and weaknesses.
It provides no detailed information for centers about their relative strengths and weaknesses.
- It does not address the critical balancing act maintained by centers as they struggle to manage the imperatives of generating maximum client impact, while expanding market penetration, within the broad context of retaining financial stability (currently at a time of declining state contributions).
- It is not well designed to help assess center activities related to the MEP’s new innovation-focused strategy.14
In light of MAIM’s weaknesses, which MEP acknowledges, MEP is now shifting toward a new set of metrics which it calls its CORE standards.
CORE METRICS: A BALANCED SCORECARD APPROACH15
The new CORE approach is different from MAIM in a number of important respects. CORE has four elements:
- New center diagnostics.
- Revised impact metrics.
- Opportunities and challenges.
- Panel review.
These are combined to provide a much broader perspective, and MEP anticipates a more balanced view of center activities.
Figure 4-6 illustrates how the different components of the CORE metrics are designed to fit together. The assessment process will utilize data from the client survey and centers along with qualitative evaluations from new sources.
New Impact Metrics16
Impacts are calculated by aggregating all impacts reported by center clients, using a four-quarter rolling average. Metrics are designed to control for
________________
14See Chapter 6 of this report for a review of this new strategy.
15Unless otherwise noted, this section is based on a detailed briefing on CORE provided by MEP on July 23, 2012. All graphics unless otherwise noted are from this briefing.
16Material in this section draws on MEP’s Scoring Methodology document, privately provided by NIST MEP.
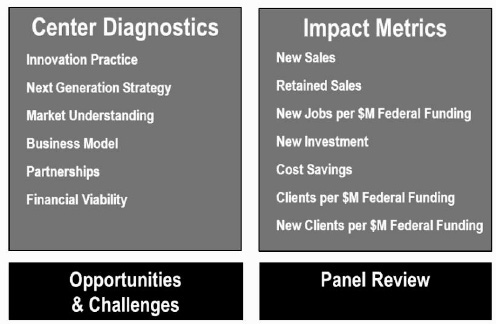
FIGURE 4-6 CORE Metrics: a balanced scorecard approach.
SOURCE: MEP.
the size of the center, using the amount of federal funding to do so.
For each metric, data collected by the center is normalized by using the amount of federal funding received, and is then compared to a threshold level established for each metric by NIST MEP. Centers scoring at more than 100 percent of the threshold are graded excellent and receive the maximum score. Centers can gain additional points by scoring at a multiple of the established threshold, up to a maximum of four multiples of the existing threshold, which would generate four additional points on the score for that metric. NIST’s methodology document does not explain how threshold ratios for individual metrics are derived.
Scores for each metric are aggregated to arrive at the overall impact score for each center. The aggregate impact score accounts for 50 percent of the overall score for each center; the remainder comes from the center diagnostics (discussed below).
The individual metrics described here capture direct effects; the indirect social welfare costs and benefits are not captured.17
1. New sales.
The new sales metric focuses squarely on growth-oriented company outcomes. It is calculated by aggregating the total amount of new sales that
________________
17The benefits to social welfare could include, for example, increases in profits. However, data capturing this information is not available, as small private firms are reluctant to provide data on earnings.
clients report related to MEP-funded projects, divided by total federal (MEP) funding.
2. Retained sales.
Aggregated data from clients is divided by federal funding to generate a ratio. The retained sales ratio is then compared to a threshold established by NIST MEP. Centers scoring at more than 100 percent of the threshold are graded excellent.
3. New jobs.
The primary metric is new jobs per $1 million of federal funding. Total new jobs reported are divided by federal funding expressed in millions of dollars.
4. New investment.
New investment is calculated by aggregating all related new investments reported by clients for a center.
5. Cost savings.
MEP centers are still expected to maintain a substantial focus on lean manufacturing, where impacts are best captured through cost reduction. Here the aggregated amount of cost savings is divided by federal funding.
6. Manufacturing clients.
For this metric, the total number of manufacturing clients is divided by federal funding expressed in millions of dollars. This metric aims to capture at least in part market penetration. It should be noted that the amount of federal funding is not closely tied to the number of manufacturing companies in an MEP center’s population.
7. New manufacturing clients.
For this metric, the total number of new (i.e., nonrepeat) manufacturing clients for a center is divided by federal funding expressed in millions of dollars.
A number of observations can be made about the new impact metrics.
First, they are heavily weighted toward top-line growth rather than the existing lean consulting base of the centers. Four of the seven metrics are explicitly focused on “new” sales, jobs, and clients.
Second, the impact metrics continue to be based entirely on impact data drawn from the client survey. There are, as we have seen elsewhere, some significant issues with the survey, and these issues may be exacerbated by the likelihood that innovation-oriented projects may take much longer than cost-cutting projects to generate positive impacts.
Third, it is encouraging to note that NIST MEP is moving away from simple pass-fail metrics even in the impact assessment; the notion of adding points for multiples achievement recognizes enhanced performance without strictly grading on a curve.
Center Diagnostics
The center diagnostics component of the balanced scorecard offers a dramatic contrast with MAIM. All of the metrics involved are assessed using data and information other than the client survey; and in many cases these involve qualitative assessments of center progress and activities, rather than quantitative metrics.
- Many of the center diagnostic components are based on qualitative assessment, not quantitative data. In some cases, it would appear that the criteria could be highly subjective; for example, item NGS d) requires that “Centers work with a sense of urgency that transitions reactive clients to proactive.”
- Those that do have a quantitative component—e.g., the level of state funding—are based on data beyond the traditional sources used for evaluation.
- Assessment is comparative. While MEP is not directly grading centers on a curve, it is grading them against benchmarks that are presumably derived from center performance.
The new metrics are best understood as capturing six broad areas of Center activity—Innovation Practice, Next Generation Strategy, Market Understanding, Business Model, Partnerships, and Financial Viability—each of which has several subcomponents. Assessment is not simply focused on a limited number of outcomes; it also covers design and implementation of the center’s strategy as well as its implementation of Next Generation Strategy services.
Combined CORE Assessment—Impacts and Center Diagnostics
The interplay of these variables is captured in the summary scorecard developed by MEP that includes both impact metrics—which remain largely unchanged from the MAIM system that CORE replaces—and the center diagnostics, which are new. Both the impact metrics and the center diagnostics are tracked quarterly by MEP for each center, and are measured against the performance of the median center, as show in Figure 4-7.
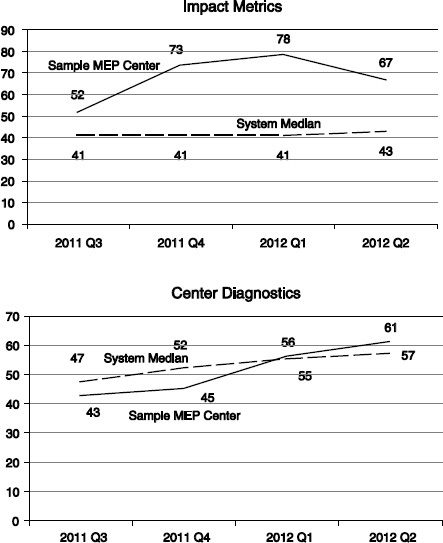
FIGURE 4-7 Center performance over time.
SOURCE: NIST MEP, private communication.
CORE Metrics—Conclusions
These changes do reflect an effort to address previously identified weaknesses in the MAIM approach. However, the CORE metrics bring some questions and concerns of their own.
- NIST MEP is using CORE metrics to drive the transition from the traditional lean-oriented consulting practice to an innovation and growth practice at every center; for example, the first metric listed requires a “transition from a focus on process improvement to the
-
development and implementation of an innovation practice.” The stress is heavily on organizational transformation, rather than the extension of new services.
- NIST MEP is clearly seeking to drive the new strategy through the rapid adoption of the specific innovation- and growth-oriented tools developed by NIST MEP. A number of the metrics make this abundantly clear. As noted elsewhere in this report, many of these tools are still at the experimental or at least unproven stage, making adoption potentially risky for organizations with scarce resources such as MEP centers.
- NIST MEP is seeking to drive centers to adopt all components of the new strategy—a one-size-fits-all approach which ignores the likelihood that centers will need to match different offerings to their differing client populations.
Despite some concerns about the new assessment approach, it should be noted that feedback from center interviews has generally been positive. As one center director observed, “If we are doing things right on the ground, we are confident that this will be reflected in the metrics.”
However, it should be noted that if at some future point NIST MEP is able to allocate additional funding to individual centers, or to reallocate existing funding between centers, the qualitative aspects of the balanced scorecard approach will require further bolstering: The transparency and independence of the metrics will undoubtedly attract close scrutiny.


