
MEP Center Performance Measures and Evaluations of Program Outcomes
As detailed in Chapter 4, NIST-MEP collects a range of metrics on the performance and initial impacts of centers within the MEP system. These metrics provide information that can be used for the monitoring and reporting of MEP center performance, including by activities, staffing, funding, clients served, and intensity and type of service. Additionally, there have been numerous efforts to evaluate the MEP over its more than two-decade history. Many of these studies are sponsored by the program itself, or by state economic development agencies or federal oversight bodies. The evaluations themselves have usually been carried out by various third-party private consultants, university researchers, policy foundations, or government examiners. This chapter begins by considering the broader challenges involved in measuring MEP center performance and evaluating program outcomes and by discussing how the committee addressed these challenges. This is followed by a section that draws on NIST’s MEP metrics to gauge center performance and discusses the value and limitations of these observations. The final section of the chapter reviews external evaluations of the MEP and summarizes their main findings and implications.
CHALLENGES OF MEASURING MEP PERFORMANCE AND IMPACTS
It is never straightforward to measure the performance and impact of individual program interventions in a dynamic system with multiple internal and external factors influencing firm performance and economic change. The MEP is not an exception here. There are a number of challenges in measuring and interpreting program and impact data and in undertaking evaluations. Given these challenges, listed below, the committee has been careful in interpreting the outcomes of the MEP program.
Multiple Stakeholders
The MEP involves a mix of federal, state, organizational, and private actors, who have varying goals and interests. Thus, while at the federal level, NIST seeks national impacts from the MEP on the competitiveness and capabilities of SMEs across the country, including improvements in productivity, innovativeness, and exporting, states are naturally most interested in effects within their own jurisdiction. States are especially interested in ensuring that their firms are served and in job retention and creation. Individual firms are typically interested in gains they can capture, including added sales and improved profitability, while industry organizations seek improvements in performance across sectors and supply chains.
Reliance on Self-Reported Data
NIST’s own metrics of center impacts on firms seek to incorporate many of these goals, including efficiency improvements, added sales, and jobs retained or created. While NIST does sponsor studies with a range of methods, the major ongoing way through which NIST collects this data is via the MEP survey tool (discussed in Chapter 4). The data collected are undoubtedly valuable, but they must also be regarded with caution. A number of center directors have observed that the very high level of survey responses that MEP headquarters considers to be acceptable has the effect of ensuring that local MEP centers expend considerable efforts and resources on ensuring that clients comply and complete the survey. Current average response is 85 percent, and the amount of effort expended by centers to ensure compliance is reported to range from 5 percent to 35 percent of total staff time.1
Incentives and Performance Indicators
In addition, several center directors have noted that the reliance on survey data as a primary metric of center performance introduces related incentives for centers (whose performance evaluations largely rest on survey data) and individual staff (whose compensation in at least some cases depends on both the level of client compliance with the survey and the degree of positive outcomes recorded). Staff thus have incentives to encourage clients to respond and to present the maximum possible outcome. This is therefore somewhat different than relying on self-reported data from a nonincentivized population.
Survey Complexity
If clients must undertake fairly complex calculations in order to complete the survey—which they do—and if there is minimal guidance within
________________
1Information provided by center directors in response to NRC request, June 2012.
the survey itself on the correct methodology for completing these calculations— which appears to be the case—then the data collected could be flawed: that even where firms are seeking to provide a completely honest and unprompted response, identical outcomes at different firms may result in different responses to the survey.
Identifying the Relevant Controls
The NIST survey data is collected from firms that participate in the program, and not from those who do not. Comparison group studies have been undertaken, sponsored by NIST and by other organizations, with the aim of discerning any additional effects associated with MEP program participation compared with nonparticipation. As with other government support programs for business, care must be taken in identifying relevant control groups to ensure that comparisons made are appropriate. The fact that a company is willing to engage with an MEP center and to seek improvements in its processes may in itself be a distinguishing characteristic, which separates such firms from essentially identical firms that are not prepared to take this step. A few controlled studies have sought to address this concern by matching comparison groups and adjusting for performance prior to program entry. However, this is a complex procedure, and many of the available studies of the MEP do not attempt to use formal control groups. This is a known limitation. However, some of the available studies do seek control through the application of counterfactual methods and logic models, while in other cases the intent of the study has been to probe other aspects of the MEP using qualitative approaches and simulation techniques.
These methodological issues provide the backdrop against which the various assessments made to date can be addressed, as described in Box 5-1.
CENTER-LEVEL REVIEW OF PERFORMANCE AND OUTCOMES
In this section, we examine NIST’s own data on MEP performance and outcomes. MEP is currently in the midst of a major transition from traditional metrics which drew on the client survey for 85 percent of outcomes to a new approach that relies on a balanced scorecard approach in an effort to better capture, in particular, the services included in the MEP new innovation-focused strategy.2 As these new metrics were not available to the committee when it undertook its review, we rely on the previous metrics to review center activities.
________________
2See Chapter 6 for a discussion of MEP’s innovation-focused Next Generation Strategy (NGS).
Box 5-1
Data Limitations and the Use of Multiple Data Sources
NIST has made a substantial effort to acquire data with regard to both the operation and the performance of the program. Most federal research and development programs have not collected similar levels of data. Engaging an outside contractor to collect data in a systematic manner through survey deployment is commendable. Nonetheless the committee believes that the data collection methodology could be substantially improved and suggestions to this effect are contained in the Findings and Recommendations.
Despite these reservations, some of the data collected are of high quality. The data on program inputs, collected from the centers, appears to be accurate, and is collected into a database through a well-designed standard process. With regard to outcomes data collected by NIST, it provides valuable information, although we identify challenges that can and should be addressed. There are significant difficulties in encouraging client companies to report on their outcomes at some time after the event. As noted, the use of an independent third-party survey company to collect data is a positive practice; however, the committee has reservations about the impact of the push by NIST MEP for high levels of survey compliance, and also about the role of center staff in encouraging that compliance. These reservations limit, to some extent, uses to which these data can be put, and these limitations are identified. At the same time, there are methodologically sound ways in which these data limitations can be taken into account.a
In the context of this study, multiple steps were taken to address challenges in data collection and evaluation:
Balancing through multiple sources of information: To balance potential limitations in the NIST data, the committee drew on a wide range of information sources when conducting the study. Data from MEP recipients is used only as one source of information and it is not the sole source for any recommendation. Importantly, the committee made sustained efforts to develop its own information base, and to draw on other sources of information. This included:
a. Carrying out multiple site visits and interviews with MEP center directors and staff
b. Commissioning a comprehensive review of previous MEP evaluations in the professional literature
c. Developing an information request to all center directors that generated responses from more than 40 centers
d. Convening five NRC workshops—two in Washington and three held regionally
e. Conducting multiple interviews with NIST MEP staff
f. Drawing on input data from the MEP awards database
g. Considering examples from programs outside the United States
h. Conducting interviews with academics and other experts
i. Analyzing internal NIST documents and presentations, as well as and previous external reports, including those from the Government Accountability Office (GAO), and the National Research Council (NRC).
The committee’s findings and recommendations therefore reflect the sum total of the knowledge gleaned by the committee, which itself reflects significant program-related expertise.
aSee, for example, Todd D. Jinck, “Mixing Qualitative and Quantitative Methods: Triangulation in Action,” Administrative Science Quarterly, Vol. 24 No. 4, Dec. 1979.
As described in Chapter 4, MEP maintains a number of standard metrics related to center performance. These focus primarily on three core aspects of center activity:
- Penetration or scope. Centers are required to serve the local manufacturing community, and penetration metrics are used to measure how well they reach out to their potential client base. This is usually normalized for various possible independent factors, such as the size of the small and medium business population (we use the European term SME [small- and medium-sized enterprises] to describe potential MEP clients, although in some cases MEP works with larger companies).
- Effectiveness. The relative effectiveness of centers, again normalized for various possible independent factors, is critically important to the program as a whole. MEP gathers extensive data on the outcomes of projects, used here to construct appropriate outcome-efficacy metrics.
- Efficiency. The substantial differences in the cost per client and per project among the centers suggest variation in the effectiveness of centers, with implications for improving transmission of best practices between centers.
Numerous intervening variables can be used to help explain variation in the performance of centers against these metrics. However, it does not appear that MEP has focused on this question. Such factors metrics might include demographics of the client population, including size of company, skills levels within client companies and in the local population, degree of existing integration into global supply chains, role of local universities and colleges, nature of existing industry clusters, current average value added per employee, and transportation links and ease of center access to clients.
Given the limited nature of this review, we have focused on one factor that is at least potentially under the control of MEP—the size of the center and
its potential client population. Some centers are simply much larger on every dimension than others, and it seems reasonable to suggest at a minimum that the largest centers—which account for a proportionately large percentage of MEP funding—should be of particular interest in addressing MEP impacts.
CENTERS IN CONTEXT: REVIEW OF SIZE DIFFERENCES
Centers differ on many dimensions, including the composition of the local manufacturing sector by industry, the existence or otherwise of major research universities, company demographics, and startup rates. One of the more influential variables is the size of the center. Size can be measured in several ways: by the size of the service area, by the number of clients, by institution revenues, and in revenues or funding per SME in the service area. In this section we review data related to the size of the MEP center, the gross number of clients, and revenues and funding per SMEs in the area.
Population Size of Service Area
MEP centers vary enormously in the size of the SME population that they serve. Based on MEP estimates, the range is from more than 31,000 companies in Southern California to approximately 500 in Alaska. The median number of manufacturing SMEs per service area was 3,353.3
Gross Number of Clients
Unsurprisingly, the number of potential clients contacted and indeed the number of clients served is correlated positively with the size of the service area: Overall, centers in the top quintile for size of service area were almost all also in the top quintile for clients contacted and clients served, as shown in Table 5-1.
Centers in Kansas and South Carolina appear to be attracting more clients than would be the median. Puerto Rico claims to touch a much higher percentage of potential clients than the median, but converts few into actual clients.
Gross Size of Funding
Overall, median federal funding in FY 2010-2011 was $3.1 million. Average funding was $4.9 million. In terms of funding, there are four large MEP centers (see Table 5-2). Even the smallest of these—Texas—is almost twice as big as the next largest center.
Thus in terms of size, the four biggest centers are to some degree outliers.
________________
3MEP center database, FY 2010.
TABLE 5-1 SME Populations and Clients by Center (Top Quintile by Number of SMEs Contacted)
| State | Center Name | SMEs Contacted | Impacted Clients |
| CA | California Manufacturing Technology Consulting | 3,563 | 571 |
| OH | Ohio Manufacturing Extension Partnership | 3,273 | 434 |
| NY | New York Manufacturing Extension Partnership | 1,817 | 404 |
| FL | Florida Manufacturing Extension Partnership | 1,633 | 212 |
| TX | Texas Manufacturing Assistance Center | 1,422 | 282 |
| MI | Michigan Manufacturing Technology Center | 1,043 | 225 |
| MA | Massachusetts Manufacturing Extension Partnership | 1,005 | 155 |
| KS | Mid-America Manufacturing Technology Center | 992 | 85 |
| WI | Wisconsin Manufacturing Extension Partnership | 928 | 170 |
| NH | New Hampshire Manufacturing Extension Partnership | 867 | 41 |
| SC | South Carolina Manufacturing Extension Partnership | 854 | 158 |
| GA | Georgia Manufacturing Extension Partnership | 852 | 152 |
The rankings for the gross numbers above change substantially when adjusted for size of service area (see Table 5-3). Of the four highest-funded centers identified, none appears in the top ten centers for funding per SME, suggesting there are some economies of scale in servicing firms.
Conversely, many of the remainder are clustered at a much smaller scale, as shown in Figure 5-1.
There is a limited but distinct negative correlation between the amount of funding per SME and the total number of SMEs in the service area. Of the 14 centers funded at $1,500 per SME or above, all have fewer than 5,000 SMEs in their area, as shown in Figure 5-2.
Figure 5-2 indicates that median spending per SME is under $1,000, and the median number of SMEs in the service area is just under 4,000. While there are outliers on both dimensions, with a maximum of just under $4,000 per
TABLE 5-2 Largest Centers by Funding Volume, FY 2010
| California Manufacturing Technology Consulting (CMTC) | CA | $28.8M |
| Ohio MEP | OH | $22.4M |
| New York MEP | NY | $21.2M |
| Texas Manufacturing Assistance Center (TMAC) | TX | $16.8M |
| SOURCE: Data prepared for GAO by MEP, private communication. | ||
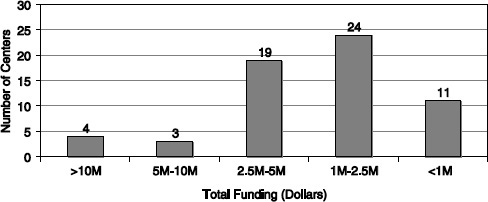
FIGURE 5-1 Number of centers, by funding level, FY 2010.
SOURCE:: MEP data, FY 2010.
SME, and a maximum of about 31,000 SMEs in the service area, no large SMEs spend much above 150 percent of the median. Conversely, 12 centers with smaller than the median number of firms in their area spend more than 150 percent of the median.
It may also be worth noting that eight centers spend less than $500 per firm, but all serve more than the median SME population. This suggests that there may be economies of scale. However, while smaller centers utilize more funding per SME, the four biggest centers still account for about 30 percent of total MEP expenditures.
TABLE 5-3 Highest Funding per SME, FY 2010
| Recipient Name | State | Total Income (Dollars) | #SMEs in Service Area | Dollars per Service SME |
| Alaska MEP | AK | 1,960,534 | 501 | 3,913 |
| North Dakota Manufacturing Extension Partnership | ND | 2,370,782 | 752 | 3,153 |
| MEP Utah | UT | 9,143,913 | 3,312 | 2,761 |
| Northwest Pennsylvania Industrial Resource Center (NWPIRC) | PA | 3,590,377 | 1,633 | 2,199 |
| IMC-PA | PA | 2,095,214 | 996 | 2,104 |
| Manufacturing Works | WY | 1,193,002 | 568 | 2,100 |
| MRC | PA | 3,206,326 | 1,537 | 2,086 |
| New Mexico MEP | NM | 3,110,313 | 1,535 | 2,026 |
| Mid-America Manufacturing Technical Center (MAMTC) | KS | 5,476,200 | 3,143 | 1,742 |
SOURCE: MEP data, FY 2010.
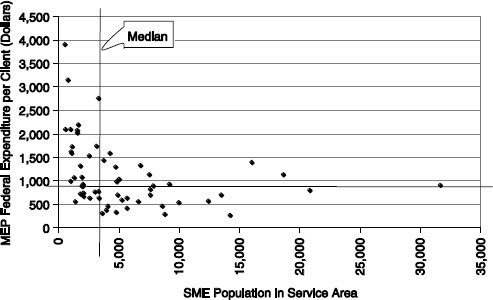
FIGURE 5-2 Centers by federal MEP funding per client served and size of SME population in service area, FY 2010.
SOURCE: MEP dat,a FY 2010.
EFFECTIVENESS
MEP makes a considerable effort to identify and capture outcomes data. Here the key metric is the bottom-line impact, calculated as the sum of cost savings plus 15 percent of additional or retained sales resulting from an MEP engagement. This metric generates widely different outcomes for the centers: Impacts per client range from $3.6 million in Mississippi, to just over $100,000 in northwest Pennsylvania.
Overall, 3 centers claimed bottom-line impacts of over $1 million per client, while 14 claimed less than $250,000 (see Figure 5-3). The large variation in outcomes suggests that determination of why this might be—and how low-impact centers might improve their results—would be a top priority of MEP management.
The three centers with more than $1milion in claimed impacts per client were:
| Mississippi Technology Alliance | $3,628,316 |
| GENEDGE ALLIANCE | $1,777,412 |
| Arkansas Manufacturing Solutions | $1,752,289 |
The next highest claimed just over $900,000.
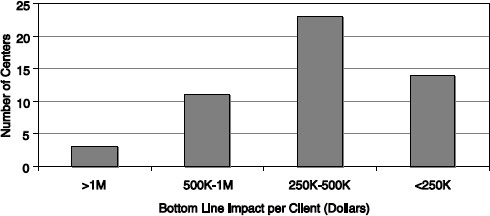
FIGURE 5-3 Centers’ bottom line impacts per client, FY 2010 Dollars.
SOURCE:: MEP data.
Given the need to impact the overall SME population, not just clients, we also consider the bottom-line impact per SME in the center service area. While there is overlap between rankings, the correspondence is far from conclusive. There are a number of centers in the top quintile for impacts per client who score much lower when considering their impact on the overall SME population; and conversely, some that score low on client impacts score high in the context of the overall SME population, as shown in Table 5-4.
This review shows that while Alaska scores only moderately in terms of bottom-line impact per client, normalizing by the number of SMEs indicates that Alaska had a relatively high impact on the overall SME population. Similarly, while MANEX in Northern California generated more than $200,000 per project in bottom-line impacts, the impact of these projects on the overall SME population was low because MANEX has a low client take-up rate.
However, there are large disparities in impacts per client served and in impacts per SME between the highest-scoring and lowest-scoring centers. Mean impacts per area SME for the top quintile are a multiple of about 4 compared with impacts from the lowest quintile. This is a substantial difference in outcomes.
Jobs Impact
MEP also measures program outcomes through jobs—which includes both new hires and jobs retained. MEP does not appear to address jobs lost as a result of the program.
MEP data again show large differences between the best and worst performing centers. Ohio claims more than twice the per-client job impact of any other center, while there are 14 centers claiming fewer than 3 jobs per client—less than one-thirtieth the claims made by Ohio, as illustrated in Table 5-5.
TABLE 5-4 Bottom-line Impacts—Top and Bottom Quintiles, FY 2010
| State | Center Name | Dollars per Impacted Client | Impact per SME in Area (Dollars) |
| MS AR |
Mississippi Technology Alliance Arkansas Manufacturing Solutions |
3,628,316 1,752,289 |
83,687 48,367 |
| PA | Northeastern Pennsylvania Industrial Resource Center | 406,158 | 42,016 |
| VA | GENEDGE ALLIANCE | 1,777,412 | 35,122 |
| MT | Montana Manufacturing Extension Center | 903,744 | 30,588 |
| AK | Alaska Manufacturing Extension Partnership | 258,127 | 22,155 |
| UT | Utah Manufacturing Extension Partnership | 787,255 | 20,680 |
| PA | Catalyst Connection | 449,238 | 19,026 |
| ME | Maine Manufacturing Extension Partnership | 501,969 | 17,309 |
| PA | IMC-PA | 227,337 | 15,977 |
| PA | MANTEC | 350,835 | 15,460 |
| IA | Iowa Center for Industrial Research and Service | 357,066 | 14,598 |
| CA | California Manufacturing Technology Consulting | 236,000 | 4,265 |
| DE | Delaware Valley Industrial Resource Center | 153,771 | 4,207 |
| MI | Michigan Manufacturing Technology Center | 249,156 | 4,161 |
| WI | Northwest Wisconsin Manufacturing Outreach Center | 172,018 | 3,582 |
| OR | Oregon Manufacturing Extension Partnership | 295,514 | 3,186 |
| MD | University of Maryland Manufacturing Assistance Program | 224,834 | 3,184 |
| NE | Nebraska Manufacturing Extension Partnership | 142,483 | 3,145 |
| RI | Rhode Island Manufacturing Extension Services | 128,873 | 2,935 |
| FL | Florida Manufacturing Extension Partnership | 181,849 | 2,716 |
| CA | Corporation for Manufacturing Excellence (Manex) | 316,356 | 2,272 |
| CO | Colorado Association for Manufacturing and Technology | 199,414 | 2,131 |
SOURCE: MEP data, FY 2010, NRC staff calculations.
Those centers with the largest jobs impact per SME are also to a considerable degree the centers with the largest jobs impact per client. One possible question concerns the population served: Larger companies will
TABLE 5-5 Jobs Impact—Top Quintile
| State | Center Name | Sum of Job Impacts | Jobs per Client | Jobs per SME |
| OH | Ohio Manufacturing Extension Partnership | 4,163 | 101.5 | 7.33 |
| NY | New York Manufacturing Extension Partnership | 4,871 | 41.6 | 4.31 |
| FL | Florida Manufacturing Extension Partnership | 2,022 | 47.0 | 4.04 |
| TN | Tennessee Manufacturing Extension Partnership | 2,205 | 31.5 | 2.21 |
| IL | Illinois Manufacturing Extension Center - Downstate | 3,160 | 51.0 | 1.76 |
| MA | Massachusetts Manufacturing Extension Partnership | 1,642 | 58.6 | 1.57 |
| AR | Arkansas Manufacturing Solutions | 4,624 | 55.7 | 1.54 |
| TX | Texas Manufacturing Assistance Center | 4,751 | 34.2 | 1.45 |
| PA | Catalyst Connection | 1,071 | 48.7 | 1.42 |
| OK | Oklahoma Manufacturing Alliance | 823 | 17.5 | 1.30 |
| MS | Mississippi Technology Alliance | 2,851 | 48.3 | 1.11 |
| CT | Connecticut State Technology Extension Program | 1,390 | 31.6 | 1.07 |
SOURCE: MEP, NRC staff calculations.
obviously tend to generate larger gross job impacts from successful projects. Where jobs per impacted client are 30 or more, the center is probably not primarily focused on smaller firms.
EFFICIENCY
MEP gathers a considerable amount of data related to efficiency, which we define as federal resources per unit of defined output. Federal funding is in turn used to buy inputs that include, for example, full-time equivalent (FTE) positions at the center and hours of engagement per project.
Some of these inputs might be potential independent variables, explaining the internal efficiency with which centers address their resources to tasks at hand.
Such detailed efficiency analysis is, however, beyond the scope of this analysis. Here we focus instead on broader measures of input—notably federal funding.
Table 5-6 shows two input measures—federal funding per client impacted and federal funding per SME in service area. In this case, rankings are reversed: Centers scoring lowest (i.e., with least cost per unit) are performing best.
Box 5-2
The Challenges of Evaluating Impact
MEP services potentially have a range of impacts on firms, including improving knowledge and capabilities, enhanced strategic and business planning, training and skills development, improved efficiency, yield, quality or waste reduction, increased productivity, and improved product and service development. These impacts may in turn lead to measurable economic outcomes, including increased sales, although they may also result in greater business stability and resilience. It is appropriate to use a range of evaluation methods to probe the range of impacts and outcomes associated with the MEP, including qualitative and quantitative methods. Indeed, this has been the case.
As Appendix B on MEP evaluation indicates, there have been a large number of evaluations of the MEP using diverse methods and metrics. This includes studies where controls are applied to ascertain the “additionality” of MEP services compared to the situation that would have occurred if MEP services had not been received (noting that the firm might otherwise have changed in some way). In some cases, controls have been applied through logic-based counterfactual methods (studies by Cosmos Corporation in the 1990s and SRI International and Georgia Tech in 2009). In other instances, it has been possible to develop formal comparison groups of MEP clients and nonclients, including controlling for selection bias in the kinds of clients served by the MEP. A first round of comparison studies was undertaken in the 1990s. These studies include Jarmin (1999) use of national data from the Longitudinal Research Database of the Annual Survey of Manufacturers to construct a comparison group for MEP clients, and comparison group studies by Shapira and Youtie (1998) and Nexus Associates (1999) at the state level.
More recently, longitudinal comparison group studies of MEP clients and nonclients have been undertaken at the national level by Cheney et al. (2009) and at the state level by SRI and Georgia Tech (2009) and Youtie et al. (2008, 2010). These control group studies generally find that MEP clients performed better than comparable firms who did not receive MEP services, as measured by changes in value added, productivity, or resilience during recession, although the Cheney et al. (2009) study found that additional value added per worker impacts from MEP services were sensitive to econometric modeling methods. These control group studies are useful in that they explicitly include comparisons with nonassisted firms and can adjust for selection bias.
At the national level, there has been a reliance on available U.S. Census Bureau data. While this data is collected through robust and stringent procedures, there are time delays in reporting, relatively few variables are available, and access procedures (to ensure confidentiality) are complex. Short of undertaking a costly independent survey of MEP clients and nonassisted firms, these are limitations of current national control group methods.
TABLE 5-6 Federal Funding by Center, FY 2010 (10 Most Efficient Centers)
| State | Center Name | Federal Funding (Dollars) | Total Expenditures (Dollars) | Fed Funding per client (Dollars) | Fed Funding per SME (Dollars) |
| PA | Northwest Pennsylvania Industrial Resource Center | 702,744 | 1,984,123 | 13,140 | 1,215 |
| PA | IMC-PA | 363,412 | 1,017,078 | 14,530 | 1,021 |
| PA | MANTEC | 674,820 | 1,941,301 | 17,489 | 771 |
| PA | Northeastern Pennsylvania Industrial Resource Center | 504,000 | 2,179,905 | 18,632 | 1,927 |
| ID | Idaho TechHelp | 508,800 | 1,014,826 | 18,793 | 521 |
| KY | Manufacturing Extension Partnership of Louisiana | 701,868 | 1,540,952 | 22,661 | 460 |
| PA | Catalyst Connection | 1,092,004 | 3,325,741 | 23,926 | 1,013 |
| HI | Hawaii HTDC - MEP | 464,416 | 698,992 | 24,964 | 721 |
| WY | Manufacturing-Works | 372,048 | 1,031,756 | 25,165 | 1,816 |
| PA | Manufacturers Resource Center | 588,000 | 2,573,850 | 25,234 | 1,675 |
SOURCE: MEP.
The data indicate that there are massive differences between the most and least frugal centers. The Northwest Pennsylvania Industrial Resource Center uses less than $14,000 in federal funding per impacted client, while the Maine MEP utilizes more than $87,000. Further research is needed to explain these large differences.
There is some overlap between the two metrics among the most resource-intensive centers, though not so among the most frugal centers, only one of which falls into the bottom spending groups on both metrics. It is noticeable that all 6 Pennsylvania centers are among the 10 lowest spenders per client, though not among the lowest spenders per SME.
MEP data show that these differences tend to persist over time. Figure 5-4 shows that the amount of federal dollars per job created at the Alabama Technology network remains more than four times the cost required per job in Texas or Wyoming, even though the cost in Alabama declined by a quarter in FY 2010.
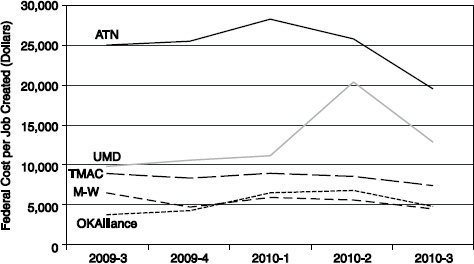
FIGURE 5-4 Cost in federal dollars per job created, selected MEP Centers, FY 2010 (4-quarter moving average).
SOURCE:: MEP.
Looking at inputs alone, even on a per-client basis, provides only a limited view of efficiency. What may matter more is the relationship between inputs and eventual outputs—which MEP measures primarily in terms of bottom-line impacts for the client.
Figure 5-5 charts the relationship between federal funding per client and bottom-line impacts per client. It illustrates the wide range of efficiency demonstrated by the centers. For our purposes here, we have excluded results from the centers in Arkansas, Virginia, and Mississippi where the 2010-2011 outcomes were so much higher than for other centers that they would distort the overall picture.
The chart above illuminates the opportunity to focus on centers where the highest returns have been generated at the lowest cost. The chart shows that 12 centers fall into the high cost-low return quadrant, while 8 are in the low cost-high return quadrant.
SCOPE AND OUTREACH
Centers have been under some pressure to improve penetration, and perhaps in part as a result have been reporting a substantial increase in “touches”—contacts with potential clients. However, the number of actual client engagements has been essentially flat since at least 1999. It should be noted that while the population of firms of a given size is well understood and tracked via the Census Bureau (and the Small Business Administration), not all firms within
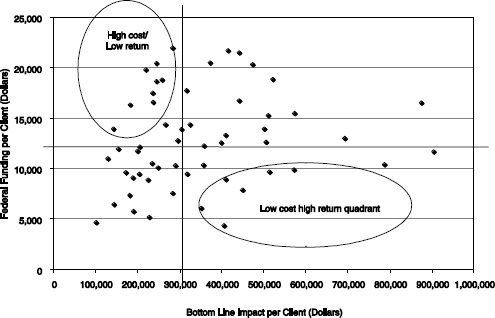
FIGURE 5-5 Center impacts per client and federal funding per client.
SOURCE: MEP data.
a given size population may be addressable by the local MEP center—they may, for example, be uninterested in MEP services, or already have access to alternative services.
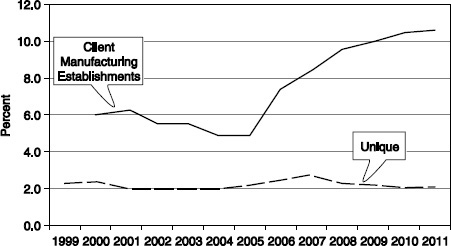
FIGURE 5-6 MEP market penetration trends.
SOURCE: MEP.
There are many possible explanations for the doubling of touches since 2005, although the lack of additional engagements raises the questions as to whether seeking additional touches with new potential clients is a useful way to expend scarce resources.
It is certainly true that in the context of the entire manufacturing sector, MEP reaches only a small percentage in a given year. However, this debate does to some extent appear to be based on questionable assumptions:
- Annual figures. Given that MEP projects are challenging and sometimes expensive, at least in terms of time and resources for companies, and that MEP is focused on SMEs with limited capacity, it makes little sense to focus on a single year. Companies that have been served by MEP may be considerably less likely to return the next year. So penetration could be measured over a period of years, not just one.
- Limited client capacity. MEP itself suggests that 80 percent of all SMEs are not sufficiently engaged in strategic thinking to be ready for MEP services.4 Chuck Spangler of South Carolina MEP observed that most of his clients are in the range of 100 employees.5 Other center directors have made similar observations. MEP centers are understandably cautious about expending efforts to engage potential clients who are not ready for their services: There is longer-term value in mentoring and readying potential clients, but such efforts may well impinge on the immediate delivery of measurable and revenue-generating projects.
- MEP centers indicate that 40 percent to 70 percent of clients are returning customers.6 This suggests that about on average at least one-third are new customers in any given year. Overall then, the data suggest that over a 5-year period a given MEP center provides in-depth services to 4 percent to 5 percent of SMEs in its service area; this is about a quarter of all the SMEs who are—according to MEP— sufficiently engaged to provide opportunities for center services. While this share could certainly be increased, and some centers manage to reach out into the community much more effectively than others, their data do not appear to provide strong evidence that market penetration rates are low.
These points are reflected in data from Vermont, for example, where between January 1996 and June 2011 the Vermont Manufacturing Extension Center served more than 865 of the state’s approximately 2,000 manufacturing companies.7
________________
4Yakimov and Woolsey, 2010, op. cit. p. 19.
5NRC/Georgia Institute of Technology Workshop on “Diversity and Achievements: The Role of the Manufacturing Extension Partnership in the South,” April 20, 2012.
6Responses to NAS information request to MEP centers, May 2012.
7Vermont MEP 2011 Impact Report, p. 3.
A Balancing Act
MEP centers must perform a complex balancing act, weighing the need for revenue (and especially recurrent revenue, which tends to come from larger and more established firms) against the mission need to support smaller businesses and the need to enhance innovation (which encourages a focus on larger firms with more resources) against the need to support small manufacturing businesses in what they actually do (which covers many small nongrowing businesses). MEP should recognize that an assessment of possible trade-offs should not automatically result in decisions favoring support for larger and more innovative firms. The need to meet the federal match through fees and the reliance on in-kind contributions may also be pushing the program away from its presumptive target group—i.e., away from smaller companies and rural firms that should be a part of MEP’s public vocation. MEP centers that work with the target audience of SMEs also tend to have smaller jobs impacts. Centers in markets with a greater percentage of smaller companies, or centers that choose to focus on the SMEs, tend to be at a disadvantage in the calculation of results.
Several metrics help to indicate the extent to which centers reach out into the manufacturing community in their region.8 MEP measures both “touches,” i.e., contacts with manufacturers, as well as engagements. Both can be measured against the total local population of manufacturers, and both provide a useful data point against which to evaluate community engagement: Neither wide outreach with lower levels of engagement nor high levels of engagement with a relatively small percentage of manufacturers can be seen as best practice in connecting to the community.
However, while client engagements is a well-verified number backed by actual contracts between centers and clients, touches are unverified by MEP and are open to different measurements by different centers. It is therefore a figure to be used with considerable caution.
That being said, it may be useful to provide a blended score for these two metrics, scoring each by quintile and adding the quintiles to provide an overall relative ranking for each center. This approach limits the impact of outliers while providing sufficient detail to indicate the relative success or otherwise of each center. Complete tables with both raw and normalized numbers are found in Appendix C. Here we provide only the 10 highest and 5 lowest scoring centers (and ties). See Table 5-7.
Table 5-7 shows that a number of centers score well, both on touches and clients, while others score poorly on both. Leaving aside the special cases of Alaska and Hawaii,9 median touches for the top scoring group was just under a fifth of the target population, 19.4 percent, while that for the bottom group was
________________
8As noted in Chapter 4, the committee is aware of the limitations of MEP metrics.
9Where the small-manufacturing sector is closely interconnected and hence is easy to touch.
4.3 percent. Similarly, the median impacted client percentage for the top group was 6.8 percent, and that for the bottom group was 1.1 percent.
These data show that there are large differences in the degree with which different centers reach out into the community. Accordingly there is likely room for the further adoption of best practices in this area. In addition:
- On this preliminary basis, it appears that the best predictor of eventual client acquisition (percent impacted) is not a center’s success in converting initial touches into clients; it is the number of initial touches themselves. The more effectively the center touches its local community, the more likely it is to acquire clients and engagements. However, as the data on touches are unverified by MEP, further review is warranted before this point can be confirmed.
- Conversely, all of the centers that scored low on touches also scored low on client acquisition, although several had respectable conversion rates.
![]() This is to some degree surprising, as many centers have observed in interviews that a preponderance of their client engagements are with clients with whom they have previously engaged.10
This is to some degree surprising, as many centers have observed in interviews that a preponderance of their client engagements are with clients with whom they have previously engaged.10
![]() Size of region appears to play a role—all of the centers with the lowest conversion rates had at least 3,500 manufacturing companies in their region; only 2 of the top-scoring group did so, and none had more than 5,000 companies in their region, while 6 of their 8 bottom centers did so.
Size of region appears to play a role—all of the centers with the lowest conversion rates had at least 3,500 manufacturing companies in their region; only 2 of the top-scoring group did so, and none had more than 5,000 companies in their region, while 6 of their 8 bottom centers did so.
- Of the top 10 positions, 5 are occupied by Pennsylvania centers, including the top 2.
The data suggests that where regions have large SME populations, centers may struggle to touch a substantial share of these companies, and hence to generate a high rate of client acquisitions relative to the population.
Among other things, this suggests that MEP might consider whether more centers with smaller manufacturing populations might be a better option in some areas.
Finally, and perhaps most important, it suggests that MEP should perhaps pay additional attention to touches—to preliminary outreach, in other words. It appears that some centers are more active and use different modalities for outreach, so there should be opportunities to spread best practice in this area.11
________________
10NRC information request to center directors, July 2012.
11Ibid.
TABLE 5-7 Measure of Outreach Success, FY 2010
| Center Name | #SME in service area | Touches/yr | Impacted Clients/year | Touch Percent of SMEs | Impacted clients Percent SMEs | Impacted clients per touch | Percent Touch quintile | Percent Impacted quintile | Sum of quintiles scores |
| Highest scores |
|||||||||
| PA Catalyst | 3,282 | 635 | 139 | 19.3 | 4.2 | 21.9 | 5 | 5 | 10 |
| PA NE IRC | 1,131 | 219 | 117 | 19.4 | 10.3 | 53.4 | 5 | 5 | 10 |
| NM MEP | 1,535 | 306 | 73 | 19.9 | 4.8 | 23.9 | 5 | 5 | 10 |
| PA IMC | 996 | 292 | 70 | 29.3 | 7 | 24 | 5 | 5 | 10 |
| AK MEP | 501 | 397 | 43 | 79.2 | 8.6 | 10.8 | 5 | 5 | 10 |
| WY MfWorks | 568 | 124 | 41 | 21.8 | 7.2 | 33.1 | 5 | 5 | 10 |
| SC MEP | 4,260 | 854 | 158 | 20 | 3.7 | 18.5 | 5 | 4 | 9 |
| IA CIRC | 3,718 | 710 | 152 | 19.1 | 4.1 | 21.4 | 4 | 5 | 9 |
| PA NW IRC | 1,633 | 223 | 151 | 13.7 | 9.2 | 67.7 | 4 | 5 | 9 |
| MRC PA | 1,537 | 256 | 102 | 16.7 | 6.6 | 39.8 | 4 | 5 | 9 |
| DE MEP | 634 | 82 | 47 | 12.9 | 7.4 | 57.3 | 4 | 5 | 9 |
| HA MEP | 970 | 467 | 28 | 48.1 | 2.9 | 6 | 5 | 4 | 9 |
| Lowest scores |
|||||||||
| CA Manex | 12,395 | 506 | 89 | 4.1 | 0.7 | 17.6 | 1 | 1 | 2 |
| WA Imp | 7,582 | 435 | 86 | 5.7 | 1.1 | 19.8 | 1 | 1 | 2 |
| IN Purdue MEP | 8,790 | 355 | 68 | 4 | 0.8 | 19.2 | 1 | 1 | 2 |
| OR MEP | 5,658 | 285 | 61 | 5 | 1.1 | 21.4 | 1 | 1 | 2 |
| AZ MEP | 5,005 | 211 | 59 | 4.2 | 1.2 | 28 | 1 | 1 | 2 |
| CO MEP | 5,240 | 253 | 56 | 4.8 | 1.1 | 22.1 | 1 | 1 | 2 |
| MD UMD MA | 3,601 | 124 | 51 | 3.4 | 1.4 | 41.1 | 1 | 1 | 2 |
| KY MAC | 4,064 | 174 | 32 | 4.3 | 0.8 | 18.4 | 1 | 1 | 2 |
SOURCE: MEP data, FY 2010; NRC staff calculations.
NOTE: MEP definitions. Touch penetration means potential SME manufacturing clients with which the center has been in contact during the previous 12 months. No further details are provided. Impacted clients means clients with which the center had an engagement. Quintiles refer to the quintile in which the individual center metric falls when centers are arrayed from highest to lowest scoring, with the highest quintile scoring 5 and the lowest scoring 1.
EVALUATIONS OF THE MEP
Aside from regular collection of client and center data, and the assessment of individual centers, MEP and other sponsors have invested in a range of evaluation studies. We review them in brief below (Appendix B provides a detailed review of this literature). A diverse range of MEP evaluation studies have been conducted over the past two decades, in the following categories.
- Logic-based studies. MEP has used logic-based case studies carried out by independent evaluators to examine clients with exceptionally high impacts from MEP services (Cosmos Corporation 1997, 1998, 1999). More recently, similar studies have been undertaken to improve understanding how new services are being implemented (SRI and Georgia Tech 2009a). The logic models describe MEP services, showing inputs, work processes, intermediate outcomes, and impacts. Counterfactual probes are used to discern what might have happened without program participations.
- Comparison group studies. These studies of clients and nonclients have been used partly in an effort to control for selection bias (Jarmin 1997, 1997; Nexus Associates 1996; Oldsman 1996; Nexus Associates 1999; Youtie et al. 2008, 2010) and to account for observable and unobservable factors (Cheney et al. 2009).
- State evaluations. Several states have conducted evaluations of their particular state centers or system of centers. New York evaluated their centers in the 1990s (Oldsman et al. 1996, Nexus Associates 1996). Pennsylvania conducted two highly regarded assessments of the centers in the Industrial Resource Center system (Nexus Associates 1999, Deloitte 2004). Ohio included MEP program analysis as part of their assessment of the Third Frontier and other technology-based economic development programs (SRI and Georgia Tech 2009).
- Center evaluations. Most centers do not have additional evaluation programs beyond what is required by the national or state sponsor. However, a few centers have developed and maintained special capabilities to support their evaluation efforts. The Michigan Manufacturing Technology Center created a longitudinal dataset of survey-based metrics for full-scale comparison, the Performance
-
Benchmarking Service (Luria 1997, Luria and Wiarda 1996). The Georgia MEP has administered a survey of nonclients and clients which has been used for evaluation, including controlled studies, as well as conducting studies to address particular needs of the center from time to time (Shapira and Youtie 1998; Youtie et al. 2008, 2010).
- Trade association studies. Trade associations have been responsible for several evaluations of aspects of the program. The National Association of Manufacturers included a question about service use as part of its survey of members’ technology adoption practices (Swamidass 1994). The Modernization Forum (a former association of MEP centers) sponsored several studies in the early years of the MEP. In the 2000s, the Advanced Small Manufacturers Coalition (AMSC) (the association of MEP centers), along with other nonprofit organizations, has turned the emphasis of MEP evaluations towards strategic redirection of the program (NAPA 2003, 2004; AMSC 2009; Stone & Associates and CREC 2010; MEP Advisory Board, Yakimov, and Woolsey 2010) and international benchmarking efforts (Ezell and Atkinson 2011).
- Service delivery reviews. Some independent evaluations have reviewed particular types of services or service delivery pilots including interfirm networking (Welch et al. 1997) and SBDC-MEP partnership programs (Yin et al. 1998).
EVALUATIONS RESULTS AND OUTCOMES
These evaluations have resulted in a substantial body of studies related to the MEP program. The table in Appendix B identifies 39 evaluative studies in the 1990s and another 26 in the 2000s. Thirty percent of these studies are published in academic journals or books, including in two journal special issues in the 1990s (Research Policy 1996 issue and Journal of Technology Transfer 1998 issue). More than 10 percent are official federal government publications, with the remainder comprised of state government publications, conference proceedings, “gray” literature reports and white papers, dissertations, and informal memoranda.
The MEP client survey is used by approximately one-third of the studies. Six studies used case study methodology (although a few others had case examples within primarily quantitative papers), while five linked client data to administrative databases at the state or national level. Fourteen studies utilized comparison groups. Seven used cost-benefit and/or fiscal impact methodologies to represent public and private returns from the program.
Evaluation studies in the 1990s used diverse and sometimes novel methods to understand program processes and effects. This mix of studies was heavily influenced by the MEP’s evaluation working group 1993-1999, which
produced a formal evaluation framework.12 Subsequent studies attempted to measure penetration, intermediate effects, and short and longer-term outcomes on clients and the broader economy. 13
The studies conducted in the 2000s reflected a different climate. Whereas the 1990s was a period of program expansion and experimentation, the 2000s saw substantial fluctuations in the program’s budget, a systematizing of services, and consolidation of the number of centers, as some centers were combined into statewide or regional programs. The MEP evaluation system itself became more standardized, reflected in the MEP evaluation plan and metrics published by Voytek et al. in 2004. Evaluations in the 2000s utilized more international comparisons as well as expert panelists and document review.
The following sections draw upon the studies to highlight key findings and conclusions.
Competition and Complementarity with Private Service Providers
There have been questions about whether MEP competes with or complements private service providers. This was the subject of a major study sponsored by the Modernization Forum through surveys of MEP clients, a comparison group of manufacturers, and private consultants (Modernization Forum and Nexus Associates 1997; Oldsman 1997). The report indicated that MEP complements private services. Seventy-three percent of manufacturer responses indicated that MEP complemented consultants’ work, while only 7 percent of MEP clients reported that the MEP offered the same services as private consultants. MEP clients also appeared more likely to experience benefits, in that the probability of a typical MEP customer improving its performance was 5.4 times higher than a typical private service client.
Four governmental assessments—OMB (2002), National Commission on Fiscal Responsibility and Reform (2010), Schact (CRS) (2011) and GAO (2011)—addressed this issue. OMB’s Program Assessment Rating Tool (PART) concluded that “It is not evident that similar services could not be provided by private entities,” but the National Commission on Fiscal Responsibility and Reform concluded that MEP provides services that exist in the private sector. GAO’s 2011 review of the cost-share match requirements reported that rural areas were harder to serve as centers sought to find matching funds.
________________
12Atlanta Workshops on the Evaluation of Industrial Modernization, Aberdeen Woods, GA, 1993, 1994, 1996, 1997.
13Swamidass (1994) surveyed National Association of Manufacturers (NAM) members and found that only 1 percent indicated that government was an important source of assistance in technology investment decisions. However, many MEP centers are known through their university or center name rather than as a source of government assistance, making it difficult to measure use of the program beyond counts of manufacturers served.
To address OMB concerns, the National Academy of Public Administration (NAPA) (2003) used a panel and document review and interview process, and concluded that small- and medium-sized manufacturers still faced barriers to productivity improvement, and these firms were underserved by the private market.
Collaboration and Partnerships
MEP has engaged in several formal efforts to collaborate with other service-providing organizations. Shapira and Youtie (1997) found that MEP sponsorship led to greater service coordination than individual center efforts alone or state government demands would have provided, which in turn generally improved the services to MEP clients, albeit at a significant expenditure of resources for validating and coordinating with these providers.
Partnership with state governments has been an important element for some centers. MEP’s own analysis (MEP 1998) concluded that two-thirds of the states would not provide state funds if federal funding was discontinued.
Although most MEP technical assistance services are delivered on a one-on-one basis to a single manufacturing client at a time, MEP did invest in a networking service delivery pilot from 1996 to 1998. Evaluation results indicated that the median net benefit of network participation to the firm was $10,000, while some members experienced significantly higher benefits, raising the mean to $224,000 (Welch et al. 1997).
Differentiation within the Program
The mix of services and delivery methods was the subject of various evaluations in the 1990s. The GAO’s study identified a misalignment between the legislation establishing the centers—which emphasized technology transfer from federal laboratories—and the needs of small manufacturers (primarily assistance with proven technologies) (GAO 1991). This conclusion was reinforced by the 1993 National Academies study (National Academy of Sciences 1993).
Youtie and Shapira (1997) observed that outcomes are associated with service mix: Marketing and product development services were 60 percent more likely to lead to sales outcomes, energy products more likely to lead to cost savings, plant layout and environmental projects more likely to generate capital expenditure avoidance, and quality projects were not strongly associated with any type of outcome. Oldsman and Heye (1998) concluded that services which enabled a manufacturer to raise piece prices generated more profits than services that reduced the scrap rate. Luria (1997) maintained that the program’s service mix attracted cost-minimization/lean companies that were not on the path to increasing productivity. Cosmos Corporation led case studies of high-impact projects with 25 manufacturing clients (1997), then 6 more manufacturing clients (1998), and finally 7 different highly transformed manufacturers (1999).
The results indicated the importance of integration of services, and that leadership by top management was required to make the necessary discontinuous changes across multiple systems.
Center-to-Center Comparisons
Center-to-center comparisons were the subject of a few evaluation studies. Chapman (1998) showed that different centers were at the frontier of different service areas, with no one center consistently in the lead. Wilkins (1998) compared 14 centers, similarly finding that no one center excelled on all measures.
Center-to-center variability continues, indicating the existence of stronger and weaker performing centers. An analysis of Minimally Acceptable Impact Measure scores in 2001, 2003, and 2005 concluded that there were no consistent top-performing centers from period to period, although a few centers landed near the top in many of the periods under analysis (Youtie 2005). NAPA (2004) found strong performance differences between centers. The report identified a substantial positive association between high-performing centers and number of clients served, years in operation, number of FTE employees for the center and per million dollars of federal investment, and ratio of state dollars.
Market Penetration
Market penetration has been addressed in several studies. Stone & Associates and CREC (2010) found penetration to be a concern in that the MEP only serves 10 percent of manufacturers, 2 percent with in-depth assistance. One question is whether this reflects cherry picking of clients, but Deloitte (2004) reported that a comparison of the credit rating of IRC PA clients and a matched group did not generate statistically significant differences. However, GAO (2011) found that 80 percent of MEP centers were very or somewhat likely to give preference to revenue-generation projects with larger clients.
A number of reports have suggested that the MEP needs to expand its reach and to attract a wider share of the manufacturing sector. Stone notes that “currently the MEP national network only provides in-depth assistance to 9 percent of the available market of companies with 20-499 employees that are willing to seek out and invest in outside support.”14 Indeed, the need for a new business model and strategy for MEP is in part based on the perception that the current range of offerings is too narrow, and that a broader range—especially including growth-related services—would expand MEP’s reach by bringing in new clients.
________________
14Stone et al., 2010, op. cit. p. 7. It should be noted that this report provides no reference or basis for this claim. It is hard to determine where this data could have come from, as there are no known surveys or reports that reference such a population.
Intermediate Outcomes
Given the difficulties of measuring the final impact from support programs like MEP, several studies focused on intermediate outcomes. Several client survey-based studies provided nonquantitative evidence that a higher percentage of companies engage in implementation following MEP assistance. Two-thirds of Georgia MEP customers took action on center recommendations (Youtie and Shapira 1997). Nearly 30 percent of Massachusetts center customers would not have carried out changes without MEP assistance (Ellis 1998). Many client surveys also suggested positive views of performance improvement, with the GAO (1995) finding that 73 percent of manufacturing survey respondents across the nation had better business performance and Ellis (1998) indicating that 71 percent of Massachusetts manufacturers who participated improved their competitiveness as a result of center assistance.
Technology Adoption
Shapira and Rephann (1996) observed that clients of a manufacturing technology assistance program in West Virginia were more likely to adopt individual technologies and were also more amenable to technological investments than nonparticipants. However, these clients did not have significantly higher aggregate adoption across a range of technologies. The Luria and Wiarda (1996) Performance Benchmarking database analysis indicated that MEP customers adopted most technologies (with the exception of information technologies) more quickly than non-MEP customers. However, evidence from case studies of centers in Northern Pennsylvania, Michigan, and Minnesota conducted by Kelly (1997) led to the conclusion that the use of one-on-one services militates against widespread diffusion of knowledge and skills important for advanced technology usage.
Overall, these studies indicate that MEP was associated with accelerated technology adoption by clients in these studies, but that the aggregate effects were modest at best.
Productivity
The relatively small size of the MEP means that it is difficult to measure any aggregate effects at the level of national economic growth or productivity. However, a number of studies have measured productivity impacts at the level of participating firms, including with controls for nonparticipating companies. Measuring productivity—usually by value added—is challenging for several reasons. There is a high degree of skew, with the majority of impacts coming from a small number of clients (Oldsman 1996). Indeed, Luria notes that the median productivity impact is zero. 15 Most manufacturers had difficulty
________________
15Telephone interview, March 15, 2012.
calculating productivity impacts, and the timing of measurement led some customers to overestimate benefits, especially sales impacts, and underestimate costs, except for a small number of high-impact projects (Youtie and Shapira 1997).
While customer surveys tended to present positive outcomes, quantitative business outcomes tended to be more moderate when comparison groups were used to control for factors other than program assistance. Some comparison group studies surveyed all manufacturers in a particular region (e.g., Youtie et al. 1998) or in a national sample (e.g., Luria 1997 and Luria and Wiarda 1996). Others linked MEP customer information to administrative datasets at the Census Bureau or Department of Labor and selected enterprises from these datasets to match client profiles (Jarmin 1997, 1999; Oldsman 1996; Nexus Associates 1996).
Most of these studies focused on productivity as measured by value added per employee, although other outcomes metrics were used as well. Jarmin (1997, 1999), Shapira and Youtie (1998), and Nexus Associates (1999) found clients to have higher growth in value added per employee than nonclients. Jarmin’s analysis of eight MEP centers from 1987 to 1992 found productivity increases in clients over nonclients ranging from 3.4 percent to 16 percent. Nexus Associate’s analysis of Pennsylvania centers reported higher labor productivity of 3.6 percent to 5 percent in clients as compared with nonclients. The average Georgia client had between $366,000 and $440,000 more in value added than nonclients (Shapira and Youtie 1998). Note that these analyses tended to focus on a few centers or a network of centers (Georgia in the case of Shapira and Youtie, and Pennsylvania in the case of Nexus Associates).
Comparison Group Analysis
Other comparison group-based evaluations found fewer differences between served and unserved manufacturers. Analysis of the Performance Benchmarking dataset showed that MEP clients do better than nonclients in sales growth, job growth, and adoption of some process improvements, but clients are not significantly better than nonclients in growth in wages, profits, and productivity (Luria 1997).
MEP and Jobs
The effect of the MEP on job creation and retention is not clear. Although NIST survey data reports positive employment impacts (in part because of the inclusion of jobs retained), this association is not necessarily found when comparison groups are used. For example, Oldsman (1996) found that participating manufacturers in New York added 5.7 percent fewer workers than similar, nonparticipating companies. Because MEP seeks to enhance productivity, efficiency measures may eliminate some factory worker positions. Given the lack of relevant and robust data, the committee has not addressed the
use of jobs as a system metric, or the connection between employment and productivity.
Evaluating Growth-oriented Services
SRI and Georgia Tech (2008) found that customers of the E!WW pilot program were more likely to be in industries with job losses, to be private family-owned firms, have a concentrated structure for product development, and have a history with technological implementation.16 These observations suggests that different kinds of firms may have very different patterns of demand for growth-oriented services.
State-focused Evaluations
Survey-based analyses of Georgia clients and nonclients in 2008 and 2010 maintained prior findings of higher increases in value added per employee for clients. Clients in Georgia were also more apt to engage in product and process innovation than similar noncustomers (Roper et al. 2010), and while rural and urban manufacturers were similar in their adoption of hard technology, rural manufacturers were less likely to use soft technologies and supply chain integration than their urban counterparts (Youtie and Shapira 2005).
SRI and Georgia Tech (2008) found that Ohio MEP customers were more likely to have retained jobs than noncustomers, controlling for industry, size, and other factors.
In 2009, MEP commissioned an effort to update the original Jarmin study. The resulting SRI and Georgia Tech study (Cheney et al. 2009) used two different models to assess productivity impacts of clients and nonclients from 1997 to 2002. Results from these two models diverged sharply, indicating positive and negative effects, respectively. However, both models found significant positive productivity outputs associated with MEP assistance for smaller establishments, certain types of MEP services, and a short delay (one or two years) after receipt of service.
________________
16E!WW was designed by an MEP contractor to “help MEP clients grow their revenues and profits through identification of ideas that have higher probabilities of success and through faster movement of selected ideas into implementation.” See Lynne Manrique, David Roessner, Jan Youtie, and Philip Shapira, “Logic Model and Case Study Design Eureka! Winning Ways Client Engagement Case Studies,” prepared for the National Institute of Standards and Technology Manufacturing Extension Partnership, January 2008. See also Lynne Manrique, Kamau Bobb, David Roessner, Jan Youtie, and Philip Shapira,” Eureka! Winning Ways: Analysis of Early Client Experiences,” report for National Institute of Standards and Technology, Manufacturing Extension Partnership, SRI International and Georgia Institute of Technology, August 2008.
Aggregate Outcomes: Cost-Benefit and ROI
Results from most cost-benefit studies have been positive, although the scale of impacts is sensitive to the methods and assumption used. Shapira and Youtie (1995), Nexus Associates (1996), and Michigan Manufacturing Technology Center (1996) demonstrated that net public and private benefits of MEP assistance outpaced costs by a ratio between 1:1 and 3:1. A Pennsylvania study (Nexus 1999) reported much more positive net returns to the state investment of 22:1. Thompson (1998) found that taxpayer payback in Wisconsin varied from slightly below break-even to positive.
Several of these studies addressed some of the methodological issues involved in cost-benefit analysis. These include accounting for the full range of private and public costs and benefits, addressing returns and investments over time, and considering zero-sum redistribution of benefits and value-added capture through downward adjustment of sales impacts for export sales and value added (e.g., Shapira and Youtie 1995).
RECOMMENDATIONS FROM EVALUATION STUDIES
Twelve evaluation studies included recommendations, and these studies form the basis of the following analysis.17 As described in Table 5-8, the main recommendations of these studies were:
- The need to transition toward services that involve new product and market offerings.
- Integration of advanced technology into products.
- Changes in federal funding, with two studies recommending a substantial increase in federal funding (Stone & Associates and CREC 2010; Helper and Wial 2010), while NAPA (2004) called for greater flexibility in the funding formula. In contrast, the National Commission on Fiscal Responsibility and Reform argued for sun-setting federal funding (NCFRR 2010).
- Increased attention to exporting and global supply chains (NAPA 2004; Ezell and Atkinson 2011).
- More green service offerings (MEP Advisory Board (2010)
- Workforce retention and development (MEP Advisory Board 2010; Deloitte 2004).
Table 5-8, summarizes the key recommendations from these evaluation studies.
________________
17The National Commission on Fiscal Responsibility and Reform (2010) recommended the elimination of federal funding for the MEP. This was as part of a broad review of government business support programs with the aim of seeking fiscal savings, rather than a specific evaluation of the MEP.
TABLE 5-8 Summary of Recommendations in Evaluation Studies
| Author/Year | Recommendations |
| Luria (1997) | Nurture distinctive manufacturers with proprietary or design-intensive products and encourage other manufacturers to follow this strategy. |
| Modernization Forum and Nexus Associates (1997), Oldsman (1997) | Enhance work with consultants through using resources to identify them, application materials, project proposals; selecting consultants; developing standard contracts for working with them. |
| Oldsman and Heye (1998) | Help companies become more distinctive as well as more efficient. |
| NAPA (2004) | Focus more on technology diffusion, product development, supply chain integration, and integrating the national network with other state and university providers and private-sector firms. Provide greater flexibility in funding. |
| Davila (2004) | New evaluation metrics and approaches should be developed to measure adaptive learning, worker benefits, public benefits and costs, spillover effects, and how to allocate scarce MEP resources. |
| Deloitte (2004) | Lower barriers to access; offer more business strategy, product innovation, worker retention services; continue process innovation; support and grow advocacy and research for SMEs. |
| Youtie (2005) | Examine consistently high-performing centers' service mix and survey practices. |
| SRI and Georgia Tech (2008) | Focus marketing on target customer characteristics; think strategically about participant mix; select and train growth coaches; use team-based approaches and fewer idea limitations in service design; evaluate after one year. |
| Helper and Wial (2010) | Enhance funding for MEP to provide more product and market development services and greater coordination between MEP and other federal programs for manufacturers. |
| Stone & Associates and CREC (2010) | Expand program scale from current levels of 7,000-8,500 firms served to 30,000 with substantially greater funding. |
| MEP Advisory Board, Yakimov, Woolsey (2010) | Streamline innovation and growth services, target green services, emphasize exporting, develop talent. |
| Ezell and Atkinson (2011) | Offer technology-acceleration programs and practices, exporting, energy efficiency, quality, standards, and design. |
CONCLUDING OBSERVATIONS
In general terms, the following points may be drawn from the extensive set of evaluations discussed above, bearing in mind caveats about the limitations of data and methods.
Researchers included a considerable range of outcomes as possible metrics:
- Productivity. Value added, though difficult to calculate, has been used as a primary program metric. Here control group analysis has found that center clients have been associated with modest increases on average productivity, at levels ranging up to about 5 percent. The most recent study (Cheney 2009) used two models which generated contradictory outcomes (positive and negative productivity changes, respectively).
- Market penetration. Recent studies find that MEP has reached out to 10 percent of its potential market of manufacturing firms (with 2 percent client engagements). They argue that this rate of penetration is low, and is also focused on larger firms.
- Return on investment (ROI). Overall ROI analysis leads to generally positive but wildly diverging outcomes, with some studies showing 1:1 or 2:1 returns on federal investments; others showing returns of 20:1 or more.
- Intermediate outcomes. Earlier studies were more likely to focus on intermediate outcomes such as client action following center recommendations. They tended to find that clients did pursue related actions.
Like some other government support programs focused on small firms, results are highly skewed, with a few projects providing most of the value added.
Researchers identified some significant issues with the MEP survey:
- Methodologies required by MEP for firms to calculate value added are quite complex and may lead to undervaluation of outcomes.
- Incentives from MEP for survey completion and for positive results reported through the survey likely provide strong incentives for center staff to encourage the most positive view possible of firm results.
Limited research has been conducted on the differentiation within the program. What there is indicates that centers can be differentiated across a range of variables, including geography, service mix, client mix, organization structure, and size.
Next generation services have been subject to only limited evaluation and assessment:
- Growth-oriented services were subject only to initial evaluation. It appears that no external assessment exists for the fully implemented program.
- Similarly, no assessment exists of other aspects of the new strategy, green manufacturing, and supply chain integration and export-led growth.
There does not appear to have been a significant review of program management since NAPA (2004).


