4
THE EMPIRICALLY BASED PHYSICIAN STAFFING MODELS
The underlying premise of this chapter is that empirical observations on the current practice of medicine in the VA can be useful in helping to determine how many physicians the VA should have in order to meet its patient care and physician training commitments.
The basic idea is that statistical models can be developed describing the relationships between patient care workload, physician Full-Time-Equivalent Employees (FTEE) (by specialty and including residents), and other productivity-influencing factors. With data drawn from the current system, these models can be empirically estimated, i.e., their unknown parameters are assigned specific values. From these estimated models, predictions can be derived about the amount of physician FTEE required to meet projected future workload levels. Such analyses can be performed on a specialty-specific basis and at different levels of aggregation—from the hospital-ward level all the way to derivation of national estimates. These statistical models are grounded in the current practice of medicine in the VA and provide a base against which expert judgment models can be evaluated.
Two alternative, yet complementary, variants of what the committee has termed the Empirically Based Physician Staffing Models (EBPSM) will be presented and analyzed in some detail in this chapter. A quick overview follows.
In the production function (PF) variant of the EBPSM, the rate of production of patient workload (e.g., bed-days of care) for a given patient care area (PCA) (e.g., the medicine bed service) at a VA medical center (VAMC) is hypothesized to be related to such factors as physician FTEE allocated expressly to patient care in that PCA; the number of residents, by postgraduate year, assigned to that PCA; nurse FTEE per physician FTEE there; support-staff FTEE per physician FTEE there; and other variables possibly associated with physician productivity in that PCA (e.g., the VAMC's affiliation status).
Each VAMC is divided into 14 or fewer (depending on the scope of services offered) PCAs: inpatient care—medicine, surgery, psychiatry, neurology, rehabilitation medicine, and spinal cord injury; ambulatory care—medicine, surgery, psychiatry, neurology, rehabilitation medicine, and other physician
services (including emergency care and admitting & screening); and long-term care—nursing home and intermediate care.
A PF is estimated statistically for each PCA. To derive the total physician FTEE in a given specialty (e.g., neurology) or program area (e.g., ambulatory care) required for patient care at a given VAMC, one must solve for the FTEE required to meet patient workload on each relevant PCA, then sum across PCAs.
In the inverse production function (IPF) variant of the EBPSM, specialty-specific rather than PCA-specific models are estimated. For a given specialty (e.g., neurology), the quantity of physician FTEE devoted to patient care and resident education across all PCAs at the VAMC is hypothesized to be a function of such factors as total inpatient workload associated with that specialty (e.g., total bed-days of care for patients assigned a neurology-associated diagnosis-related group); total ambulatory care workload associated with the specialty; total long-term care workload associated with the specialty; the number of residents in that specialty at the VAMC, by postgraduate year; and other variables possibly associated with physician time devoted to patient care and resident education.
There are separate facility-level IPFs for each of the following 11 specialty groups: medicine, surgery, psychiatry, neurology, rehabilitation medicine, anesthesiology, laboratory medicine, diagnostic radiology, nuclear medicine, radiation oncology, and spinal cord injury. (Included in this latter group are physicians in any specialty who are assigned to the spinal cord injury "cost center" in the VA personnel data system.)
For each specialty, to derive the total number of physicians required for patient care and resident education on the PCAs, one must substitute the appropriate values of workload, resident FTEE, and other control variables into that specialty's IPF, then solve directly for the corresponding physician FTEE level. The statistical confidence limits on the prediction also can be computed directly (which is not possible for the PF-based FTEE estimate, as will be seen).
Both the PF and the IPF deal with only a portion of total physician FTEE at the VAMC, albeit a very important and quantitatively significant portion in each case. The fraction of physician FTEE allocated to patient care only—the focus of the PF variant—will vary by specialty and facility, of course, but it rarely falls below 65 percent and generally lies in the 70-95 percent range (see Table 9.1 in chapter 9). The sum of FTEE devoted to patient care and resident education—the focus of the IPF variant—generally lies in the 80-95 percent range. (The rationale for including both patient care and resident education in the IPF and only patient care in the PF is discussed in the section on Formal Presentation of the EBPSM.)
It follows that, under either the PF or IPF variant, total FTEE required at the facility is the sum of the model-derived estimate plus separate estimates for FTEE components not incorporated in the model. Included in the latter would be FTEE for research, continuing education, and other miscellaneous assignments. The process of deriving total physician FTEE for a given specialty
or program area at a VAMC is illustrated below in the section "Using VA Data to Assign Values to Variables."
This chapter is organized as follows: Simplified versions of both the PF and the IPF are presented to explain the intuition behind the workings of both models. The models are then formally stated, and the data used for defining the variables in each model are discussed. Estimated PF models for all 14 PCAs and IPF models for all 11 specialties are reported, with several equations singled out for additional analysis.
Then, the estimated IPF is applied to compare the model-derived physician FTEE level at a given facility in FY 1989 with the actual FTEE found there in that specialty. A similar analysis is performed using the estimated PF equations. Then, for selected PF equations, the model-derived workload at a given facility in FY 1989 is compared with the actual workload generated there. These calculations are performed for four actual (though unidentified) VAMCs. The estimated PF and IPF models are used, alternatively, as the centerpieces of an algorithm to derive facility-specific physician requirements for two selected future years, 2000 and 2005. For illustration, the analyses focus again on the same four VAMCs. In the final section, the committee presents recommendations for future data gathering and statistical analyses by the VA, aimed at improving the models.
Overseeing the development of both variants of the EBPSM was the committee's data and methodology panel, which worked closely with the study's staff and statistical consultants.
HOW THE EMPIRICALLY BASED MODELS WORK
The purpose of this section is to give the statistically oriented, but time-limited reader a basic understanding of the PF and the IPF variants of the EBPSM.
Throughout this section, simplifications are made in two respects. First, the hypothetical statistical models constructed below are smaller and generally simpler than the PF and the IPF equations presented in the next two sections. Second, our interpretations of statistical concepts are somewhat informal and intuitive; at various points, the reader is referred elsewhere for a more rigorous statement of definition or principle.
Nonetheless, most of the methodological issues arising in the larger equations, whether regarding model specification or statistical interpretation, can be well illustrated through the simpler equations.
PF and IPF variants are now considered, in turn, with some concentration on the former to introduce statistical concepts; the choice between the PF and the IPF for this purpose was entirely arbitrary and not intended to suggest a prior preference for one variant over the other.
Anatomy of the PF Variant
In building and testing a statistical model of a behavioral relationship, several steps are involved.
-
A prior hypothesis is formed about the nature of the behavioral relationship—a process frequently inspired by a formal knowledge of, or general ''feel'' for, the relevant data.
-
The hypothesis is transformed into a model, which requires both selecting and operationally defining the model's variables, and choosing the model's functional form—that is, a mathematical statement about the way the variables are thought to interact. A model will have one or more parameters; once these are determined, the model is fully determined.
-
With the available data, empirical values are assigned to all variables in the model.
-
Statistical techniques are used to estimate the model's parameters.
-
Both the statistical strength and the theoretical plausibility of the parameter estimates, and of the model as a whole, are noted and a decision is made as to whether to accept the present model as the best available or to continue searching for a better one. Such a search could involve developing new data, specifying additional variables, or trying different functional forms.
For simplicity, in the PF models discussed below, no distinction is made between PCAs or specialties, and the variables are not defined with the specificity required in later sections.
Suppose the prior hypothesis is that the rate of production of patient care workload is positively related to the quantity of physician FTEE, and not related systematically to any other factor.
The choice of variables for the corresponding model is clear: workload (W) and physician FTEE (Phys). A functional form must be selected; in the absence of additional information, the simplest choice is a linear relationship. Thus,
where b0 and b1 are the parameters to be estimated, and ERROR is a random error term that reflects the net influence of all factors not included in the model. It is a feature of all regression models.
The equation says that workload is a function of one systematic influence—physician FTEE—and a large number of nonsystematic, random influences whose net effect is captured by ERROR. Necessary conditions for Equation 4.1 to be a valid model are that its systematic part be correctly
specified, with both Phys (the independent variable) and ERROR meeting certain well-defined conditions.1
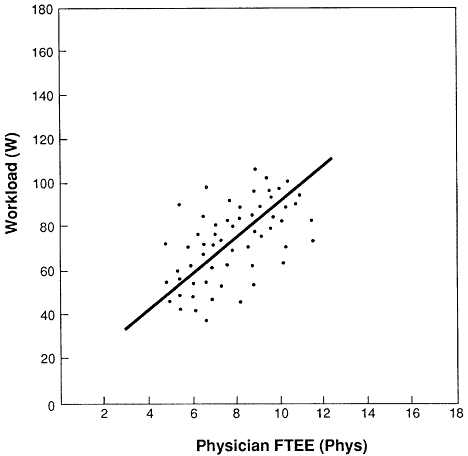
Suppose there are paired observations on W and Phys from a sufficiently large number of VAMCs.2 Given Equation 4.1, the aim now is to use these data to determine the best-fit linear relationship between W and Phys. The standard statistical technique for doing this is the least-squares method.3 This can be assumed to lead to the following estimated model, with its accompanying indicators of statistical goodness of fit:
where b0 and b1 have been replaced by their estimated values, 3.41 is the t-statistic indicating the statistical strength of the estimated coefficient above it, and ![]() is an overall measure of the equation's goodness of fit. The sample size (N) of VAMC PCAs used in estimating the equation is often displayed as well; for the PF equations presented later in this chapter, N varies from about 80 to 160 depending on the type of PCA. This equation, and the hypothetical data points "used" in estimating it, are pictured symbolically in Figure 4.1.
is an overall measure of the equation's goodness of fit. The sample size (N) of VAMC PCAs used in estimating the equation is often displayed as well; for the PF equations presented later in this chapter, N varies from about 80 to 160 depending on the type of PCA. This equation, and the hypothetical data points "used" in estimating it, are pictured symbolically in Figure 4.1.
|
1 |
Basically, it is required that ERROR be a normally distributed random variable, with a mean of zero and a variance that is constant; this implies that the variance cannot vary with either W (the dependent variable), or Phys (the independent variable). (ERROR is normally distributed with these properties if, and only if, the dependent variable W is normally distributed with constant mean and variance.) It is also required that Phys be nonprobabilistic (nonstochastic), that not all Phys values in the sample are the same, and that Phys does not grow or decline in value without limit as the sample size grows (without limit). For models with more than one independent variable, i.e., multivariate models, it is also required that there be no perfectly linear relationship between any two variables (in fact, among any subset of independent variables). For a detailed discussion of these conditions, see Kmenta (1986). |
|
2 |
Strictly speaking, the number of observations must only exceed the number of parameters being estimated by one. But for stable estimates, a larger sample size than this is required. For a univariate model such as Equation 4.1, analysts typically want at least 20 data points. The larger the number of independent variables, the larger the sample size usually required (Kmenta, 1986). |
|
3 |
The best-fit model under the least-squares method has the following defining property: It minimizes the sum of the squared deviations between the actual values of W and the corresponding model-predicted values of this dependent variable. To explore this, refer to Figure 4.1. For the ith value of physician time (Phys,), there is a paired observation on workload (W1), and a model-predicted workload value |
Of the two estimated coefficients, the more important by far is ![]() Given the positive algebraic sign on this estimate, it can be interpreted as follows: for a small increment (decrement) in physician FTEE (ΔPhys), workload can be expected to increase (decrease) by (8.42 × ΔPhys). That is, (8.42 × ΔPhys) = ΔW, which implies that (Δw/ΔPhys) = 8.42 is the slope of the PF in Figure 4.1. For example, if W was defined in terms of patient days generated per day in the PCA, the addition of one full-time physician is expected to increase workload production by 8.42 patient days per day.
Given the positive algebraic sign on this estimate, it can be interpreted as follows: for a small increment (decrement) in physician FTEE (ΔPhys), workload can be expected to increase (decrease) by (8.42 × ΔPhys). That is, (8.42 × ΔPhys) = ΔW, which implies that (Δw/ΔPhys) = 8.42 is the slope of the PF in Figure 4.1. For example, if W was defined in terms of patient days generated per day in the PCA, the addition of one full-time physician is expected to increase workload production by 8.42 patient days per day.
Thus, 8.42 can be viewed as the productivity multiplier that transforms changes in physician FTEE into changes in the rate of workload production. It can be shown that as ΔPhys decreases (in absolute value) and as these physician FTEE levels more closely approach the sample mean of Phys, the statistical reliability of this multiplier increases.
Roughly speaking, the larger the t-statistic in absolute value, the greater the statistical strength of the estimated coefficient; the absolute-value proviso is required since t and the estimated coefficient take on the same sign, which can be negative. A common rule of thumb is that an estimate is significant if its t-statistic is about 2.00 or greater in absolute value. However, there is no unconditional rule for determining how large t must be for the estimate to be declared statistically significant. Under common rules of thumb, t-statistics ranging from about 1.7 to 2.6 (in absolute value) may be taken to indicate that the associated coefficient estimate is statistically significant.4
The overall goodness-of-fit measure ![]() is a statistic, taking on values between 0 and 1, indicating the fraction of the total variation in the dependent variable
is a statistic, taking on values between 0 and 1, indicating the fraction of the total variation in the dependent variable
that can be "explained" by variation in the independent variable(s). 5 The larger the ![]() is, the better is the equation's fit of the data. A value of 1.00 would indicate that the model accounts perfectly for variations in the dependent variable; in this case, all data points would fall on the estimated line. In Equation 4.1', the variation in Phys is found to explain 72 percent of the variation in W.
is, the better is the equation's fit of the data. A value of 1.00 would indicate that the model accounts perfectly for variations in the dependent variable; in this case, all data points would fall on the estimated line. In Equation 4.1', the variation in Phys is found to explain 72 percent of the variation in W.
Although no estimate for ERROR is shown, "observations" on this random component are also generated and play an important role in assessing whether the assumptions made about ERROR (see footnote 3) appear to hold (see "Estimated PF and IPF Equations," below). For the ith physician FTEE value, there is a corresponding Wi and a model-predicted ![]() . The difference between these two is termed the ith residual. Taken together, these residuals can be regarded as observations generated from the random variable, ERROR. If the assumptions about ERROR hold, these residuals should have a random appearance, that is, no discernible patterns or trends.
. The difference between these two is termed the ith residual. Taken together, these residuals can be regarded as observations generated from the random variable, ERROR. If the assumptions about ERROR hold, these residuals should have a random appearance, that is, no discernible patterns or trends.
Of obvious importance is that Equation 4.1' can be used to derive physician requirements for patient care at a given VAMC. If a projected workload for the VAMC of 100 units per time period is substituted into the equation, such that
then
Next, some PF alternatives to Equations 4.1 and 4.1' are considered. These would be motivated in each case by data points that appear differently configured than those in Figure 4.1.
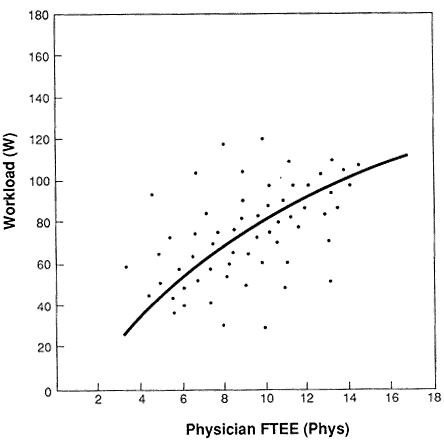
Suppose that there is an evident nonlinear relationship between physician FTEE and workload—in particular, that W rises with increases in Phys, but at a decreasing rate. This case of "diminishing marginal productivity" of physician
time is shown in Figure 4.2. A possible (though again hypothetical) estimated regression equation corresponding to this result is
where the nonlinear relationship is modeled as a quadratic equation in which W reaches a maximum for some Phys value, then diminishes absolutely beyond that.
In geometric terms, the function pictured is an inverted parabola, with only the rising portion of the curve relevant to the data likely generated in the "real world" practice of medicine. That is, for sufficiently large values of Phys (not shown in Figure 4.2), the equation would indicate that workload declines with increases in physician FTEE.
As portrayed, the coefficient estimates for both the linear and the quadratic terms are statistically significant. If, on the other hand, the estimate for Phys had been significant whereas the estimate for Phys2 had not been, the hypothesis of a linear relationship would have been sustained.
The derivation of physician requirements from Equation 4.2 is illustrated by again setting W = 100 and solving the resulting quadratic relationship; the clinically relevant solution is Phys = 14.30.
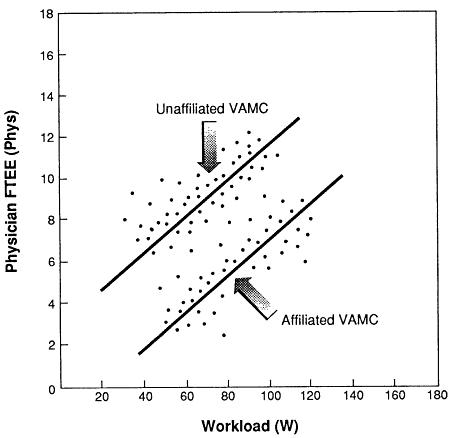
Next, a multivariate regression model is considered, in which the rate of workload production depends on more than physician FTEE, for example, also on whether the VAMC is affiliated with one or more non-VA health care institutions. To accommodate this analysis, a data set enlarged to include a variable labeled "Affil" is required. If a VAMC is affiliated, Affil = 1; otherwise, Affil = 0. (That there may be different degrees of affiliation is thus ignored here.)
The use of such categorical (or dummy) variables is quite common in regression analysis. As can be seen in the following three sections, multivariate models can include any combination of continuous variables (such as Phys) and categorical variables.
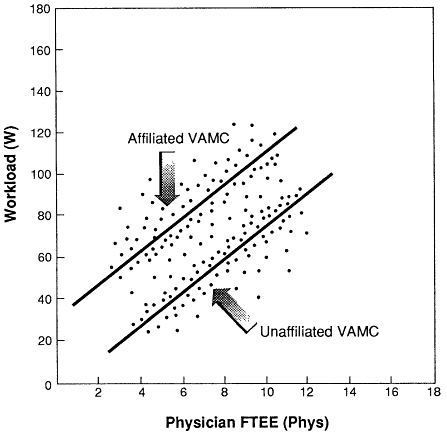
The simplest hypothesis here, portrayed in Figure 4.3, is that affiliated and unaffiliated VAMCs have PFs that differ only by a parallel shift; that is, for any value of Phys, the difference between the workload rates at the two types of VAMCs is a constant; the physician productivity multiplier (the slope) is the same in both cases. Thus, it is posited that there is something about being affiliated that raises, or lowers, a VAMC's overall productivity, but does not affect the marginal effect of physicians on workload.
A hypothetical equation that, in conjunction with Figure 4.3, portrays these assumptions is
which indicates that affiliated VAMCs are more productive, all else equal. The committee emphasizes that this is merely an illustration with no policy implications intended or possible; how the actual effect of affiliation status on productivity and physician requirements can be inferred is discussed later in the chapter.
The amount of physician FTEE required to meet workload at a VAMC now depends on whether it is affiliated. If Affil = 1 in Equation 4.3, the FTEE required to produce W = 100 is 9.78; if Affil = 0, the required value of Phys is 13.59 FTEE.
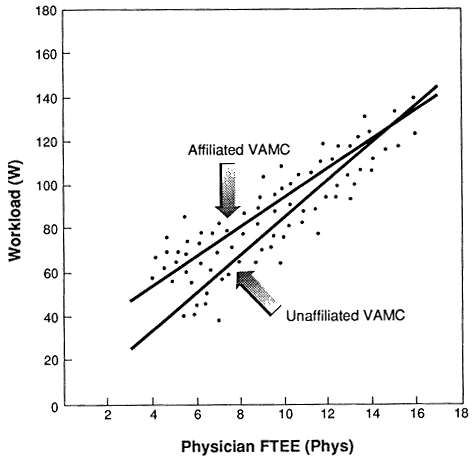
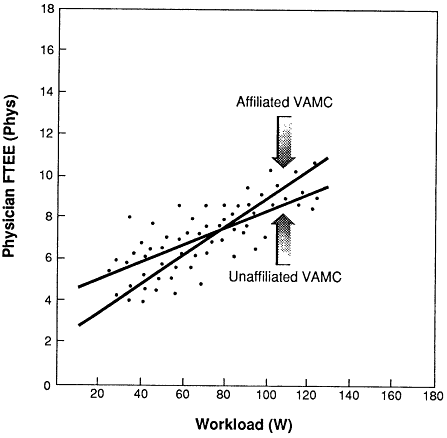
An interesting alternative hypothesis is that affiliation status affects both the VAMC's overall productivity level (for any value of Phys) and the physician productivity multiplier. Such a situation is shown symbolically in Figure 4.4 and reflected in the following (hypothetical) estimated equation:
where the net impact of affiliation on productivity involves the resolution of two effects. Although the direct-effect variable (Affil) is still positive and significant, the interaction-term variable (Phys × Affil) is negative and significant. Regarding the influence of the latter, if a VAMC is unaffiliated, Affil = 0 and thus is also the interaction-term variable; the physician productivity multiplier remains 8.10. But for an affiliated facility, with Affil = 1, the multiplier is effectively reduced to (8.10-1.80) = 6.30.
It can be shown that whether affiliation status is associated with higher productivity on net—that is, whether for a given Phys value, W is greater for an affiliated VAMC—depends here on the absolute level of Phys. This is evident from Figure 4.4.
Based on Equation 4.4, the physician FTEE required to produce W = 100 for an affiliated facility is 10.66, whereas it is 11.86 for an unaffiliated VAMC.
Anatomy of the IPF Variant
The PF and the IPF are potentially complementary constructs. Each yields a well-defined answer to a well-defined question, though not the same question. The PF seeks to identify factors associated with the production of patient workload in each PCA of the VAMC. If a variable does not make an independent contribution to explaining overall productivity, it will not merit inclusion in the PF, at least by conventional statistical criteria.
For each specialty, the IPF seeks to identify factors associated with the total amount of physician FTEE devoted to patient care and resident education across all PCAs at the VAMC. The volume of patient workload at the facility, especially on PCAs where the specialty is active, is a likely explanatory factor. But it need not be the only such factor; and if it happened not to be statistically significant, the IPF might still prescribe a positive amount of physician FTEE for the VAMC.
Two related features of the IPF become evident in later sections. First, compared with the PF variant, deriving physician requirements through the IPF is computationally more straightforward. Second, statements of statistical confidence, often summarized in terms of "prediction intervals,' can be computed around the IPF's best estimate of physician requirements; this is not possible with the PF, which permits instead the computation of prediction intervals around the level of workload that a given physician FTEE level (in conjunction with other factors) is expected to produce.
The following simplified and hypothetical IPF specifications are structurally so similar to the PF equations above that the presentation can be relatively compact.
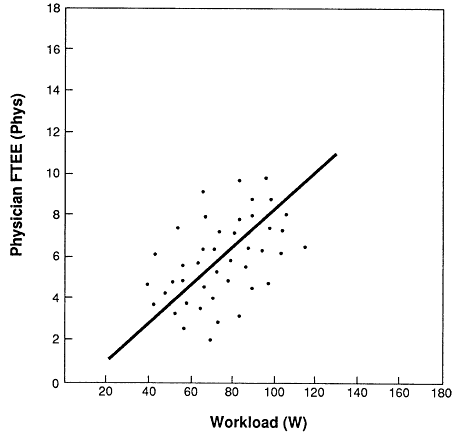
The simple hypothesis that physician FTEE is linearly related to workload is depicted in Figure 4.5 and by the estimated equation
which can be compared with Equation 4.1' to make an important point: Regression theory does not permit one to derive one estimated equation from the other by simple algebraic manipulation. That is, if one solves Equation 4.1' for Phys in terms of W, the result is not Equation 4.5 (Kmenta, 1986).
Equation 4.5 serves to reemphasize another point: Drawing inferences from a regression can be precarious for independent-variable values lying far outside the sample range. A negative quantity of physician FTEE is predicted for values of W less than 9.3, but is of no practical relevance if workload observations in the sample—all in the range, say, of 60 through 110—are representative of VAMC workload levels generally.
From Equation 4.5, the quantity of physician FTEE required for patient care and resident education at a VAMC for which W = 100 is equal to -0.84 + 0.09(100) = 8.16.
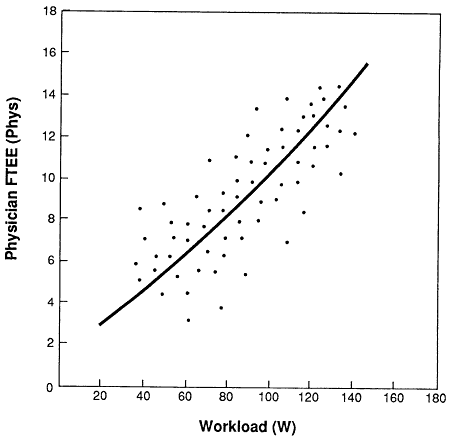
An alternative hypothesis—that as workload increases, physician FTEE requirements increase at an increasing rate—is illustrated in Figure 4.6 and in the following hypothetical estimated equation:
On the other hand, the hypothesis of a linear relationship would have been sustained had the estimated coefficient of W2 not been statistically significant.
If projected workload at a VAMC is again 100 units, Equation 4.6 implies that the physician FTEE required for patient care and resident education is 10.34.
The (illustrative) hypothesis that less physician time is required in response to any given workload level in an affiliated VAMC, compared with an unaffiliated facility, is depicted in Figure 4.7 and in the following equation:
where the marginal (incremental) relationship between workload and physician FTEE, as captured in the estimated coefficient on W, is assumed to be the same for both types of facilities.
To produce workload at a rate of W = 100, an affiliated VAMC would require 6.68 physician FTEE, according to Equation 4.7, whereas an unaffiliated VAMC would require 11.48 FTEE.
An IPF specification that depicts, hypothetically, the results from testing this assumption directly is shown in Figure 4.8 and in the following equation:
This equation implies that in an affiliated VAMC the marginal effect of small changes in workload on physician requirements (for patient care and resident education) is transmitted through a multiplier of 0.045. But if a facility is affiliated, so that Affil = 1, the multiplier becomes (0.045 + 0.025) = 0.07, which implies lower efficiency on the margin. As with Equation 4.4, whether an affiliated VAMC is more, or less, productive overall than an unaffiliated VAMC will depend on the net effect of the direct-effect and interaction terms, in concert, and hence will depend on the value of W at which the assessment is made.
Using W = 100, it can be found from Equation 4.8 that an affiliated facility requires 8.35 physician FTEE, whereas the requirement in an unaffiliated VAMC is 7.29.
Implicitly assumed in all of these examples is that the quality of care, however defined, does not vary significantly across the sample—that is, units of W are of comparable quality across VAMCs and for all rates of production. In addition, if these estimated models are to be used prescriptively to derive physician requirements consistent with high-quality care, it is necessary that paired sample observations on W and Phys reflect the delivery of high-quality
care (or else that adjustments be made, perhaps statistically, to attempt to compensate for the assumption not being met).
In subsequent sections, these assumptions, which are important not only in the present study but in all manpower planning analysis, are discussed. However, rarely have such analyses confronted the quality question explicitly and rarely have practical solutions been suggested for dealing with it. Clearly, it represents a major challenge.
FORMAL PRESENTATION OF THE EBPSM
In this section, the general forms of the PF and the IPF variants of the EBPSM are presented. The focus is primarily on behavioral assumptions, with their statistical implications, and the selection and operational definition of variables.
The discussion represents a natural extension of the ideas in the preceding section, with larger, more realistic specifications of the PF and the IPF replacing the simplistic equations there. The statistical modeling points covered in the preceding section apply throughout this chapter and will be restated only when they illuminate the current discussion. Again, the presentation is built around one model variant, and then (once the notation and definitions are established) the presentation proceeds more rapidly through the second. The decision to examine the PF first does not itself imply any committee preference between the two variants.
Production Function
A PF approach to determining VA physician requirements for patient care rests on the following related ideas. The rate at which a VAMC "produces" patient care in a given domain (i.e., a PCA) depends on how it chooses to combine a number of inputs, including staff physicians, residents, nurses, support staff, and nonpersonnel factors such as supplies and capital equipment. In fact, there may be alternative combinations of these inputs capable of producing workload at the same rate (and quality-of-care level).
Hence, to derive the quantity of staff physician FTEE required in a given setting, one must know or have estimates of the PF itself, the workload to be produced, and some rule (or algorithm) for jointly selecting the desired combination of physician and nonphysician inputs.
There is a substantial literature in economics on PF specification and estimation, with notable applications to hospital care (Jensen and Morrisey, 1986a,b; Pauly, 1980; Feldstein, 1967), physician services (Reinhardt, 1975), and dentistry (Scheffler, 1981; Kushman et al., 1979; Scheffler and Kushman,
1977; Maurizi, 1969). Those applications and the PFs specified in this study are broadly similar in that output (workload) is related to inputs, while controlling for factors (e.g., age of practitioner or, in this case, VAMC affiliation status) that may impinge on the productivity of one or more inputs.
But the PF equations developed here do differ from earlier ones in some respects:
-
One distinction is that these PF models are estimated by PCA, whereas the hospital studies cited are all facility-specific and the ambulatory care-oriented studies are all practice-level (or firm-level) specific. Hence, the PF models here arguably offer a better vehicle to control for case-mix variations than these more highly aggregated production models; those studies above that did attempt to adjust for case mix had to employ relatively indirect approaches (e.g., Feldstein's use of a case-proportions vector as a control-variable device).
-
A more fundamental distinction, however, concerns the structure of incentives and resulting implications for organizational behavior. Specifically, all of the earlier analyses were set in the private sector, and cost minimization was assumed (sometimes implicitly) to be a necessary condition for the provider organization to achieve its goal (which typically was profit maximization). This, in turn, implies the assumption that the organization being modeled is operating at maximum production efficiency; given whatever level of inputs is chosen (for economic reasons), the resulting output rate is the maximum attainable. And, in theory, the input and output rates are jointly determined.
It can be shown that these assumptions, taken together, have troubling implications for the estimation of PFs of the type represented in Equations 4.1' through 4.4 by the traditional least-squares method.6
On the other hand, a VAMC is a public-sector organization charged with a multi-objective mission, but maximizing profits is not one of them. Rather, it is assumed that each VAMC attempts to meet its patient care mission in a way that balances several concerns: that eligible veterans are treated in a timely
manner; that the quality of care be acceptable; and that budget, other resource, and administrative constraints be met. Consistent with this, it is assumed for the PF analysis that a VAMC adjusts inputs and workload in a step-sequence process: Subject to resource and budget availability, the VAMC sets input levels for each fiscal year in accordance with projected workload. Then, in the course of the year, it attempts to modulate (up or down) the rate of workload so that a clinically acceptable relationship is maintained between workload and inputs. The net result is that certain problems of bias and inefficiency that threaten PF estimates from the for-profit sector should not be similarly expected here.7
• For several technical and economic theory reasons, all the PF analyses cited earlier except those by Jensen and Morrisey (1986a,b) found it useful to impose certain a priori restrictions on the functional (or mathematical) relationship among inputs. This usually serves to simplify the examination of such technical issues as the relative substitutability among inputs and whether or not there are scale economies in production.
Like Jensen and Morrisey, however, the committee elected not to impose arbitrary mathematical restrictions on the form of the PF. Rather, the approach here is to choose the functional representation of the variables yielding the best-fit, clinically sensible relationship between workload and the factors that produce it. The estimated models presented in this chapter have what Jensen and Morrisey term a ''flexible functional form,'' which allows exploration of the usual technical questions with few mathematical restrictions.
|
7 |
In the language of microeconomics, these behavioral assumptions are consistent with either of the following alternative, and more rigorous, characterizations of the VAMC's "objective function": (1) that the facility attempts to maximize the quality-of-care, subject to the constraints that (a) all of the presenting eligible workload must be treated and (b) budgets must not be exceeded; or (2) that the facility attempts to minimize the cost of providing care, subject to the constraints that (a) all of the presenting eligible workload must be treated and (b) inputs are used at levels associated with achieving (or exceeding) minimum quality-of-care standards. In fact, this second characterization is explored experimentally in chapter 7 in the subsection entitled, "Choosing an Optimal Specialty Mix of VA Physicians Through Linear Programming." Although there is an expectation that VAMCs will produce patient care services with high technical efficiency, the incentives to do so may be weaker than in the private sector (though they have been strengthened in recent years). A recent application of data envelopment analysis indicated that about one-third of all VAMCs were not delivering patient care with maximum cost-efficiency (Sexton et al., 1989). Although a substantial part of this variability may be attributable to differences across VAMCs in the commitment to teaching and research (which affects the relative amount of staff physician time available for patient care), the end result is the following: in a given sample of VAMCs, variation can be expected in the efficiency with which inputs are transformed into output. Even if this study's PFs were to include variables to control for differences in teaching and research, considerable variability still could be expected across VAMCs in the rate of workload, given any fixed set of input levels. |
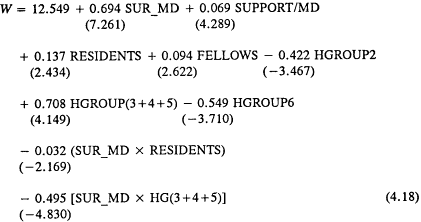
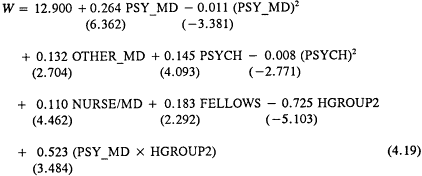
The PF variant of the EBPSM is presented below in the general form endorsed by the committee. For some of the variables, data are not available presently on a systemwide basis, and they could not be tested for inclusion in the models. Still, as a basis for comparison and a guide for future work, the complete model is:

where
|
Wij |
= |
the annual rate of production of workload in PCA j of VAMC i; |
|
{Staffphysij} |
= |
a set of variables, each of which takes the form Staffphysijk = the amount of FTEE allocated to direct patient care in PCA j of VAMC i for staff physicians based in cost center k, where each k corresponds to one of the 11 specialty groups examined here in detail; |
|
{ConPhysij} |
= |
a set of variables for physicians under contract to VAMC i, such that ConPhysijk = the contract physician FTEE from specialty k devoted to PCA j; |
|
{Resij} |
= |
a set of variables to account for the net productive contribution of residents, with each variable of the form Resijy = the amount of postgraduate year y resident FTEE allocated to PCA j at VAMC i; |
|
C&Aij |
= |
for non-VA physicians who perform consulting and attending duties on a fee-for-visit basis, the amount of FTEE allocated to PCA j at VAMC i; |
|
WOCij |
= |
for non-VA physicians who perform consulting and attending duties without (monetary) compensation, the amount of FTEE allocated to PCA j at VAMC i; |
|
{NPPij} |
= |
a set of variables, each of the form NPPijm = the amount of FTEE of nonphysician practitioner type m (e.g., physician assistant) assigned to PCA j at VAMC i; |
|
Nurseij |
= |
the amount of nursing service FTEE allocated to PCA j at VAMC i; |
|
Supportij |
= |
for all personnel categories excluding physicians and nurses (and, as appropriate, also excluding psychologists and social workers), the total FTEE allocated to PCA j at VAMC i; |
|
Prodfactij |
= |
one or more variables for factors (e.g., capital equipment) influencing the productive efficiency of physicians and other providers in PCA j at VAMC i; |
|
ERRORij |
= |
the random-error term for PCA j at VAMC i, assumed to obey the assumptions discussed in the preceding section and footnote 1. |
In the section musing VA Data to Assign Values to Variables,' how each of these variables is operationally defined is discussed.
Each VAMC will have up to 14 distinct PCAs, including six inpatient, six ambulatory, and two long-term care.
Inverse Production Function
Several questions about the IPF naturally arise. How does it differ from the PF? What behavioral assumptions underlie the IPF, and what do these imply about the statistical specification of the IPF? Why pursue both the PF and the IPF? These questions are considered in turn.
In the PF variant, the basic question is: What factors account for the production of patient care workload? In the IPF, the basic question is: What factors account for the observed level of staff physician FTEE?
The IPF's underlying assumption is that the amount of physician FTEE from a given specialty required for patient care and resident education is a function of the volume of patient care workload to be produced, the number of residents to be taught on the PCAs, and possibly other factors influencing the relationship between workload, resident education, and staff physician requirements.
From a cause-and-effect standpoint, the basic behavioral assumption in the IPF variant (in contrast with the PF) is that the VAMC adjusts physician FTEE levels in response to a given projected workload level, controlling for other factors. Thus, the volume of workload per time period cannot be significantly
modulated (i.e., it is "exogenously" determined by demand-influencing factors beyond the VAMC's control). 8
In concept, an IPF can be estimated for each specialty-PCA combination (e.g., for neurology requirements on the inpatient medicine PCA), or for each specialty on a facility-total basis by aggregating across PCAs (e.g., for neurology requirements for all 14 PCAs combined). However, efforts to estimate PCA-specific IPFs for each specialty produced equations frequently exhibiting poor goodness of fit and coefficient estimates whose algebraic signs were counterintuitive. Hence, the focus in this study is exclusively on facility-level IPFs, whose aggregated FTEE observations yield more reliable estimates.
Both the PF and the IPF are pursued because each variant has its strengths and drawbacks, conceptually and statistically, and because together they can play complementary roles in helping the VA decision maker determine appropriate staffing. The first point becomes increasingly evident in subsequent sections. The second point is examined specifically in the section, "Estimated PF and IPF Equations," through a demonstration application; it is further evaluated in chapters 7 and 11.
The general form of the IPF variant of the EBPSM is:
where
|
StaffPhys'ik |
= |
across all PCAs at VAMC i, the total amount of specialty k staff physician and contract physician FTEE devoted to patient care and resident education; |
|
{Wik} |
= |
a set of workload variables, each of the form Wijk = the level of workload on PCA j of VAMC i associated with specialty k; |
|
{Resik} |
= |
a set of variables, each of the form Resiky = the amount of postgraduate year y resident FTEE at VAMC i in specialty k; |
|
{NPPik} |
= |
a set of variables, each of the form NPPikm = the amount of FTEE of nonphysician practitioner type m associated with the PCA-related activities of physicians in specialty k at VAMC i; |
|
Prodfactik |
= |
one or more variables for factors influencing the productive efficiency of specialty k physicians at VAMC i; |
|
ERRORik |
= |
the random-error term for specialty k at VAMC i. |
Originally, the general specification of the IPF also included variables for nurse and support staff. But after a number of statistical analyses, it became clear that the physician-substitutive role these providers are hypothesized to play could not be modeled adequately at the facility level. Rather, the PCA is the more appropriate level of aggregation for studying these relationships in the production of workload.
One additional distinction between the IPF and the PF lies in the scope of what is included in the physician FTEE variable. In the IPF, an attempt is made to account for all physician FTEE devoted to VA mission-related activities across PCAs. Patient care and resident education typically dominate these activities. (Because the PCA-related part of research FTEE cannot be separated from total research FTEE in the current data systems and because most research occurs off the PCAs, research is excluded from the IPF equation; to derive total physician FTEE through an IPF (or a PF) approach, research FTEE must be incorporated in a separate step.) Hence, the dependent variable in Equation 4.10 incorporates all patient-care-designated FTEE (including physicians under contract) plus FTEE allocated to resident instruction.
Since the PF attempts to account for the distinct factors involved in producing workload, it is the workload-producing component of physician FTEE—namely, the part allocated to direct care in the data system—that is the most appropriate basis for defining the variable StaffPhys in Equation 4.9. Some early versions of the PF in which StaffPhys was defined as the sum of FTEE for patient care and resident education did not perform as well statistically as similar specifications with StaffPhys based on patient care FTEE only. (This may have been due to multicollinearity induced by a positive correlation between physician FTEE for resident education and the RES variables.) Moreover, when the direct-care and resident-education parts of physician FTEE were run as separate variables in PF equations for various PCAs, the former was invariably significant and the latter was almost never significant. In fact, the same was also true in all PF equations where staff physician FTEE for direct-care and contract-physician FTEE (ConPhys) variables were entered together. Hence, in the PF models presented below, StaffPhys always appears in some form, whereas neither ConPhys nor a variable for FTEE devoted to resident education merits entry.
USING VA DATA TO ASSIGN VALUES TO VARIABLES
For the PF or the IPF to be implemented, these variants of the EBPSM must in fact be given their empirical base. In this section, the use of VA data to assign values to the variables in Equations 4.9 and 4.10 is described. A number of internally developed VA data sets were employed.
Although the data proved adequate for operationalizing the variables of greatest importance a priori, facility-specific information was not available systemwide on certain others: non-VA consulting physician FTEE, nonphysician practitioner FTEE at the PCA level, and such PCA-specific measures of Prodfact as the volume and mix of capital equipment. These variables are thus omitted from the estimated equations reported in the next section.
In what follows, reference is often made to several components of the VA's national data system, but there is no attempt to provide the VA with a comprehensive overview of its own information sources. Rather, the focus is on aspects pertinent to the construction of the variables.
For reasons discussed below, all variables—and thus all estimated equations—are defined in terms of FY 1989 data.
Workload
It is useful to consider, in turn, each of the three major type-of-care areas: inpatient care, ambulatory care, and long-term care.
Inpatient Care
For the PF variant, six PCAs, corresponding to the six major inpatient bed sections defined within the VA data systems, have been delineated: medicine, surgery, psychiatry, neurology, rehabilitation medicine, and spinal cord injury. For each PCA, we built upon existing VA data analyses to define three alternative workload variables: Discharges/Year, Bed-Days of Care/Year, and an annualized cost-weighted, case-mix-adjusted variable called the Weighted Work Unit (WWU) score.
The data source for all three is the VA Patient Treatment File (PTF), which contains a hospital discharge abstract on every patient discharged from a VA facility (or from a non-VA facility where the VA was the payer). Each abstract contains sufficient information to assign the patient's discharge to a primary bed section, and hence PCA, and to allocate the patient's total bed-days for each stay to the PCA(s) where treatment was rendered.
Suppose, for example, a patient spent the first five days on a medicine ward, the next seven days on a surgery ward, six additional days on a medicine ward,
and then was discharged. As a result, a total of 11 bed-days would be assigned to the inpatient medicine PCA, seven bed-days to the inpatient surgery PCA, and one discharge to the inpatient medicine PCA.
The assignment of WWU scores to patients is more complex and is best illustrated by a pair of examples:
-
Suppose a patient is admitted to the medicine service, stays six days, and then is discharged from the facility. On the basis of the patient's primary diagnosis and other information in the PTF, the stay is assigned a diagnosis-related group (DRG) category. This category will already have associated with it a weight based on the VA national average direct cost of treating patients in this DRG relative to all other DRGs. If the patient's length of stay (in this case, six days) happens to be neither exceptionally short nor long for this DRG, this cost weight (after being normalized) becomes the patient's WWU score. For purposes of this study, it is assigned to the facility's inpatient medicine PCA and becomes one small piece of this VAMC's cumulative annual "medicine WWU" score. For very short stays (typically below the 2nd percentile), a smaller weight than this would be assigned; for stays beyond the 98th percentile, the weight would be increased, though not in proportion to the extra days in the facility. (These percentiles are not theoretically derived, but reflect merely a VA policy decision regarding outliers.)
WWU scores are normalized so that a score of one is assigned to an admission whose direct cost equals the VA national average direct cost for inpatient admissions. These normalized scores range from about 0.17 (nasal trauma and deformity) to about 13.01 (heart transplant) per admission.
Most VA inpatient stays do involve only one bed section, and thus PCA; but when this is not the case, the accounting becomes more intricate.
-
Consider again the patient who was admitted to the medicine service, then transferred to surgery, then transferred back to medicine, then discharged from the facility. Suppose, as is sometimes the case, the patient's primary diagnosis changes upon each transfer. Then, the following workload data are generated: the patient's first, five-day stay in medicine is assigned a DRG, and thus a medicine WWU score; the seven-day stay in surgery gets a DRG and a surgery WWU score; and the six-day transfer back to medicine is assigned a DRG and a medicine WWU score.
The sum of the medicine WWU scores is assigned, for purposes here, to the inpatient medicine PCA and becomes part of this facility's cumulative medicine WWU total for the year. Similarly, the surgery score is assigned to the inpatient surgery PCA and adds to the facility's cumulative annual surgery WWU total.
In this way, the "raw materials" are derived for generating observations on Wij in Equation 4.9 and Wijk in Equation 4.10. For the PF equations, workload is defined in terms of the annual sum of all WWU scores linked to PCA j.
However, in each PF equation, the dependent variable actually used was not the workload index itself, but rather the natural logarithm of workload, plus 1. The purpose of this log transformation is to generate a dependent variable that is approximately normally distributed, as required by the assumptions of the least-squares statistical model (see footnote 1).
Let wij be the direct sum of all medicine, surgery, psychiatry, neurology, and rehabilitation medicine WWUs generated in inpatient PCA j of VAMC i. The corresponding dependent variable for j's PF is Wij = In[wij + 1]. [The addition of 1 is required simply to ensure that Wij is well-defined even when wij = 0.]
Regarding the IPF, the workload variables used in the final equations are not, in fact, PCA-specific, but specific rather to the three type-of-care areas—inpatient, ambulatory, and long-term care (LTC). For specialty k's IPF, the relevant notation for workload variables becomes Wi, Inpatient, k' Wi, Ambulatory, k' and Wi, LTC, k'
For each IPF, one must determine which inpatient PCAs are appropriate for computing Wi, Inpatient, k' and likewise for the ambulatory care and long-term care workload variables.
For a specialty such as medicine, which has its own inpatient PCA, inpatient WWU is equivalent simply to the sum of medicine WWU across all inpatient PCAs; this also applies, of course, to the IPF equations for surgery, psychiatry, neurology, and rehabilitation medicine.
For a specialty such as nuclear medicine, which has no direct PCA identification, the PCA scope of the inpatient WWU variable must be defined. In this case, the inpatient WWU variable was constructed as the sum of all medicine, surgery, and neurology WWUs generated in the facility's five inpatient PCAs. Similarly, inpatient WWU definitions were developed for the IPFs estimated for anesthesiology, laboratory medicine, diagnostic radiology, and radiation oncology.
For the spinal cord injury PF, the required PCA-specific WWU score is defined as the sum of all inpatient WWU scores (in medicine, surgery, and so on) linked expressly to the spinal cord injury (SCI) PCA. For the SCI IPF, this same figure is likewise used as the WWU total associated with the specialty of SCI.
Ambulatory Care
The VA Staff Outpatient File contains a number of data items about each ambulatory care visit, including (most important for purposes here) a listing of the clinic stops encountered by the patient. Each clinic stop corresponds to a well-defined site, or locus, of activity—for example, the admitting & screening area, the neurology clinic, or the x-ray station. An ambulatory care visit can be conceptualized as a sequence of clinic-stop visits.
In FY 1989, there were 101 clinic-stop sites. With the assistance of the VA's Boston Development Center, each was mapped into one of six mutually exclusive and exhaustive clinic-stop groups: medicine, surgery, psychiatry, neurology, rehabilitation medicine, and other physician services (which include the emergency unit and admitting & screening). These groups correspond to the six ambulatory care PCAs defined earlier. A patient receiving care at the cardiology clinic stop thus has an encounter in the ambulatory medicine PCA. Clearly, one patient visit may generate encounters with multiple PCAs.
On the basis of the VA's own analyses of these data, four alternative ambulatory care workload measures were defined:
-
Clinic Stops/Year for ambulatory PCA j at VAMC i are computed as the direct sum of all recorded encounters at all clinic stops in that PCA domain during the year. (However, if a patient encounters any clinic stop more than once during a visit to the VAMC, only one encounter for that stop is recorded in the Staff Outpatient File.)
-
People/Year for PCA j is defined as the total number of unique persons (social security numbers) encountering the clinic stops in that PCA's domain during the year. A given patient can be counted more than once. A patient treated at both the emergency unit and the general surgery clinic during the year will make a unit contribution to the numerator of People/Year for both the other physician services and ambulatory surgery PCAs.
-
Patients/Year for PCA j is constructed in a two-step process. First, for each patient having any encounters with the ambulatory care program at VAMC i during the year, the fraction of all clinic stops falling in the domain of PCA j is computed. These fractions are then summed across all patients to obtain Patients/Year for j.
-
The Capitation Weighted Work Unit (CAPWWU) score is a cost-weighted workload measure that does adjust partially for visit-mix differences across PCAs (both within and across facilities). On the basis of his/her pattern of recorded clinic stops at VAMC i, each patient is placed in one of five capitation groups: high-use psychiatric, high-use rehabilitative, high-use medical, mid-use psychiatric, and standard use (comprising all patients not falling in one of the other four). The patient will also fall into one of eight age categories and, hence, into one of 40 (5 × 8) age-capitation group cells. Each cell has a cost weight based on the VA national average ambulatory care cost of patients in that cell relative to the other 39.
The patient is assigned his/her cell's cost weight. In a final step, this weight is allocated fractionally among the ambulatory PCAs at VAMC i in proportion to how the patient's clinic-stop encounters were distributed across these PCAs during the year. For example, if the patient had five clinic stops in the cardiology clinic, five in the hypertension clinic, and 10 in the thoracic surgery clinic (and no other clinic stops), half of his cost weight would be assigned to the
ambulatory medicine PCA and the other half to the ambulatory surgery PCA. In reality, it is frequently the case that patients contribute CAP WU to multiple PCAs during a single visit to the facility.
Whenever any of these measures served as the workload index in a PF, a log transformation was applied in generating dependent-variable values, for reasons discussed above.
Long-Term Care
For patients admitted to an intermediate-care or nursing-home bed, sufficient information is recorded altogether in the VA Patient Treatment File, Extended Patient Treatment File, and Patient Assessment File to permit the calculation of three alternative workload measures:
-
Patients/Year for LTC PCA j (either intermediate care or nursing home) at VAMC i is taken directly from the PTF. This workload variable is defined as the number of unique patients (social security numbers) discharged from PCA j during the fiscal year, plus the additional patients residing there on the last day of the fiscal year.
-
Patient Days/Year for LTC PCA j is also derived directly from the PTF.
-
The Resource Utilization Group Weighted Work Unit (RUGWWU) score is a workload measure that attempts to adjust for LTC treatment cost differences associated with differences in the clinical characteristics and physical and functional status of LTC patients. Using the RUG patient classification model developed for the New York State Medicaid program, the VA assigns each intermediate-care and nursing-home patient to one or more of 16 patient groups. Each patient group has a preassigned RUGWWU score based on the estimated national average resource cost of patients in that group relative to the other 15; the relative intensity of nursing care is the major determinant of estimated cost. If the patient is linked to more than one group (a frequent event), his RUGWWU score for this LTC admission is that associated with the most expensive of the RUGs.
Each LTC discharge at VAMC i generates a RUGWWU score assigned to the appropriate PCA. Again, there are special computational rules for handling LTC patients still occupying a bed on the last day of the fiscal year.
Whenever these measures were used as the workload index in a PF, a natural log transformation was first applied.
VA Staff Physician FTEE
The data required for calculating both StaffPhysijk in the PF variant and the core (staff physician) component of StaffPhys'ik in the IPF variant are derived entirely from the VA Cost Distribution Report (CDR). In addition, the PF variables Nurseij and Supportij are computed from the CDR. This part of the VA national data system is thus pivotal in any empirically based approach to physician staffing.
For each VAMC, the CDR reveals the distribution of expenditures (direct as well as indirect ''cost'' components) from several different perspectives. First, it shows expenditures distributed across various service delivery categories, including medicine, surgery, psychiatry, neurology, rehabilitation medicine, intermediate medicine, nursing home, and spinal cord injury bed sections, and to various specialty-defined clinic-stop groupings within ambulatory care. The correspondence between these categories and the 14 PCAs should be evident.
At the same time, the CDR also shows the distribution of VAMC expenditures across cost centers, most of which correspond to some "organizational element" involved in either the direct provision or indirect support of patient care. Important for purposes here is that each of the 11 physician specialties has its own cost center (for example, medicine is cost center 201, surgery 202).
Within each of these cost centers there is a subaccount (termed the 1081) that shows the recorded allocation of total physician FTEE in that specialty (1) to each of the service delivery categories above—and, hence, to each of the 14 PCAs—and (2) within each PCA, to the activity headings of direct patient care, research, instruction of residents (and others), continuing education, and certain administrative and miscellaneous tasks. These subaccounts, initially available in the national data system in 1989, become the key to linking physician FTEE by specialty to PCAs and to various mission-related activities within each PCA. (It follows that each physician FTEE observation reflects the actual (recorded) staffing at the VAMC, not the number of positions authorized.)
In the PF variant, to derive VAMC i's value for StaffPhysijk, where, for example, j is the inpatient medicine PCA and k represents the specialty of surgery, proceed as follows with i's CDR. Go to cost center 202 (surgery) and from its physician subaccount (1081), record the amount of FTEE allocated to inpatient medicine direct care. This is accomplished by checking under the CDR account number (in this case, 1100.00) corresponding to that mission-related activity (direct care) in that service delivery category (inpatient medicine). All staff physician FTEE variables for use in the PFs are so computed.
Computing StaffPhys'ik for the IPF variant requires some additional steps. This facility-and specialty-specific variable is defined as the sum of staff physician and contract physician FTEE allocated to direct patient care, plus staff physician FTEE allocated to resident training. The staff physician direct-care
component (usually the largest part) is obtained by summing StaffPhys ijk across all PCAs at VAMC i. The resident training part is obtained by adding up specialty k's PCA-specific FTEE allocations to the CDR category of "Education & Training, Instructional Cost," which largely reflects the physician's time allocated to resident training (time spent with other trainees, although a small percentage of the total, would necessarily be included). Similarly, the contract physician component of StaffPhys'jk is derived as the sum across PCAs of ConPhys ijk, as defined in Equation 4.9.
Because StaffPhys'ik is not specific to PCA, it should be much less affected than StaffPhysijk by any intrafacility FTEE recording errors in the CDR.
There are no separate CDR categories for physician time allocated to routine administrative activities or various types of leaves of absence. It is assumed throughout that the net effect of VAMC i's adjustments to staffing levels in response to these realities is reflected implicitly in the observed values of Staff Physijk
As discussed in chapter 2, it is assumed that an FTEE represents a homogeneous concept, e.g., that two half-time physicians are the productive equivalent of one full-time, and so on. Consequently, it is implicitly assumed that, for each VA physician and PCA, the proportion of direct-care FTEE devoted to administration and leaves (and thus not to hands-on patient care) is the same at all FTEE levels. (In reality, this proportionality assumption may be violated; to investigate this would require special data collection and analysis.)
Nurse FTEE
Observations on the PF variable Nurseij are derived from facility i's CDR as follows. Under the nursing service cost center (241) at VAMC i, the nursing subaccount (1061) shows the amount of nursing service FTEE allocated to each PCA at the facility. Additionally, certain smaller amounts of nursing FTEE may be assigned directly to other, physician-related cost centers such as medicine and surgery. Each such cost center also has a nursing subaccount showing the allocation of its own nursing FTEE across PCAs. The value assigned to Nurseij is thus the sum of all nursing FTEE allocations at VAMC i to PCA j.
Several alternative ways of accounting for the productivity influence of nurses were examined in each of the PF models. The expression involving nurse FTEE that proved most satisfactory, both in conceptual and statistical terms, was Nurseij/StaffPhysij, where the denominator is the total FTEE for physicians involved in hands-on delivery of care in PCA j of VAMC i. (Included in this denominator were the following specialties: internal medicine, surgery, psychiatry, neurology, and rehabilitation medicine.) Such a variable allows examination, in the full context of the PF equation, of the effect of nursing staff intensity on physician productivity—which seems the appropriate focus in this
study. Moreover, when Nurseij alone was used in versions of Equation 4.9, implausible or otherwise unsatisfactory estimates often emerged for the coefficients of the VA staff physician variables.
Support-Staff FTEE
Almost all VA providers who are neither physicians nor nurses have no distinct cost center assignment (though two important exceptions are psychologists and social workers). Consequently, it is not possible to allocate to PCAs the FTEE of physician assistants, nurse practitioners, clinical nurse specialists, nurse anesthetists, ward clerks, phlebotomists, and other personnel.
The response was to proceed as follows: For each PCA j, total physician FTEE was added to total nurse FTEE, and the result subtracted from total (from all sources) PCA FTEE. The result is the residual FTEE quantity labeled Supportij. It is a composite measure of all nonphysician, nonnurse FTEE on that PCA. (Whenever psychologists or social workers were included in an equation, their FTEE was subtracted, as well, in computing Supportij.)
Just as with nursing FTEE, the form of a support-staff variable that performed most satisfactorily in the estimated PF was Supportij/StaffPhys ij, where the denominator, as above, is the sum of all hands-on physician FTEE on the PCA. This variable proved to be an important covariate in many estimated PFs, often out-performing the nursing intensity variable.
Contract Physician FTEE
Observations on the variable ConPhysijk were not derived from the CDR, but from the FY 1989 version of a survey conducted annually by the VA Central Office. Each facility is asked to estimate, based on its existing physician contracts, the resulting amount of FTEE by specialty and service delivery category (which can then be linked to PCAs).
In the PF equations, a distinct ConPhysijk variable can be specified for each specialty. In the IPF, the sum of these variables across PCAs yields ConPhysik, which becomes one component of the dependent variable in Equation 4.10.
Resident FTEE
To derive observations on Resijy, the total FTEE of postgraduate year (PGY) y residents in PCA j at VAMC i, information was combined from two data sources, neither of which alone would be adequate for the task. From the VA Office of Academic Affairs, the number of VA-supported residency positions
actually filled, by specialty and PGY, at each VAMC in FY 1989 was obtained. These data, however, cannot address the question of how residents allocate their time across PCAs.
From each facility's CDR, a rough allocation of resident FTEE to PCAs, by specialty, can be inferred for all residents supported by the VA either through salary or contract. For most VAMCs, this comprises well over 90 percent of the residency positions authorized by the Office of Academic Affairs. The CDR data, however, do not break out resident FTEE by PGY.
The response was to proceed as follows: For each specialty at the VAMC, CDR data were used to compute the fraction of resident FTEE allocated to inpatient care, ambulatory care, and long-term care. (A more finely tuned breakout into PCAs was deemed unreliable at present.) These fractions were applied to the resident position data for VAMC i in order to assign all resident FTEE in a given specialty and PGY to the three type-of-care areas (inpatient, ambulatory, and long-term care). Once allocated to a type-of-care area, this specialty-specific resident FTEE was then assigned to the PCA most closely associated with its specialty.
For example, suppose there are 40 residents in medicine at VAMC i, and 10 of these are second-year. Suppose that, from the CDR, it is found that 70 percent of all medicine resident FTEE at VAMC i is devoted to inpatient care, 20 percent to ambulatory care, and 10 percent to long-term care. Then, (10 × 0.70) = 7 residents would be assigned to the inpatient medicine PCA; (10 × 0.20) = 2 would be allocated to the ambulatory medicine PCA; and (10 × 0.10) = 1 would be split evenly between the LTC PCAs of nursing home and intermediate care. There are similar PCA mapping rules for the other 10 specialties specifically examined in this study.
Now, in both the PF and the IPF equations reported below, the RES variables are specific to PGY "group" rather than to individual year. The variable Residentsij will refer to the FTEE for all first-, second-, and third-year residents in PCAj of VAMC i. The variable Fellowsij will refer to the FTEE for all PGY 4, 5, 6, and 7 residents in PCA j of VAMC i.
This consolidation was adopted after analyses showed that using RES variables specific to each postgraduate year in the PF and the IPF equations sacrificed parsimony for only small gains in explanatory power.
Nonpersonnel Factors Influencing Physician Productivity
In the PF and the IPF equations estimated here, two basic types of control variables were tested as proxies for productivity-influencing factors (Prodfact). As part of the resource allocation model (RAM) that the VA was using in FY 1989 to help determine budgets at VAMCs, each facility was classified into one of six mutually exclusive and exhaustive RAM groups. Derived from a cluster
analysis of facility attributes (Stefos et al., 1990), the RAM groups can be characterized roughly as follows: small affiliated VAMCs (in subsequent terminology, HGroup1); small general unaffiliated (HGroup2); mid-size affiliated (HGroup3); mid-size general unaffiliated (HGroup4); metro affiliated (HGroup5); and psychiatric (HGroup6). The rationale for using these RAM group variables as proxies for Prodfact in Equations 4.9 and 4.10 is that physician style of practice and overall productivity may vary by type of facility, all else equal.
A second set of proxy variables for Prodfact indicates the VA geographic region (Eastern, Central, Southern, or Western) where the VAMC is located. Being tested is the hypothesis that there are regional variations in physician practice styles and the technology of care in VAMCs.
In the final months of the study, the committee did locate (non-CDR) data on annual capital equipment purchases by VAMCs; as discussed in the final section, these data can be transformed into a PCA-specific capital equipment index that may improve the overall performance of the empirically based staffing models. In subsequent iterations of these models, attention should be given to uncovering additional variables, computable at the VAMC level, that would help explain variations in physician productivity across facilities. Because it focuses on the workload production process at the PCA level, the PF variant is likely to benefit especially from these new variables.
ESTIMATED PF AND IPF EQUATIONS
In this section, the committee presents PF estimates for each of 14 PCAs and IPFs for each of 11 VA specialty groupings.
For every estimated equation below, literally scores of alternative specifications were tested. For each PCA or specialty, the effect of using alternative workload measures was examined. For each workload measure, alternative sets of independent (right-hand-side) variables were tested and for each variable set, the influence of alternative functional forms (i.e., mathematical transformations of the variables) was examined.
Reported below for each PCA or specialty is the estimated equation judged to be "best" by two criteria applied jointly and interactively: the clinical plausibility of the estimated coefficients and statistical measures of goodness of fit. In making these judgments, the committee benefited greatly from the recommendations of its data and methodology panel; that panel, in turn, worked closely with statistical consultants based at Duke University and with the study staff.
Before the equations are presented, some general comments are appropriate.
-
All analyses use data from FY 1989, the first year for which PCA-specific physician FTEE allocations were available on a nationwide basis.
-
With two exceptions, all equations specify workload in terms of weighted work units (either WWUs, CAPWWUs, or RUGWWUs, as the context requires); with few exceptions, equations estimated with a WWU-type workload exhibited stronger goodness of fit than similar ones using workload measures that do not control at all for case-mix and acuity differences.
However, on the advice of the psychiatry panel, for the inpatient psychiatry PF, bed-days of care (BDOC) was substituted for the WWU variable; the panel expressed concerns about the latter because it is based on a DRG classification system that may not be well oriented to psychiatry diagnoses. The other exception to a WWU-type workload specification occurred in the ambulatory care "other physician services" PF equation, where a variable defined in terms of clinic stops led to a significant improvement in overall goodness of fit.
-
Variables indicating the VAMC region of location are not included in the equations below. In most cases, such variables were not statistically significant; when they were, specialty panel members had difficulty assessing their clinical plausibility. Some members of the data and methodology panel contended also that models for determining future physician requirements should not have regional effects embedded in them.
-
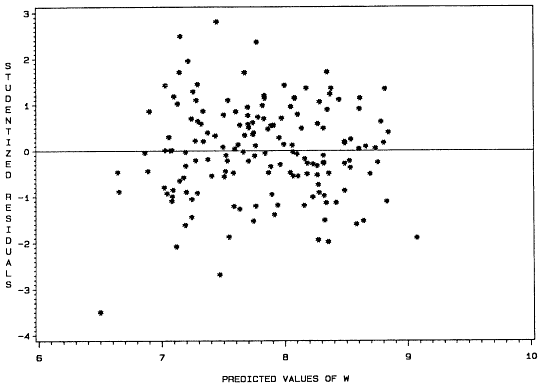
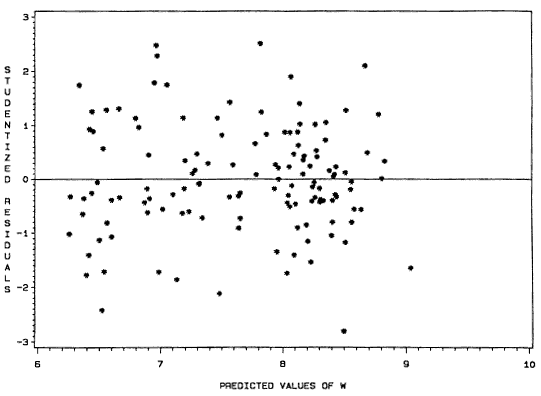
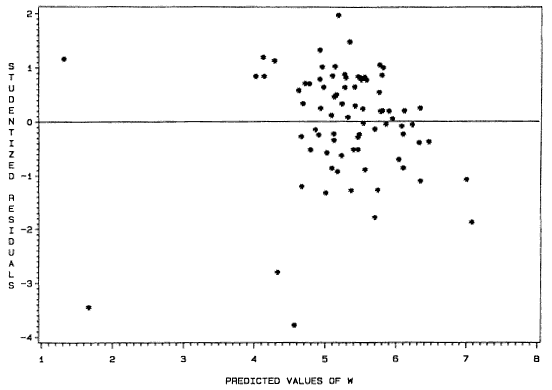
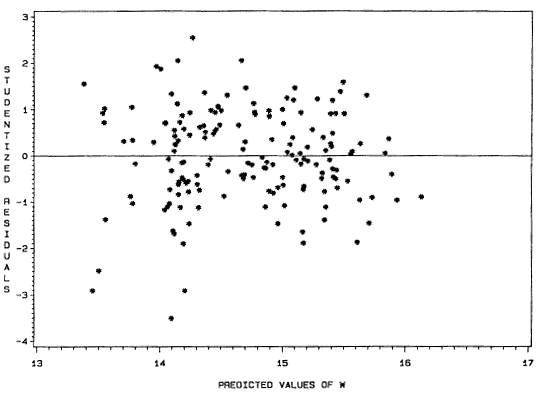
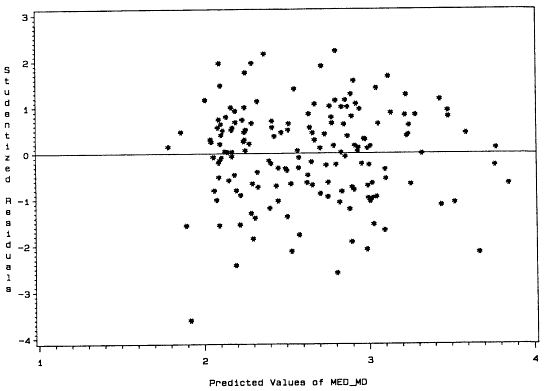
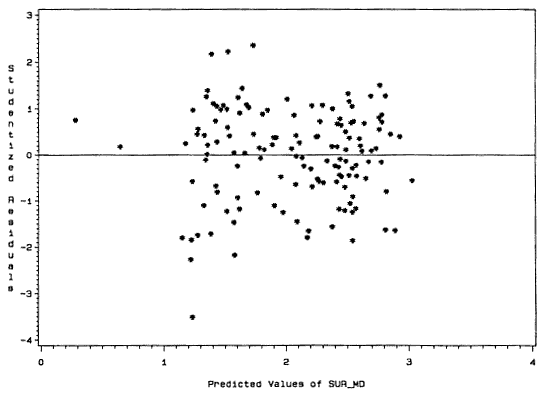
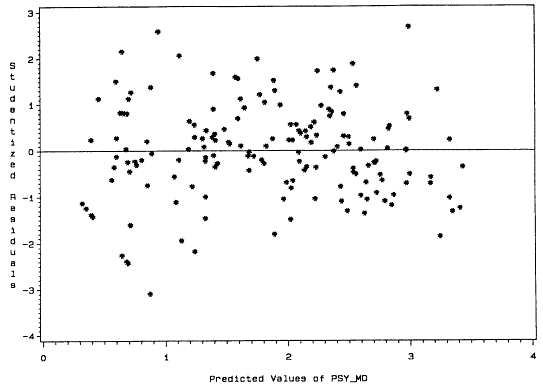
To explore whether the assumptions imposed on the error term in these regression equations are being significantly violated, a scatterplot was produced for each equation, showing its "studentized" residuals plotted against the corresponding predicted values of the dependent variable. As noted in the second section above, the rth residual is the algebraic difference between the actual and the predicted values of the dependent variable at the rth observation in the data set; studentized residuals have been normalized in a way that improves the ability to assess visually any systematic trends in the scatterplot. If the assumptions about ERROR hold, a random-looking plot can be expected. To illustrate such analysis, scatterplots are presented for selected equations in this chapter; in Volume II, Supplementary Papers, scatterplots for all estimated PF and IPF equations are shown.
-
In general, the remainder of this section builds upon, and assumes familiarity with, the preceding portions of the chapter (and associated footnotes). Frequent reference is made to definitions, modeling concepts, and statistical principles introduced in those sections.
In what follows, the PF equations are presented by PCA, and then the IPF equations are presented by specialty.
PF Estimates
The general framework for these estimated PF equations is captured in Equation 4.9. Where possible, the variable names introduced there and in the
preceding section are adopted below; but, because of the greater level of specificity here, some additional definitions are required. For simplicity, subscripts are suppressed, but it is understood that all variables in a given PCA equation are specific to that PCA at VAMC i. For example, Wij in Equation 4.9 is written simply as W.
Upon its first appearance, each variable is formally defined; in subsequent appearances, it is defined again only when necessary to avert ambiguity.
The sample size for each PF equation reflects the number of VAMCs with that particular type of PCA.
Inpatient Medicine
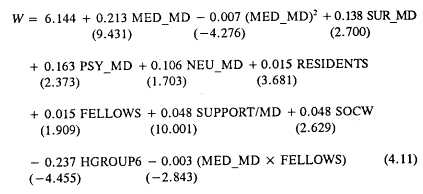
where
|
W |
= |
ln[wij + 1] = the natural logarithm of total WWUs, plus 1, produced in the inpatient medicine PCA during the fiscal year; |
|
MED_MD |
= |
VA staff physician FTEE from the medicine service allocated to direct care in the inpatient medicine PCA; |
|
(MED_MD)2 |
= |
variable testing for nonlinear relationship between VA staff internist FTEE and workload production—specifically, that there are diminishing marginal returns to increases in internist FTEE; |
|
SUR_MD |
= |
VA staff physician FTEE from surgery allocated to direct care in the inpatient PCA; |
|
PSY_MD |
= |
VA staff physician FTEE from psychiatry allocated to direct care in this PCA; |
|
NEU_MD |
= |
VA staff physician FTEE from neurology allocated to direct care in this PCA; |
|
SUPPORT/MD |
= |
support-staff FTEE divided by total FTEE for physicians involved in hands-on delivery of care in the inpatient medicine PCA, defined to include internists, surgeons, psychiatrists, neurologists, and rehabilitation medicine physicians (hereafter, this variable will be labeled more succinctly "support-staff FTEE per total physician FTEE in this PCA"); |
|
RESIDENTS |
= |
second-and third-year-resident FTEE allocated to this PCA (interns were omitted after statistical testing); |
|
FELLOWS |
= |
FTEE of residents PGY 4 and above allocated to this PCA; |
|
SOCW |
= |
social worker FTEE allocated to this PCA; |
|
HGROUP6 |
= |
categorical variable assuming a value of 1 if facility is in RAM Group 6 (psychiatric hospital); |
|
(MED_MD × FELLOWS) |
= |
interaction term for the joint influence of VA staff internists and fellows on the rate of workload production in this PCA; |
|
N |
= |
number of inpatient medicine PCAs (equivalent to the number of VA medicine services) in the sample. |
As stated earlier, the number in parentheses beneath each estimated coefficient is its t-statistic, indicating its statistical strength. As also noted, ![]() measures the overall goodness of fit of the estimated equation to the data; this
measures the overall goodness of fit of the estimated equation to the data; this
statistic ranges approximately from 0 to 1, with higher values indicating a better fit.
From Equation 4.11, it can be inferred that, in their consultative roles, surgeons, psychiatrists, and neurologists contribute significantly to workload production; residents, fellows, and social workers are clearly important, although there is a negative interaction effect involving fellows and staff internists (i.e., their total contribution to workload is less than the sum of their individual contributions, all else equal); the intensity of support staff positively influences productivity on the inpatient medicine PCA (though a NURSE/MD variable was not significant); and medicine PCAs in VA psychiatric hospitals produce significantly fewer WWUs/year than at other VAMCs, controlling for other factors. The net impact of staff internists on workload production, a central question, cannot be inferred from Equation 4.11 by inspection; it will be considered shortly.
The scatterplot of studentized residuals from Equation 4.11 is displayed in Figure 4.9. Their overall random appearance is not surprising, given the clinical plausibility and statistical strength of the estimated coefficients in Equation 4.11, as well as its high overall goodness of fit.
It would be instructive to pause at this first (of many) equations and discuss the general interpretation of the estimated coefficients. This is best done by example.
Consider first the coefficient of a continuous independent variable such as PSY_MD. A unit increase in psychiatrist FTEE devoted to direct care is expected to lead to a 0.163 unit increase in W. Since the latter is a nonlinear (logarithmic) function of workload, the corresponding expected increase in WWUs will depend on the absolute level of WWUs at which the PSY_MD increase is applied. If, at baseline, production in the medicine PCA was 2,484/year (the FY 1989 national mean), the corresponding W value is 1n(2,484 + 1) = 7.818. A full unit increment in PSY_MD implies a new W equal to (7.818 + 0.163) = 7.981. To find the resulting expected WWU level, one exponentiates this and subtracts 1, to get 2,924—a substantial increase in workload.9
The estimated coefficient of a categorical variable such as HGROUP6 can be interpreted as follows: All else equal, W is expected to be 0.237 unit smaller in a psychiatric hospital than in a VAMC in its "reference group" of facilities—defined here as all VAMCs in the other five RAM groups. (In general, the subset of items omitted from the equation is termed the reference group; it can be shown that all categorical variables require, statistically, a reference group.) Suppose the WWU level in the "typical" reference-group facility is 2,484/year, which establishes a reference-group baseline W of 7.818 (as previously calculated). The corresponding W for the typical RAM Group 6 facility is (7.818-0.237) = 7.581. After exponentiation and subtraction of 1, the expected WWUs/year are found to be about 1,960. (This assumes, of course, that the significant distinctions between RAM Group 6 facilities and all others in the production of W is captured in the variable HGROUP6.)
Similar calculations are pursued in chapter 7 under the general heading of Sensitivity Analysis.
Note, finally, that the process of arriving at the particular inpatient medicine PF shown in Equation 4.11 involved the testing of numerous alternative specifications. The statistical significance of both the direct effect (linear) and squared terms of each type of physician specialist and resident was investigated; interaction terms involving all of these inputs in pairwise combinations were likewise tested; a number of variables not appearing in the final version, such as NURSE/MD and hospital groups other than HGROUP6, were also examined. In the end, the version of the inpatient medicine PCA appearing in Equation 4.11 represented in the committee's judgment, the best-fitting clinically plausible model. Each of the PF (and IPF) equations presented here evolved similarly.10
Inpatient Surgery
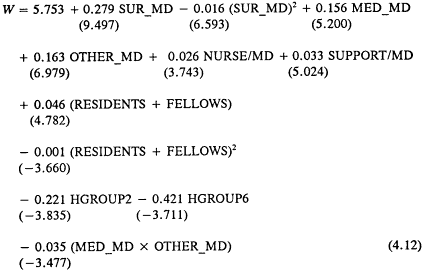
where
|
OTHER_MD |
= |
total FTEE allocated to inpatient surgery PCA by VA staff physicians not in medicine, surgery, psychiatry, neurology, or rehabilitation medicine cost centers; |
|
|
sample; moreover, multiple comparisons were undertaken using that sample. The resulting confidence statements should be regarded as ''nominal'' indications of statistical importance. Since the samples available for these analyses (all for one year, FY 1989) were not large enough to warrant use of split-sample techniques to validate the models, other precautionary steps were taken. Considerable attention was paid to characterizing the shape of the relationships among variables and to verifying that implicit model assumptions were satisfied. Care was taken to avoid "overfitting" the models. Regression diagnostic methods were employed to examine the patterns of residuals, assess the effects of outliers, and check for multicollinearity. Subsequent work with these models, which the committee advocates (in chapter 11) that the VA undertake, should focus on certain methods of internal validation, such as bootstrapping. The latter, for example, could be helpful in evaluating the extent of overfitting (or overoptimism), that may be present in the models. |
|
NURSE/MD |
= |
= nursing-staff FTEE divided by total FTEE for physicians involved in handson delivery of care in the inpatient surgery PCA, defined to include internists, surgeons, psychiatrists, neurologists, and rehabilitation medicine physicians (hereafter, this variable will be labeled more succinctly, "nursing-staff FTEE per total physician FTEE in this PCA"); |
|
(RESIDENTS + FELLOWS) |
= |
= total FTEE of residents PGY 2 and above allocated to this PCA; |
|
HGROUP2 |
= |
= categorical variable assuming a value of 1 if facility is in RAM Group 2 (small general unaffiliated VAMC); and |
|
(MED_MD × OTHER_MD) |
= |
= interaction term for the joint influence of VA staff internists and VA "other" physicians on the rate of workload production in the inpatient surgery PCA. |
The studentized residuals from Equation 4.12 are shown in Figure 4.10. No systematic trends or patterns are evident.
Inpatient Psychiatry
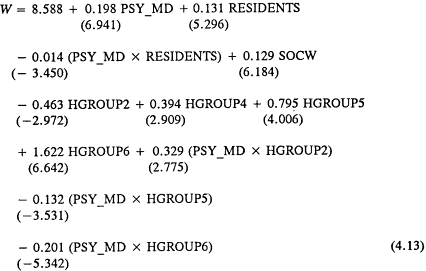
where
|
W |
= |
ln[BDOCij + 1] = the natural logarithm of total bed-days of care, plus 1, produced in the inpatient psychiatry PCA during the fiscal year; |
|
HGROUP4 |
= |
categorical variable assuming a value of 1 if facility is in RAM Group 4 (mid-size general unaffiliated VAMC); and |
|
HGROUP5 |
= |
categorical variable assuming a value of 1 if facility is in RAM Group 5 (metro affiliated). |
Note that although the social worker variable was strongly significant, a variable (not shown) for psychologist FTEE was not an important determinant of workload in inpatient psychiatry. (This is not the case, however, in the ambulatory psychiatry PCA.)
Inpatient Neurology

where
|
HGROUP(3 +5) |
= |
a categorical variable assuming a value of 1 if facility is in either RAM Group 3 (mid-size affiliated) or RAM Group 5 (metro affiliated). |
The surprising negative sign on MED_MD persisted across many alternative specifications of Equation 4.14. After much analysis it remains unclear whether this represents a true negative influence of internist FTEE on the rate of throughput in neurology bed sections or an FTEE reporting bias of some type; the committee's neurology panel favored the latter explanation.
The sample of 80 consists of the 79 VAMCs with officially defined neurology bed sections, plus one other facility with a significant enough neurology presence to merit an inpatient PCA designation.
Inpatient Rehabilitation Medicine

where
|
RMS_MD |
= |
VA staff physician FTEE from the rehabilitation medicine service allocated to direct care in the inpatient rehabilitation medicine PCA; |
|
LAB_MD |
= |
VA staff physician FTEE from laboratory medicine allocated to activities related to direct care in the inpatient rehabilitation medicine PCA; and |
|
In(SUPPORT/MD) |
= |
the natural logarithm of support-staff FTEE per total physician FTEE in this PCA. |
The sample of 79 consists entirely of VAMCs with officially designated rehabilitation medicine services. Note that Equation 4.15 does not include either workload or FTEE for SCI treatment; instead, SCI is analyzed as a separate PCA.
Figure 4.11 shows the studentized residuals from Equation 4.15. Although the point grouping is not as "tight" as for Equations 4.11 and 4.12, which exhibited superior goodness of fit, there are still no discernible trends or patterns.
Spinal Cord Injury

where
|
W |
= |
the natural logarithm of the sum of all medicine, surgery, psychiatry, neurology, and rehabilitation medicine WWUs, plus 1, generated in the SCI PCA; and |
|
SCI_MD |
= |
VA staff physician FTEE from the SCI service allocated to direct care in the SCI PCA. |
The sample consists of 21 VAMCs with officially designated SCI services.
Ambulatory Medicine
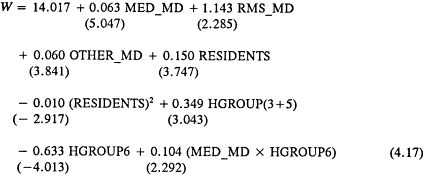
where
|
W |
= |
ln[wij + 1] = natural logarithm of total CAPWWUs, plus 1, produced in the ambulatory medicine PCA during the fiscal year. |
Recall that OTHER_MD is defined in Equation 4.12 as all physician FTEE assigned to direct care in the PCA exclusive of the direct-care FTEE of internists, surgeons, psychiatrists, neurologists, and rehabilitation medicine physicians.
In Figure 4.12, the studentized residuals from Equation 4.17 are plotted, and no trends or patterns are apparent.
where
|
PSYCH |
= |
psychologist FTEE allocated to direct care in the ambulatory psychiatry PCA. |
Thus, psychologists do make a significant contribution to the production of ambulatory psychiatry CAPWWUs, although subject to diminishing marginal productivity; this is also true for psychiatrists.
Ambulatory Neurology

Ambulatory Rehabilitation Medicine

Ambulatory Other Physician Services

where
|
W |
= |
ln(Clinic Stops + 1) = natural logarithm of total clinic stops, plus 1, produced in the ambulatory other physician services PCA during the fiscal year; and |
|
RAD_MD |
= |
VA staff physician FTEE from radiology allocated to direct-care activities in this PCA. |
The ambulatory other physician services PCA includes the emergency unit and admitting & screening, plus a number of miscellaneous clinic-stop sites. Put differently, it incorporates all clinic-stop sites not included in the other five ambulatory PCAs where physician-related services are rendered.
Nursing Home Care
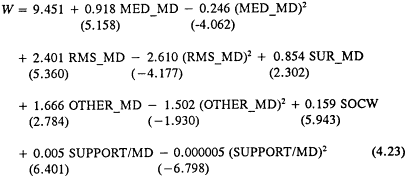
where
|
W |
= |
ln[wij + 1] = natural logarithm of total RUGWWUs, plus 1, produced in the nursing home PCA during the fiscal year. |
Intermediate Care
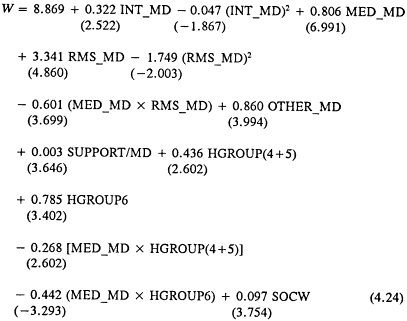
where
|
INT_MD |
= |
VA staff physician FTEE from intermediate medicine (i.e., recorded in the intermediate medicine cost center) allocated to direct care in the intermediate care PCA. |
IPF Estimates
The general framework for these estimated IPF equations is captured in Equation 4.10. When possible, the variable names introduced there and in the previous section are adopted below, but, as with the PF equations, more specific definitions are required in some instances. Subscripts again are suppressed, but it is understood that all variables in a particular IPF are specific to the equation's associated specialty. For example, Wik in Equation 4.10 becomes simply W.
Any variable not already defined in a PF equation will be defined upon its first appearance below; thereafter, the definition will be repeated only when required to avoid ambiguity.
Several additional adjustments specific to the IPF variant should be noted.
Contract physician FTEE was included in an IPF's StaffPhys'ik variable whenever it represented a nonnegligible percentage of total specialty k FTEE.
In an IPF for a specialty lacking a single dominant PCA (e.g., laboratory medicine), the WWU makeup of its inpatient workload variable, the CAPWWWU makeup of its ambulatory workload variable, and the RUGWWU makeup of its long-term care workload variable all had to be defined. How this was handled for laboratory medicine, diagnostic radiology, nuclear medicine, radiation oncology, and anesthesiology is indicated, in turn, in the estimated equations below.
For computational reasons only, all workload variables are divided by the constant 10,000; this affects the absolute size of the corresponding coefficient estimate but not its algebraic sign or statistical significance.
The sample size for each specialty's IPF is a reflection of the number of VAMCs that reported data from that specialty's cost center in FY 1989.
Medicine
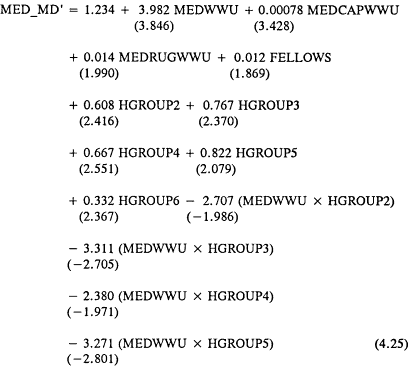
where
|
MED_MD' |
= |
natural logarithm of the sum of all VA internist FTEE devoted to direct care (i.e., the sum of all MED_MD variables) across all PCAs, plus total internist FTEE allocated to resident training across all PCAs, plus 1; |
|
MEDWWU |
= |
total medicine WWUs produced during the fiscal year in the inpatient PCAs of medicine, surgery, psychiatry, neurology, and rehabilitation medicine (divided by 10,000); |
|
MEDCAPWWU |
= |
total CAPWWUs produced during the fiscal year in the ambulatory PCAs of medicine and other physician services (divided by 10,000); |
|
MEDRUGWWU |
= |
total RUGWWUs produced during the fiscal year in the long-term care PCAs of nursing home and intermediate care (divided by 10,000); and |
|
FELLOWS |
= |
total FTEE of medicine residents PGY4 and above at the VAMC. |
The CAPWWU total covers not only ambulatory medicine, but also the other physician services PCA because the latter includes the emergency unit and admitting & screening, important clinic stops with heavy internist involvement.
From Equation 4.25 it can be inferred that inpatient, ambulatory care, and long-term care WWUs all influence the amount of internist FTEE required for direct care and resident education at the VAMC; internist requirements are positively related to the number of fellows; and the relationship between RAM-group assignment and internist requirements is complex and depends, in particular, on the absolute level of MEDWWU.
In Figure 4.13, the studentized residuals from Equation 4.25 are shown. Although there are several outlier points, reflecting the relatively modest R2 achieved, no marked trends are evident.
Surgery
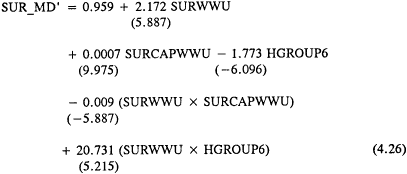
where
|
SUR_MD' |
= |
the natural logarithm of the sum of all VA surgeon FTEE devoted to direct care (i.e., the sum of all SUR_MD variables) across all PCAs, plus total surgeon FTEE allocated to resident training, plus 1; |
|
SURWWU |
= |
total surgery WWUs produced during the fiscal year across all inpatient PCAs (divided by 10,000); and |
|
SURCAPWWU |
= |
total CAPWWUs produced during the fiscal year in the ambulatory surgery PCA (divided by 10,000). |
In the course of the study, some data and methodology panel members hypothesized that the influence of inpatient and ambulatory workload on physician requirements would reflect a synergistic relationship. The negative interaction effect involving SURWWU and SURCAPWWU is consistent with the hypothesis, which is sustained in several other IPF equations, that the total influence of inpatient and ambulatory workload on physician requirements is less than the simple sum of their individual ''direct'' effects.
The studentized residuals from Equation 4.26 displayed in Figure 4.14 exhibit no systematic trend.
Psychiatry
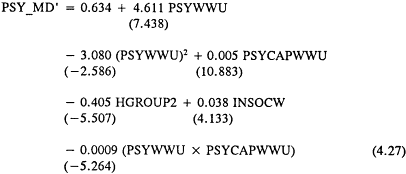
where
|
PSY_MD' |
= |
the natural logarithm of the sum of VA psychiatrist FTEE devoted to direct care (i.e., the sum of all PSY_MD variables) across all PCAs, plus total psychiatrist FTEE allocated to residency training, plus 1; |
|
PSYWWU |
= |
total psychiatry WWUs during the fiscal year across all inpatient PCAs (divided by 10,000); |
|
PSYCAPWWU |
= |
total CAPWWUs during the fiscal year in the ambulatory psychiatry PCA; and |
|
INSOCW |
= |
total inpatient social worker FTEE. |
The studentized residuals from Equation 4.26 are shown in Figure 4.15. Neurology
Neurology

where
|
NEU_MD' |
= |
natural logarithm of the sum of VA neurologist FTEE devoted to direct care (i.e., the sum of NEU_MD) across PCAs, plus total neurologist FTEE allocated to resident training, plus 1; |
|
NEUWWU |
= |
total neurology WWUs produced during the fiscal year across the inpatient PCAs (divided by 10,000); |
|
NEUCAPWWU |
= |
total CAPWWUs produced during the fiscal year in the ambulatory neurology PCA (divided by 10,000). |
Rehabilitation Medicine
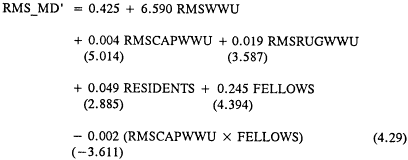
where
|
RMS_MD' |
= |
natural logarithm of the sum of VA rehabilitation medicine physician FTEE devoted to direct care (i.e., the sum of all RMS_MD variables) across PCAs, plus total RMS FTEE allocated to resident training, plus 1; |
|
RMSWWU |
= |
total RMSWWUs produced during the fiscal year across the inpatient PCAs; |
|
RMSCAPWWU |
= |
total CAPWWUs produced during fiscal year in the ambulatory rehabilitation medicine PCA; |
|
RMSRUGWWU |
= |
total rehabilitation medicine RUGWWUs produced during the fiscal year in the LTC PCAs of nursing home care and intermediate care; |
|
RESIDENTS |
= |
total FTEE of RMS residents PGY1-PGY3 at the VAMC; and |
|
FELLOWS |
= |
total FTEE of RMS residents PGY4 and above at the VAMC. |
Spinal Cord Injury
where
|
SCI_MD' |
= |
the natural logarithm of the total FTEE devoted by physicians in the SCI cost center to direct care and resident education in the SCI PCA, plus 1; and |
|
SCIWWU |
= |
the sum of all medicine, surgery, psychiatry, neurology, and rehabilitation medicine WWUs generated during the fiscal year in the SCI PCA. |
Anesthesiology
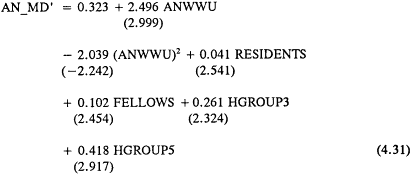
where
|
AN_MD' |
= |
the natural logarithm of the sum of all VA anesthesiologist FTEE devoted to direct care (i.e., the sum of AN_MD) across all PCAs, plus total contract anesthesiologist FTEE at the VAMC, plus total VA anesthesiologist FTEE allocated to resident education, plus l; |
|
ANWWU |
= |
total surgery WWUs produced during the fiscal year across all inpatient PCAs (divided by 10,000); |
|
RESIDENTS |
= |
total FTEE of anesthesiology residents PGY1-PGY3 at the VAMC; and |
|
FELLOWS |
= |
total FTEE of anesthesiology residents PGY4 and above at the VAMC. |
Laboratory Medicine
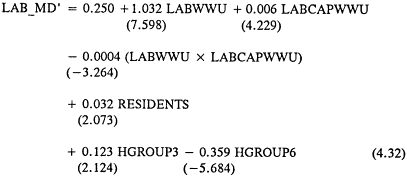
where
|
LAB_MD' |
= |
the natural logarithm of the sum of VA laboratory medicine physician FTEE devoted to direct care (i.e., the sum of LAB_MD) across all PCAs, plus total contract laboratory medicine FTEE at the VAMC, plus total VA laboratory medicine FTEE allocated to resident education, plus 1; |
|
LABWWU |
= |
total inpatient WWUs at the VAMC (divided by 10,000); |
|
LABCAPWWU |
= |
total CAPWWUs at the VAMC (divided by 10,000); and |
|
RESIDENTS |
= |
total FTEE of laboratory medicine residents PGY1-PGY3 at the VAMC. |
Diagnostic Radiology
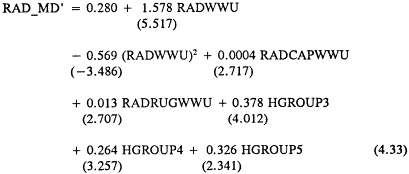
where
|
RAD_MD' |
= |
the natural logarithm of the sum of VA diagnostic radiology physician FTEE devoted to direct care (i.e., the sum of RAD_MD) across all PCAs, plus total diagnostic radiology contract physician FTEE at the VAMC, plus total VA diagnostic radiology physician FTEE allocated to resident education, plus 1; |
|
RADWWU |
= |
the sum of all MEDWWU, SURWWU, and NEUWWU at the VAMC (divided by 10,000); |
|
RADCAPWWU |
= |
the sum, of all MEDCAPWWU, SURCAPWWU, NEUCAPWWU, and OTHERCAPWWUs (divided by 10,000), where the latter is the total CAPWWUs generated in the ambulatory other physician services PCA; and |
|
RADRUGWWU |
= |
total MEDRUGWWU at the VAMC (divided by 10,000). |
Nuclear Medicine

where
|
NM_MD' |
= |
the natural logarithm of the sum of VA nuclear medicine physician FTEE devoted to direct care (i.e., the sum of NM_MD) across all PCAs, plus total nuclear medicine contract physician FTEE at the VAMC, plus total VA nuclear medicine physician FTEE allocated to resident education, plus 1; |
|
NMWWU |
= |
the sum of all MEDWWU, SURWWU, and NEUWWU at the VAMC (divided by 10,000); |
|
NMRUGWWU |
= |
total MEDRUGWWU at the VAMC (divided by 10,000); |
|
RESIDENTS |
= |
total FTEE of nuclear medicine residents PGY1-PGY3 at the VAMC; and |
|
FELLOWS |
= |
total FTEE of nuclear medicine residents PGY4 and above at the VAMC. |
Radiation Oncology

where
|
RO_MD' |
= |
the natural logarithm of the sum of VA radiation oncology physician FTEE devoted to direct care (i.e., the sum of RO_MD) across PCAs, plus total radiation oncology contract physician FTEE at the VAMC, plus total VA radiation oncology physician FTEE allocated to resident training, plus 1; |
|
ROWWU |
= |
the sum of MEDWWU, SURWWU, and NEUWWU at the VAMC (divided by 10,000); |
|
ROCAPWWU |
= |
the sum of MEDCAPWWU, SURCAPWWU, NEUCAPWWU, and OTHERCAPWWU (divided by 10,000); and |
|
RORUGWWU |
= |
total MEDRUGWWU at the VAMC (divided by 10,000). |
EBPSM APPLICATION 1: USING THE MODELS TO ASSESS PHYSICIAN STAFFING LEVELS AND WORKLOAD PRODUCTIVITY AT VAMCS
Irrespective of the weight accorded empirically based models in the overall strategy for determining future physician requirements (see chapter 6), the EBPSM can serve as an important mechanism for evaluating the relative performance of individual VAMCs (or groups of them) at any point in time.
Each estimated IPF regression equation can be used to determine whether physician FTEE in a particular specialty at a particular facility is either more, or less, than expected, given the VAMC's workload and other relevant attributes such as affiliation status. Similarly, each estimated PF equation can assess
whether a particular PCA produced either more, or less, workload than expected, given such relevant attributes as current VA physician, resident, and nonphysician staffing levels and affiliation status.
To demonstrate this, three illustrative analyses are presented below. In the first subsection below, the estimated IPF equations are used to compare the predicted quantity of physician FTEE for direct care and resident education at a facility in FY 1989 with the actual FTEE level allocated there to those purposes. In the second subsection below, the estimated PF models are manipulated to derive physician requirements for direct care (only), by specialty, at a facility; these FY 1989 estimates are compared with the actual FTEE allocated to direct care. Finally, the PF equations are used to derive predicted workload production, by PCA, at the facilities for FY 1989; each prediction is compared with the corresponding actual rate of productivity in that PCA at the facility.
For the remainder of this chapter, and in parts of the next two chapters, the analyses focus on four actual VAMCs selected to illustrate several aspects of the physician requirements methodology. The facilities (which will remain anonymous) are VAMC I, mid-size affiliated; VAMC II, metro affiliated; VAMC III, mid-size general unaffiliated; and VAMC IV, psychiatric.
The particular staffing results that emerge for these four VAMCs are not heavily emphasized because the committee does not wish to imply that systemwide policy conclusions can or should be drawn from them. Rather, the purpose is to show how the VA decision maker can use the empirically based model to examine actual-versus-expected performance—and, in the process, garner information useful to an ongoing dialogue about physician staffing involving VA Central Office and the VAMCs. This theme is pursued again in chapter 7.
Using the IPF to Compare Predicted and Actual Physician FTEE Devoted to Direct Patient Care and Resident Education
The policy question being examined here is as follows. In specialty k at VAMC i at some point in time, there will be some actual (recorded) quantity of physician FTEE devoted to patient care and resident teaching in the PCAs. The IPF estimated for k can probe the following question: Given these actual workload rates and other facility-specific attributes acknowledged in the equation, how much specialty k FTEE would the model predict as being required for patient care and resident education at VAMC i? If predicted FTEE exceeds actual FTEE, the model is implying that to handle the workload and resident education requirements at a facility with VAMC i's particular set of characteristics, more physician FTEE was anticipated than found. In this particular sense, VAMC i could be characterized as "understaffed" in specialty
k relative to other VAMCs. (This, alone, is not sufficient for a policy conclusion that i is understaffed in k—unless the VA decision maker has already elected to build the physician staffing methodology around the IPF, one of several possibilities examined in chapter 6.)
If actual FTEE exceeds predicted FTEE, the facility has more physician FTEE in specialty k for patient care and resident education than would be expected on a systemwide-average basis; in this sense, it is "overstaffed" for these missions. If actual and predicted FTEE happen to be equal, the model—estimated from a representative (and almost complete) sample of facilities—implies VAMC i has just the quantity of specialty k one would expect.
For each prediction, a "prediction interval" yielding information about its statistical precision can be computed. In general, let P be the IPF's predicted FTEE value for specialty k and VAMC i, and let L and U be the lower and upper limits of, say, its 95 percent prediction interval. This interval is denoted as (L,U) and interpreted as follows: For a VAMC with i's exact attributes, including workload to be produced, there is a 95 percent probability that specialty k FTEE (devoted to patient care and teaching) will be found to lie in the interval bounded by L and U. [For a technical discussion of prediction intervals and the formula for calculating them, see Moses (1986) and Kmenta (1986).]
In Tables 4.1 through 4.4, actual and predicted physician FTEE for direct patient care and resident education are compared for each of 11 specialties at the selected VAMCs. The choice of a 95 percent prediction interval, although common, is arbitrary; intervals can be calculated similarly for whatever confidence level the decision maker desires.
Frequently, there is a substantial divergence (in percentage terms) between actual and IPF-predicted physician FTEE. Any such divergence constitutes prima facie evidence that staffing in that specialty at that facility departs substantially from VA system norms. But it may or may not indicate a physician staffing problem.
Subsequent discussions with the facility could reveal any of several explanations for the divergence: an error in the CDR data; significant assistance from non-VA consulting physicians that reduced staff physician requirements (assuming predicted FTEE exceeds actual); or an especially severe case mix within the DRGs assigned, so that WWUs understate the demands on physician time (assuming actual exceeds predicted). Or, these discussions might indeed indicate that the facility is understaffed or overstaffed, relative to the VA system "norms" embedded implicitly in the IPF equations.
Using the PF to Compare Projected and Actual Physician FTEE Devoted to Direct Patient Care
An alternative approach for deriving specialty-specific physician FTEE requirements for direct patient care is through manipulation of the estimated PF equations.
Compared with the IPF-based approach just discussed, a PF-based strategy has the advantage of allowing VA staff physician patient-care requirements for the facility to be derived on the basis of requirements at the PCA level and of allowing the latter to reflect the productivity contributions of staff physicians relative to other providers, including residents, nurses, and support staff. Thus, staff physician requirements for patient care can be derived while controlling for other factors that contribute to patient care.
However, the PF-based approach does present some complications, as will be seen. If a certain specialty's FTEE variable does not merit inclusion in a given PCA's PF on statistical grounds, physician requirements in that specialty for that PCA will always be computed as 0, whatever the specialty's actual time and contributions to patient care. Also, because the dependent variable is workload and not physician FTEE, prediction intervals on FTEE requirements cannot be computed directly. (Note that under the least-squares regression model, physician FTEE is assumed to be nonprobabilistic in these PF specifications; hence it is not possible to derive a statement of statistical precision about the level of physician FTEE found to be consistent with the production of a given patient workload.)
A third issue, well illustrated by the estimated PF equations above, is that for any given workload level, W*, projected for a given PCA, there is typically not one, but many (sometimes an infinite number of) provider combinations which, when substituted into the PCA's PF, yields a predicted value of W equal precisely to W*. Which provider combination should be chosen? The question is clearly important because the choice effectively determines the relative and absolute physician FTEE levels accorded to that PCA in response to W*. (In traditional production theory in economics, the issue is resolved because the assumption of profit maximization implies that the firm will be led always to choose the one combination of inputs that minimizes cost, given the desired rate of output.)
In response, the following approach has been adopted in this chapter to determining physician requirements via the estimated PF models. To simplify, let the estimated PF for a given PCA be W = b0 + b1 StaffPhys + b2 Residents + b3 (Nurse/StaffPhys), and let the current values of workload and the three independent variables be denoted by the 0 subscript.
If the workload target for the PCA is declared to be W* (see chapter 8 on how future workload levels are projected on a facility-and PCA-specific basis), what equal proportionate change in all provider variables from their current
values would yield new values consistent with meeting a projected workload rate of W*?. The answer is to solve for the constant c such that W* = b0 + b1(cStaffPhys0) + b2(cResidents0) + b3(cNurse0/cStaffPhys 0). What is termed the ''projected'' level of staff physician FTEE thereby consistent with producing workload W* is cStaffPhys0. (''Projected" rather than "predicted" is used to indicate the nonprobabilistic nature of the calculation.)
In chapter 7, an alternative, conceptually stronger, though more complicated technique—called linear programming (LP)—is illustrated for deriving physician requirements for patient care using the estimated PF equations, in conjunction with other data and assumptions about the use of resources in the PCAs. In particular, LP allows such questions to be asked as: What combination of staff physician FTEE and other provider FTEE minimizes the dollar cost of providing patient care, subject to the constraints that (1) projected workload targets are met and (2) the FTEE ratios among various providers are not so high or low as to be clinically or administratively implausible. (As shown also in chapter 7, additional constraints can be imposed requiring that provider FTEE levels, and ratios, adhere to certain quality-of-care requirements that may be imposed by the VA decision maker.)
In what follows, however, the simple "multiplier adjustment" approach, described above, is used to derive physician requirements for patient care from the estimated PF equations.
The results are summarized in Tables 4.5 through 4.11. All tables pertain to VAMC II (only) and show actual-versus-projected physician FTEE requirements for patient care in FY 1989 for the following five specialties and two VA programs, respectively: medicine, surgery, psychiatry, neurology, rehabilitation medicine; ambulatory care and long-term care.
Physician requirements cannot be derived by this PF-based technique for the specialties for which a PF could not be estimated: anesthesiology, laboratory medicine, diagnostic radiology, nuclear medicine, and radiation oncology.
There is no separate table for SCI physicians because all of their direct patient care is assumed to occur in the SCI PCA. When the multiplier adjustment process is applied to the estimated SCI PF, a projected value of SCI_MD for VAMC II for FY 1989 of 0.64 is derived, compared with the CDR-recorded value of 0.72.
These results are presented in some detail not to make particular policy statements about VAMC II (though some interesting points are suggested), but rather to demonstrate concretely that the PF variant of the empirically based model can be used as one basis for assessing the level of physician staffing at VAMCs.
As with the IPF application, divergences between actual and projected staffing do not ipso facto indicate inappropriate staffing—the data do not ''speak for themselves." Rather, they must be interpreted in light of (1) additional information that the VAMC or others may wish to bring to bear and (2) the
relative weight accorded an empirically based approach in the overall physician requirements methodology. The considerable discussion in chapter 6 about a "Reconciliation Strategy" is aimed precisely at resolving this second issue.
Using the PF to Compare Predicted and Actual Rates of Workload Productivity
The estimated PF equations are naturally well suited for examining an important question that bears on physician requirements. Specifically, for any PCA at any VAMC, how does its actual rate of workload production compare with the rate predicted by the appropriate PCA-specific PF? That is, given the quantity of staff physicians (by specialty), residents, nurses, and support personnel allocated to the PCA at a point in time, is the PCA's actual workload productivity higher, lower, or about equal to what its PF indicates would be expected for a facility with these attributes?
Recall that the PF has been estimated from observations across the VA system on the relationship between provider FTEE and workload levels; thus, any particular workload prediction derived from it is a reflection of the systemwide average rate of productivity expected, given that PCA's particular array of physician and nonphysician providers.
In Tables 4.12 through 4.15, the results of just such an analysis are summarized for four selected PCAs at the four VAMCs in FY 1989.
That the predicted workload diverges significantly from actual workload in some instances prompts several points:
-
Even for a perfectly specified PF model, some divergence could be expected between actual and predicted due solely to random error.
-
Although the PF (and the IPF) equations exhibit strong goodness of fit by social science standards, there is no guarantee that they are perfectly specified. Indeed, certain possibly important variables—for example, non-VA consulting physician FTEE and capital equipment—cannot be included in the equations at present because there are no systemwide data on them. Moreover, certain idiosyncratic local factors—for example, that the VAMC has been recruiting unsuccessfully for specialty k physicians for several years—cannot easily be incorporated in these models. Even if variables capturing such effects could be developed, the modest sample sizes here limit the number of independent variables that can be successfully accommodated.
-
It therefore follows that sharp departures of actual from predicted values should be taken seriously—but as a signal for investigation into factors behind the divergence, not as an automatic mandate for staffing changes.
EBPSM APPLICATION 2: DERIVATION OF FUTURE PHYSICIAN REQUIREMENTS, BY SPECIALTY, FOR VAMCS
In what follows, the committee demonstrates how the empirically based models can be used to determine future VA physician requirements at VAMCs.
The technical procedures for using the IPF to derive physician requirements for patient care and resident education and the PF to derive requirements for patient care were illustrated in the previous section. Because the aim there was to estimate physician FTEE required for FY 1989, all workload values used in those equations were actual FY 1989 observations.
In the calculations summarized in Tables 4.16 through 4.27, projections of future VA workload are applied to the estimated IPF and PF equations to derive estimates of future physician requirements, by specialty. To compress and focus the presentation, the calculations pertain only to the four selected VAMCs and to the fiscal years of 2000 and 2005.
The workload projection methodology used here, as summarized in chapter 8, represents an adaptation of existing VA procedures to the specific requirements of this study. In particular, the VA methodology was extended to accommodate inpatient WWUs, ambulatory care CAPWWUs, and long-term care RUGWWU s—workload measures central to this study's equations, but not now used in VA strategic planning models.
Since previous sections have set the stage, a brief presentation of the results proceeds.
Using the IPF to Derive Future Physician Requirements For Direct Patient Care and Resident Education
These analyses are summarized in Tables 4.16 through 4.19 for VAMCs I through IV, respectively, and show physician requirements for patient care and resident education in 11 specialties for FYs 2000 and 2005.
Each FTEE calculation is expressed as a "prediction," accompanied by a 95 percent prediction interval. The interpretation is as follows. The focus, in general, is on specialty k at VAMC i in some future year t. Given projections of the level of workload relevant to specialty k at i in year t, the facility's RAM group status, and other factors reflected in k's IPF, this model generates a best estimate (a "prediction") of the amount of physician k FTEE to be found at i in t. The prediction interval indicates the statistical precision of this forecast.
Since this IPF has been estimated with a systemwide sample of observations on current FTEE levels for k in relationship to current workload, the predicted FTEE level can be interpreted as the answer to the following question: How much specialty k FTEE is required to handle future patient care and resident
education, assuming that the current average relationship between workload and FTEE, as estimated via the IPF, continues to prevail?11
To illustrate the calculation process, consider the derivation of medicine FTEE requirements for VAMC I for FY 2000, as summarized in Table 4.16. The vehicle for this derivation is the estimated IPF for medicine, Equation 4.25. From the workload projection analyses of chapter 8, it can be shown that MEDWWU for VAMC I for FY 2000 is 0.4432 (that is, 4,432 WWUs/10,000), that MEDCAPWWU is 486.4956 (= 4,864,956 CAPWWUs/10,000), and that MEDRUGWWU is 2.0827 (= 20,827 RUGWWUs/10,000). Since VAMC I is a RAM Group 3 facility, HGROUP3 = 1, and all other RAM group variables are set to 0. Regarding the interaction terms in Equation 4.25, only (MEDWWU × HGROUP3) is nonzero, and it now equals MEDWWU.
The final problem is determining an appropriate value for FELLOWS for FY 2000—a difficult estimate that the VA Office of Academic Affairs, which administers the VA residency support program, has had no reason to pursue to this point. As a practical response, it was assumed that the number of PGY4 residents and above in medicine would change in proportion to inpatient workload. At VAMC I in FY 1989, there were 14 fellows in medicine, and MEDWWU was 0.3718, so that the 2000:1989 MEDWWU ratio is 0.4432/0.3718 = 1.192. When this multiplier is applied to 14, the projected value of FELLOWS is 16.69 FTEE.
When these variable values are substituted into Equation 4.25, the resulting predicted quantity of internist FTEE required for patient care and resident education is 17.18, as indicated in Table 4.16. (This can be compared with the predicted and actual FTEE levels for FY 1989, which from Table 4.1 are 14.77 and 19.41, respectively.) The accompanying prediction-interval calculation for FY 2000 implies that the probability is 0.95 that a facility with VAMC I's attributes and facing the workload demands calculated above will be found to have an internist FTEE level for patient care and resident education between 7.70 and 36.98. The considerable width of this and many of the other prediction intervals reported in the tables here is a reflection of several factors: uncertainty about whether the "true" model for predicting the dependent variable has been determined (which becomes magnified when the prediction is made for independent variable values that depart significantly from the FY 1989 sample means), and additional uncertainty because the future observation of the dependent variable (the thing being predicted) arises from a random process (or so the model assumes).
The committee notes that most FTEE predictions in Tables 4.16 through 4.19 appear plausible (or not implausible), as did the projected workload levels used in their derivation.
Using the PF to Derive Future Physician Requirements For Direct Patient Care
These analyses are summarized in Tables 4.20 through 4.27. Each shows, for a given future year and VAMC, the projected FTEE required for direct patient care, by specialty, in each PCA. By summing across any row, the total projected physician FTEE for the associated PCA is obtained. By summing down a given column, the projected total FTEE for that specialty is obtained. Separate totals are presented for inpatient care, the ambulatory care program, and the PCAs comprising long-term care here.
These workload projections were all derived by the multiplier adjustment method discussed in some detail in the previous section. It was applied here as follows: For a given VAMC and future year, the projected workload for each PCA was inserted into the left-hand side (dependent-variable position) of that PCA's PF. The multiplier adjustment method was then invoked to derive direct-care FTEE levels for all physicians (and only those physicians) included in the PF. This yields the FTEE values displayed in each row of the table. The process is repeated for all PCAs—that is, for all estimated PFs—so that FTEE requirements for any specialty are computed as the sum of all PCA-specific requirements.
Because the two empirically based variants differ both in modeling assumptions and in the process used to calculate future physician FTEE, the PF and IPF estimates for a given PCA and year are not expected to exhibit, in every instance, the expected ordered relationship—namely, that the IPF estimate should exceed the PF because the former also includes resident education.
As a concluding note, the committee emphasizes that none of the estimates presented in this and the previous section are for total physician FTEE requirements. Rather, the PF projections pertain solely to patient care, and the IPF predictions are for both patient care and resident education. As indicated in chapter 2, these two mission-related activities absorb the bulk of physician time in all specialties. But some staff physicians do devote significant time to research, and small amounts of FTEE are typically allocated to continuing education, quality assurance, and other activities, (including regulatory functions).
Hence, for an EBPSM to be complete, data-driven approaches must also be developed for determining future FTEE for research, continuing education, and other activities at the VAMC. Specifically, when the IPF variant is used, FTEE estimates for each of the above will need to be added in separately. When the
PF variant is used, FTEE for these activities and also for resident education will need to be incorporated.
Recommendations on how to derive these additional FTEE components, plus a worked example illustrating the process for computing total physician requirements in a specialty, are presented in chapter 6.
PROPOSALS FOR REFINING AND EXTENDING THE EBPSM
In sum, the results reported in this chapter demonstrate that, with few exceptions, statistically strong and clinically meaningful models for determining physician requirements can be developed and estimated using currently available VA data.
It must be acknowledged, however, that a recurring theme sounded by the committee's six specialty and two clinical program panels was that the data used in these models—particularly physician FTEE data from the CDR—were at risk of being skewed through various types of reporting errors. The committee is in no position to challenge the claim that such measurement errors, of omission or commission, do occur; undoubtedly they do. But it can be concluded that such errors are not so pervasive or virulent as to preclude the development of plausible, good-fitting models relating physician FTEE and workload. Nonetheless, the committee believes that VA data relevant to the EBPSM can and should be improved. Specific proposals are offered below for enhancing the quality of existing data and for developing, on a systemwide basis, additional information required for the construction of new variables.
In general, the VA should test, evaluate, and revise, as needed, the EBPSM on an ongoing basis. With the demands on the VA health care system in dynamic transition, the EBPSM should not be treated as a static construct.
Improving the Accuracy of Data From the CDR
The VA should consider several options:
-
Each VAMC center is now required to have a data validation committee with a mandate to ensure that each service's FTEE allocations are reasonable and, further, that the allocations transmitted by the facility to VA Central Office accurately reflect the data reported by the services. These committees should be actively encouraged to work aggressively at quality control.
-
Positive incentives should be instituted for individual physicians and administrators to fill out CDR worksheets accurately—or penalties should be
-
applied for evident sloppiness or misrepresentation. These incentives and penalties could involve tangible "carrots and sticks" or simply moral suasion.
-
For short, concentrated periods, physicians and administrators should be required to track how physician time is being allocated across activities; the results should be compared with the corresponding FTEE allocations in CDRs.
The VA has recently appointed a national Data Validation Task Force to identify facilities whose reported figures, on a wide variety of items, diverge significantly from system norms. This task force should devote particular attention to FTEE allocations in CDRs.
Developing Improved and New Variables For the Models
The scope of the VA's national data system should be broadened to permit the construction of potentially important new variables and the refinement of existing variables for use in the EBPSM.
-
At present, it is not possible to distinguish full-time (FT) and various levels of part-time (PT) physician FTEE in the national CDR accounts. Data breaking out full-time and part-time physician FTEE (by how many "eights" each physician represents) are available in the VA payroll system. This information should be integrated into the CDR accounts to yield specialty-specific observations on the amount of physician FTEE, by FT-PT category, allocated to each PCA at all VAMCs. Only then can such basic questions be investigated as whether two half-time VA physicians are equivalent in productivity to one full-time physician; the current practice of aggregating across all physicians in a specialty to create a single FTEE measure assumes such an equivalency. In addition, the CDR should be amended so that physician FTEE for resident education, research, and administration not occurring in the PCAs can be clearly distinguished.
-
It is also not possible at present to distinguish physicians by subspecialty in the national CDR accounts; for example, the quantity of FTEE allocated by the cardiologist to the medicine inpatient PCA or by the neurosurgeon FTEE to the ambulatory surgery PCA are not available from these accounts at the moment. Investigations exploring the merits of including subspecialty FTEE in the PF equations and of producing IPFs specific to subspecialties cannot be undertaken unless these more detailed breakouts of FTEE data are developed and automated centrally.
-
Estimates of Consulting & Attending and Without-Compensation physician FTEE are not available on a systemwide basis presently. The VA should strongly consider focused, time-limited surveys to collect this information by specialty and PCA at each VA facility. Only then can the net contributions of
-
C&A and WOC physicians in the production of workload be evaluated appropriately.
-
Data on the type, amount, and vintage of capital equipment affecting the efficient delivery of high-quality care should be made available for each PCA in all VAMCs. Expert judgment would be required to identify the relevant equipment for each PCA. Preliminary investigations by the study staff in late 1990 revealed that facility-specific information on capital equipment acquisitions is maintained by the VA Office of Acquisitions & Materiel Management. It now appears that variables can be constructed from these data indicating the dollar amount and type of capital equipment, by PCA, at a VAMC. Considerable analysis would be required, however, to produce such variables in a form suitable for inclusion in the PF equations.
-
For each resident supported by the VA via salary or contract, a CDR worksheet is completed, but it allocates the resident's time only to the broad categories of Inpatient Medicine, Inpatient Surgery, Inpatient Psychiatry, and Outpatient Care. These categories need to be further broken out on the worksheet to allow a direct (rather than inferential) assignment of resident FTEE to each PCA in the facility.
-
At present, there are potentially important nonphysician personnel categories for which FTEE totals are available on a facility-total basis, but not allocated to PCAs. Included here are physician assistants, nurse practitioners, ward clerks, phlebotomists, and, in fact, all categories not assigned a distinct cost center in the CDR. In response to this limitation, the committee created for the PF analysis the PCA-specific variable called SUPPORT, defined generally as the total nonphysician, nonnursing service FTEE allocated to the PCA. Because this variable cannot now be further spliced into distinct personnel categories, a PCA-specific PF whose nonphysician component is tailored to the mix of personnel typically found on that PCA cannot be constructed. The VA should strongly consider enhancing the CDR national accounts so that FTEE data for all personnel categories relevant to the EBPSM are available at the PCA level.
-
With the VA's assistance, the committee was able to develop a number of alternative operational definitions of patient case workload. The strong goodness of fit and overall statistical soundness of most estimated PF and IPF equations provide prima facie evidence supporting the validity of these workload measures. But the VA should consider further analyses testing whether there are other output variables, derivable from existing VA data, that are more sensitively related to physician time requirements.
Further Methodological Development
The committee recommends that the VA periodically review the selection of variables and overall functional form of the EBPSM.
Over time, a number of factors affecting the PF and the IPF equations can be expected to change, at varying rates: the mix and acuity level of cases presenting at VAMCs; medical technology; practice patterns; the range of services offered by the VA; the relative balance between inpatient, ambulatory, and long-term care services; and the quality and scope of data from the Cost Distribution Report and other sources. Moreover, the motivation and effort level of individual physicians may well be influenced by some of these VA system changes. The VA should investigate measurable factors that appear to account for differences in individual physician productivity, then use these factors in subsequent analyses that relate physician requirements, in part, to the predicted effort level per FTEE.
Consequently, it is important that all equations be reestimated periodically to test whether these various secular changes suggest modification of the models—either their mathematical form or variable makeup. For maximum statistical power, these investigations require the pooling of data over time to generate a time series of cross-sectional observations for each PF and IPF equation (Kmenta, 1986). As its sample size grows, the statistical precision of each equation will improve. Moreover, by using time-dependent 'control" variables, the analyst can explicitly allow for the possibility that a given explanatory variable may wield different degrees of influence over time on the outcome of interest (either physician FTEE in the IPF or PCA workload in the PF). As multiple years of data accumulate, it will become possible to undertake certain innovative, split-sample methods of internal model validation, such as bootstrapping (see footnote 10 in this chapter).
Since a complete new data set emerges each year, it would be feasible to reexamine the EBPSM on an annual basis. For selected facilities, actual values of workload or FTEE could be compared with the values predicted by the EBPSM. The reasons for significant discrepancies could be explored, likely leading to improved specifications of the EBPSM.
These recommendations underscore a critical point: Building a strong physician requirements methodology calls for an evolutionary process—one with the flexibility to adapt to changing times and learn from its own discoveries.
REFERENCES
Feldstein, Martin S. 1967. Economic Analysis for Health Service Efficiency. Chicago: North-Holland Markham Publishing Company.
Jensen, G.A., and Morrisey, M.A. 1986a. Medical staff specialty mix and hospital production. Journal of Health Economics 5:253-276.
Jensen, G.A., and Morrisey, M.A. 1986b. The role of physicians in hospital production. Review of Economics and Statistics 68:432-442.
Kmenta, J. 1986. Elements of Econometrics. 2nd ed. New York: Macmillan Publishing Company.
Kushman, J., Scheffler, R., Miners, L., et al. 1979. Non-solo dental practice: Incentives and returns to size. Journal of Economics and Business 31(1):29-39.
Maurizi, A.R. 1969. Economic Essays on the Dental Profession. Iowa City, Iowa: University of Iowa, College of Buisness Administration.
Moses, Lincoln E. 1986. Think and Explain with Statistics. Reading, Mass.: Addison-Wesley Publishing Company.
Pauly, Mark V. 1980. Doctors and Their Workshops. Chicago: University of Chicago Press.
Reinhardt, U.E. 1975. Physician Productivity and the Demand for Health Manpower. Cambridge, Mass.: Ballinger Publishing Company.
Scheffler, R.M. 1981. Productivity and economies of scale in dentistry: Some recent empirical evidence. In: Proceedings of a Conference on Modeling Techniques and Applications in Dentistry, ed. L.J. Brown and J.E. Winslow. U.S. Department of Health and Human Services, Public Health Service, Health Resources Administration, Bureau of Health Professions. DHHS Publication No. (HRA)81-1. Washington, D.C.: U.S. Department of Health and Human Services.
Scheffler, R.M., and Kushman, J.E. 1977. A production function for dental services: Estimation and economic implications. Southern Economic Journal 44:25-35.
Sexton, T.R., Leiken, A.M., Nolan, A.H., Liss, S., Hogan, A., and Silkman, R. 1989. Evaluating managerial efficiency of Veterans Administration medical centers using data envelopment analysis. Medical Care 27(12): 1175-1188.
TABLE 4.1 CDR-Based Actual Physician FTEE and IPF-Derived Predicted FTEE for Direct Patient Care and Resident Education by Specialty at VAMC I, FY 1989
|
|
Physician FTEE Statistics |
|
|
|
Specialties |
Actual1 |
Predicted1 |
95 % Prediction Interval |
|
Medicine |
19.41 |
14.77 |
(6.73, 31.33) |
|
Surgery |
6.91 |
11.73 |
(6.60, 20.17) |
|
Psychiatry |
10.53 |
13.02 |
(6.85, 24.00) |
|
Neurology |
0.96 |
2.75 |
(1.23, 5.28) |
|
Rehabilitation Medicine |
1.90 |
3.51 |
(1.72, 6.54) |
|
Spinal Cord Injury |
2.52 |
1.99 |
(0.80, 4.02) |
|
Anesthesiology |
6.65 |
3.54 |
(1.42, 7.46) |
|
Laboratory Medicine |
1.86 |
4.77 |
(2.53, 8.38) |
|
Diagnostic Radiology |
3.95 |
5.47 |
(2.60, 10.46) |
|
Nuclear Medicine |
1.44 |
1.61 |
(0.77, 2.86) |
|
Radiation Oncology |
2 |
2 |
2 |
|
NOTE: VAMC I = mid-size affiliated. 1 Indudes all physician FTEE for direct care and resident education associated with the specialty's CDR cost center, across all patient care areas (and thus encompassing the emergency and admitting & screening areas of the other physician services PCA); excludes physicians in that specialty who are assigned to a CDR cost center other than the one normally associated with the specialty. 2 VAMC I has no cost center for this specialty. |
|||
TABLE 4.2 CDR-Based Actual Physician FTEE and IPF-Derived Predicted FTEE for Direct Patient Care and Resident Education by Specialty at VAMC II, FY 1989
|
|
Physician FTEE Statistics |
|
|
|
Specialties |
Actual1 |
Predicted1 |
95 % Prediction Interval |
|
Medicine |
44.52 |
43.98 |
(19.99, 96.13) |
|
Surgery |
14.51 |
15.08 |
(8.52, 26.30) |
|
Psychiatry |
19.33 |
22.85 |
(12.16, 42.07) |
|
Neurology |
4.32 |
5.06 |
(2.47, 9.54) |
|
Rehabilitation Medicine |
2.51 |
4.08 |
(2.03, 7.59) |
|
Spinal Cord Injury |
0.76 |
1.61 |
(0.55, 3.39) |
|
Anesthesiology |
5.72 |
7.92 |
(3.59, 16.39) |
|
Laboratory Medicine |
7.16 |
5.88 |
(3.06, 10.68) |
|
Diagnostic Radiology |
13.70 |
9.93 |
(4.92, 19.12) |
|
Nuclear Medicine |
1.92 |
1.68 |
(0.78, 3.07) |
|
Radiation Oncology |
1.21 |
2.86 |
(1.03, 6.32) |
|
NOTE: VAMC II = metro affiliated. 1 Includes all physician FTEE for direct care and resident education associated with the specialty's CDR cost center, across all patient care areas (and thus encompassing the emergency and admitting & screening areas of the other physician services PCA); excludes physicians in that specialty who are assigned to a CDR cost center other than the one normally associated with the specialty. |
|||
TABLE 4.3 CDR-Based Actual Physician FTEE and IPF-Derived Predicted FTEE for Direct Patient Care and Resident Education by Specialty at VAMC III, FY 1989
|
|
Physician FTEE Statistics |
|
|
|
Specialties |
Actual1 |
Predicted1 |
95 % Prediction Interval |
|
Medicine |
23.42 |
16.28 |
(7.23, 35.32) |
|
Surgery |
7.37 |
8.56 |
(4.74, 15.01) |
|
Psychiatry |
8.47 |
12.84 |
(6.68, 24.09) |
|
Neurology |
2 |
2 |
2 |
|
Rehabilitation Medicine |
1.68 |
1.87 |
(0.74, 3.70) |
|
Spinal Cord Injury |
2 |
2 |
2 |
|
Anesthesiology |
1.00 |
1.45 |
(0.30, 3.64) |
|
Laboratory Medicine |
2.00 |
3.25 |
(1.60, 5.99) |
|
Diagnostic Radiology |
4.60 |
3.85 |
(1.68, 7.81) |
|
Nuclear Medicine |
2 |
2 |
2 |
|
Radiation Oncology |
2 |
2 |
2 |
|
NOTE: VAMC III = mid-size general unaffiliated. 1 Includes all physician FTEE for direct care and resident education associated with the specialty's CDR cost center, across all patient care areas (and thus encompassing the emergency and admitting & screening areas of the other physician services PCA); excludes physicians in that specialty who are assigned to a CDR cost center other than the one normally associated with the specialty. 2 VAMC III has no cost center for this specialty. |
|||
TABLE 4.4 CDR-Based Actual Physician FTEE and IPF-Derived Predicted FTEE for Direct Patient Care and Resident Education by Specialty at VAMC IV, FY 1989
|
|
Physician FTEE Statistics |
|
|
|
Specialties |
Actual1 |
Predicted1 |
95 % Prediction Interval |
|
Medicine |
5.22 |
8.77 |
(3.74, 19.14) |
|
Surgery |
2 |
2 |
2 |
|
Psychiatry |
16.38 |
19.06 |
(10.20, 35.03) |
|
Neurology |
1.78 |
1.05 |
(0.23, 2.45) |
|
Rehabilitation Medicine |
1.78 |
1.70 |
(0.61, 3.49) |
|
Spinal Cord Injury |
2 |
2 |
2 |
|
Anesthesiology |
2 |
2 |
2 |
|
Laboratory Medicine |
0.92 |
1.01 |
(0.23, 2.30) |
|
Diagnostic Radiology |
1.51 |
0.97 |
(0.11, 2.51) |
|
Nuclear Medicine |
0.48 |
0.60 |
(0.08, 1.36) |
|
Radiation Oncology |
2 |
2 |
2 |
|
NOTE: VAMC IV =large psychiatric facility. 1 lncludes all physician FTEE for direct care and resident education associated with the specialty's CDR cost center, across all patient care areas (and thus encompassing the emergency and admitting & screening areas of the other physician services PCA); excludes physicians in that specialty who are assigned to a CDR cost center other than the one normally associated with the specialty. 2 VAMC IV has no cost center for this specialty. |
|||
TABLE 4.5 For Medicine, CDR-Based Actual Physician FTEE and PF-Derived Projected FTEE for Direct Patient Care at VAMC II, FY 1989
TABLE 4.6 For Surgery, CDR-Based Actual Physician FTEE and PF-Derived Projected FTEE for Direct Patient Care at VAMC II, FY 1989
TABLE 4.7 For Psychiatry, CDR-Based Actual Physician FTEE and PF-Derived Projected FTEE for Direct Patient Care at VAMC II, FY 1989
TABLE 4.8 For Neurology, CDR-Based Actual Physician FTEE and PF-Derived Projected FTEE for Direct Patient Care at VAMC II, FY 1989
TABLE 4.9 For Rehabilitation Medicine, CDR-Based Actual Physician FTEE and PF-Derived Projected FTEE for Direct Patient Care at VAMC II, FY 1989
TABLE 4.10 For Ambulatory Care, CDR-Based Actual Physician FTEE and PF-Derived Projected FTEE for Direct Patient Care at VAMC II, FY 1989
|
|
Actual Physician FTEE Statistics |
||||||
|
Patient Care Arueas |
MED_MD |
SUR_MD |
PSY_MD |
NEU_MD |
RMS_MD |
OTHER_MD1 |
Total |
|
Medicine |
8.05 |
0.19 |
0.00 |
0.00 |
0.00 |
0.34 |
8.58 |
|
Surgery |
0.28 |
0.94 |
0.00 |
0.04 |
0.00 |
0.19 |
1.45 |
|
Psychiatry |
0.23 |
0.00 |
9.61 |
0.27 |
0.00 |
0.13 |
10.24 |
|
Neurology |
0.00 |
0.00 |
0.00 |
0.56 |
0.00 |
0.00 |
0.56 |
|
Rehabilitative Medicine |
0.06 |
0.03 |
0.00 |
0.00 |
1.15 |
0.05 |
1.29 |
|
Other Physician Services |
12.47 |
2.96 |
0.00 |
0.00 |
0.01 |
8.05 |
23.49 |
|
Total |
21.09 |
4.12 |
9.61 |
0.87 |
1.16 |
8.76 |
45.61 |
|
|
Projected Physician FTEE Statistics |
||||||
|
Patient Care Areas |
MED_MD |
SUR_MD |
PSY_MD |
NEU_MD |
RMS_MD |
OTHER_MD1 |
Total |
|
Medicine |
10.61 |
0.00 |
0.00 |
0.00 |
0.00 |
0.45 |
11.06 |
|
Surgery |
0.00 |
1.70 |
0.00 |
0.00 |
0.00 |
0.00 |
1.70 |
|
Psychiatry |
0.00 |
0.00 |
7.27 |
0.00 |
0.00 |
0.00 |
7.27 |
|
Neurology |
0.00 |
0.00 |
0.00 |
1.77 |
0.00 |
0.00 |
1.77 |
|
Rehabilitative Medicine |
0.00 |
0.00 |
0.00 |
0.00 |
0.39 |
0.00 |
0.39 |
|
Other Physician Services |
9.59 |
0.00 |
0.00 |
0.00 |
0.00 |
3.53 |
13.12 |
|
Total |
20.20 |
1.70 |
7.27 |
1.77 |
0.39 |
3.98 |
35.31 |
|
NOTE: See text for identification of terms; VAMC II = metro affiliated. 1 Includes all physician direct care FTEE not reflected already in MED_MD, SUR_MD, PSY_MD, NEU_MD, and RMS_MD. |
|||||||
TABLE 4.11 For Long-Term Care, CDR-Based Actual Physician FTEE and PF-Derived Projected FTEE for Direct Patient Care at VAMC II, FY 1989
|
|
Actual Physician FTEE Statistics |
|||||||
|
Patient Care Areas |
MED_MD |
SUR_MD |
PSY_MD |
NEU_MD |
RMS_MD |
INT_MD |
OTHER_MD1 |
Total |
|
Nursing Home |
0.68 |
0.00 |
0.00 |
0.00 |
0.25 |
0.00 |
0.07 |
1.00 |
|
Intermediate Care |
0.11 |
0.03 |
0.00 |
0.25 |
0.14 |
0.00 |
0.03 |
0.56 |
|
Total |
0.79 |
0.03 |
0.00 |
0.25 |
0.39 |
0.00 |
0.10 |
1.56 |
|
|
Projected Physician FTEE Statistics |
|||||||
|
Patient Care Areas |
MED_MD |
SUR_MD |
PSY_MD |
NEU_MD |
RMS_MD |
INT_MD |
OTHER MD1 |
Total |
|
Nursing Home |
0.60 |
0.00 |
0.00 |
0.00 |
0.22 |
0.00 |
0.06 |
0.88 |
|
Intermediate Care |
0.18 |
0.00 |
0.00 |
0.00 |
0.23 |
0.00 |
0.05 |
0.46 |
|
Total |
0.78 |
0.00 |
0.00 |
0.00 |
0.45 |
0.00 |
0.11 |
1.34 |
|
NOTE: See text for identification of terms; VAMC II = metro affiliated. 1 Includes all physician direct care FTEE not reflected already in MED_MD, SUR_MD, PSY_MD, NEU_MD, RMS_MD, and INT_MD. |
||||||||
TABLE 4.12 CDR-Based Actual Workload and PF-Derived Predicted Workload in Selected Patient Care Areas of VAMC I, FY 1989
|
|
Workload Statistics |
||
|
Patient Care Areas |
Actual |
Predicted |
95% Prediction Interval |
|
Inpatient |
|
|
|
|
Medicine1 |
3,400 |
3,585 |
(2,396, 5,337) |
|
Inpatient |
|
|
|
|
Surgery1 |
4,481 |
3,185 |
(2,221, 4,600) |
|
Inpatient |
|
|
|
|
Psychiatry2 |
23,090 |
21,404 |
(9,896, 46,165) |
|
Ambulatory |
|
|
|
|
Medicine3 |
3,541,283 |
3,815,567 |
(1,567,511, 9,202,630) |
|
Nursing |
|
|
|
|
Home4 |
15,201 |
20,676 |
(10,279, 41,855) |
|
NOTE: VAMC I = mid-size affiliated. 1 Workload expressed in Weighted Work Units (WWUs). 2 Workload expressed in Bed-Days of Care (BDOC). 3 Workload expressed in Capitation Weighted Work Units (CAPWWUs). 4 Workload expressed in Resource Utilization Group Weighted Work Units (RUGWWUs). |
|||
TABLE 4.13 CDR-Based Actual Workload and PF-Derived Predicted Workload in Selected Patient Care Areas of VAMC II, FY 1989
|
|
Workload Statistics |
||
|
Patient Care Areas |
Actual |
Predicted |
95% Prediction Interval |
|
Inpatient |
|
|
|
|
Medicine1 |
7,484 |
6,919 |
(4,604, 10,352) |
|
Inpatient |
|
|
|
|
Surgery1 |
6,467 |
5,932 |
(4,084, 8,642) |
|
Inpatient |
|
|
|
|
Psychiatry2 |
78,401 |
61,980 |
(28,481, 133,688) |
|
Ambulatory |
|
|
|
|
Medicine3 |
9,705,467 |
5,258,203 |
(2,171,655, 12,854,502) |
|
Nursing |
|
|
|
|
Home4 |
63,665 |
67,466 |
(33,793, 134,910) |
|
NOTE: VAMC II = metro affiliated. 1 Workload expressed in Weighted Work Units (WWUs). 2 Workload expressed in Bed Days of Care (BDOC). 3 Workload expressed in Capitation Weighted Work Units (CAPWWUs). 4 Workload expressed in Resource Utilization Group Weighted Work Units (RUGWWUs). |
|||
TABLE 4.14 CDR-Based Actual Workload and PF-Derived Predicted Workload in Selected Patient Care Areas of VAMC III, FY 1989
|
|
Workload Statistics |
||
|
Patient Care Areas |
Actual |
Predicted |
95 % Prediction Interval |
|
Inpatient |
|
|
|
|
Medicine1 |
2,115 |
2,121 |
(1,427, 3,157) |
|
Inpatient |
|
|
|
|
Surgery1 |
2,674 |
2,378 |
(1,636, 3,430) |
|
Inpatient |
|
|
|
|
Psychiatry2 |
97,723 |
48,054 |
(21,699, 106,413) |
|
Ambulatory |
|
|
|
|
Medicine3 |
5,664,334 |
2,352,995 |
(940,343, 5,871,280) |
|
Nursing |
|
|
|
|
Home4 |
26,146 |
33,292 |
(16,515, 66,733) |
|
NOTE: VAMC III = mid-size general unaffiliated. 1 Workload expressed in Weighted Work Units (WWUs). 2 Workload expressed in Bed-Days of Care (BDOC). 3 Workload expressed in Capitation Weighted Work Units (CAPWWUs). 4 Workload expressed in Resource Utilization Group Weighted Work Units (RUGWWUs). |
|||
TABLE 4.15 CDR-Based Actual Workload and PF-Derived Predicted Workload in Selected Patient Care Areas of VAMC IV, FY 1989
|
|
Workload Statistics |
||
|
Patient Care Areas |
Actual |
Predicted |
95% Prediction Interval |
|
Inpatient |
|
|
|
|
Medicine1 |
1,633 |
1,818 |
(1,214, 2,746) |
|
Inpatient |
|
|
|
|
Surgery1 |
5 |
5 |
5 |
|
Inpatient |
|
|
|
|
Psychiatry2 |
110,757 |
92,595 |
(35,954, 240,334) |
|
Ambulatory |
|
|
|
|
Medicine3 |
255,454 |
733,584 |
(295,079, 1,839,729) |
|
Nursing |
|
|
|
|
Home4 |
85,314 |
49,493 |
(24,760, 99,056) |
|
NOTE: VAMC IV = psychiatric. 1 Workload expressed in Weighted Work Units (WWUs). 2 Workload expressed in Bed-Days of Care (BDOC). 3 Workload expressed in Capitation Weighted Work Units (CAPWWUs). 4 Workload expressed in Resource Utilization Group Weighted Work Units (RUGWWUs). 5 PCA not found at VAMC IV. |
|||
TABLE 4.16 IPF-Derived Predictions of Physician Requirements for Direct Patient Care and Resident Education by Specialty at VAMC I, FYs 2000 and 20051
TABLE 4.17 IPF-Derived Predictions of Physician Requirements for Direct Patient Care and Resident Education by Specialty at VAMC II, FYs 2000 and 20051
TABLE 4.18 IPF-Derived Predictions of Physician Requirements for Direct Patient Care and Resident Education by Specialty at VAMC III, FYs 2000 and 20051
|
|
FY 2000 |
FY 2005 |
||
|
Specialties |
Predicted FTEE Requirements |
95% Prediction Intervals |
Predicted FTEE Requirements |
95% Prediction Interval |
|
Medicine |
17.47 |
(7.78, 38.14) |
17.01 |
(7.52, 37.01) |
|
Surgery |
9.03 |
(5.04, 15.81) |
8.60 |
(4.73, 15.02) |
|
Psychiatry |
10.53 |
(5.44, 19.45) |
9.08 |
(4.65, 16.95) |
|
Neurology |
2.16 |
(0.79, 4.56) |
2.15 |
(0.79, 4.56) |
|
Rehabilitation |
|
|
|
|
|
Medicine |
2.05 |
(0.82, 4.10) |
1.50 |
(0.50, 3.20) |
|
Spinal Cord Injury |
0.57 |
(0.02, 1.77) |
0.57 |
(0.02, 1.77) |
|
Anesthesiology |
1.68 |
(0.42, 4.11) |
1.63 |
(0.39, 4.01) |
|
Laboratory Medicine |
3.05 |
(1.48, 5.63) |
3.00 |
(1.45, 5.57) |
|
Diagnostic Radiology |
4.27 |
(1.90, 8.56) |
4.16 |
(1.84, 8.37) |
|
Nuclear Medicine |
1.00 |
(0.36, 1.92) |
0.99 |
(0.36, 1.92) |
|
Radiation Oncology |
1.28 |
(0.18, 3.37) |
1.22 |
(0.15, 3.29) |
|
NOTE: VAMC III = mid-size general unaffiliated. 1 Includes all physician FTEE for direct care and resident education associated with the specialty's CDR cost center, across all patient care areas (and thus encompassing the emergency and admitting & screening areas of the other physician services PCA); excludes physicians in that specialty who are assigned to a CDR cost center other than the one normally associated with the specialty. 2 Lower bound truncated at 0. |
||||
TABLE 4.19 IPF-Derived Predictions of Physician Requirements for Direct Patient Care and Resident Education by Specialty at VAMC IV, FYs 2000 and 20051
|
|
FY 2000 |
FY 2005 |
||
|
Specialties |
Predicted FTEE Requirements |
95% Prediction Intervals |
Predicted FTEE Requirements |
95% Prediction Interval |
|
Medicine |
10.33 |
(4.52, 22.37) |
10.25 |
(4.47, 22.14) |
|
Surgery |
0.02 |
(0.0, 0.0)2 |
0.02 |
(0.0, 0.0)2 |
|
Psychiatry |
20.45 |
(10.96, 37.48) |
20.38 |
(10.92, 37.35) |
|
Neurology |
0.92 |
(0.14, 2.22) |
1.46 |
(0.46, 3.13) |
|
Rehabilitation |
|
|
|
|
|
Medicine |
2.00 |
(0.78, 4.07) |
1.97 |
(0.76, 4.02) |
|
Spinal Cord Injury |
0.57 |
(0.03, 1.77) |
0.57 |
(0.03, 1.77) |
|
Anesthesiology |
0.45 |
(0.03, 1.76) |
0.45 |
(0.03, 1.76) |
|
Laboratory Medicine |
1.32 |
(0.40, 2.84) |
1.36 |
(0.43, 2.90) |
|
Diagnostic Radiology |
1.14 |
(0.20, 2.81) |
1.16 |
(0.21, 2.85) |
|
Nuclear Medicine |
0.69 |
(0.14, 1.49) |
0.69 |
(0.15, 1.47) |
|
Radiation Oncology |
0.30 |
(0.03, 1.42) |
0.27 |
(0.03, 1.37) |
|
NOTE: VAMC IV = psychiatric. 1 Includes all physician FTEE for direct care and resident education associated with the specialty's CDR cost center, across all patient care areas (and thus encompassing the emergency and admitting & screening areas of the other physician services PCA); excludes physicians in that specialty who are assigned to a CDR cost center other than the one normally associated with the specialty. 2 Since VAMC IV had no surgery service and no recorded surgeon FTEE in FY 1989, it was deemed most reasonable to assign 0 FTEE for FY 2000 and FY 2005. Of course, if the mission and case mix of VAMC IV were to change in certain ways by the end of the century, it might well become reasonable to ''predict'' positive levels of surgeon FTEE for these two years. 3 Lower bound truncated at 0. |
||||
TABLE 4.20 PF-Derived Projections of Physician Requirements for Direct Patient Care, by PCA, in Seven Specialty Categories at VAMC I, FY 2000
TABLE 4.21 PF-Derived Projections of Physician Requirements for Direct Patient Care, by PCA, in Seven Specialty Categories at VAMC I, FY 2005
TABLE 4.22 PF-Derived Projections of Physician Requirements for Direct Patient Care, by PCA, in Seven Specialty Categories at VAMC II, FY 2000
TABLE 4.23 PF-Derived Projections of Physician Requirements for Direct Patient Care, by PCA, in Seven Specialty Categories at VAMC II, FY 2005
TABLE 4.24 PF-Derived Projections of Physician Requirements for Direct Patient Care, by PCA, in Seven Specialty Categories at VAMC III, FY 2000
TABLE 4.25 PF-Derived Projections of Physician Requirements for Direct Patient Care, by PCA, in Seven Specialty Categories at VAMC III, FY 2005
TABLE 4.26 PF-Derived Projections of Physician Requirements for Direct Patient Care, by PCA, in Seven Specialty Categories at VAMC IV, FY 2000
|
|
Projected Physician FTEE Requirements for FY 2000 |
|||||||
|
Patient Care Areas |
MED_MD |
SUR_MD |
PSY_MD |
NEU_MD |
RMS_MD |
SCI_MD |
OTHER_MD |
Total |
|
Inpatient |
|
|
|
|
|
|
|
|
|
Medicine |
5.07 |
0.00 |
0.71 |
0.40 |
0.00 |
0.00 |
0.00 |
6.18 |
|
Surgery |
0.00 |
0.00 |
0.00 |
0.00 |
0.00 |
0.00 |
0.00 |
0.00 |
|
Psychiatry |
0.00 |
0.00 |
19.49 |
0.00 |
0.00 |
0.00 |
0.00 |
19.49 |
|
Neurology |
0.00 |
0.00 |
0.00 |
0.15 |
0.00 |
0.00 |
0.00 |
0.15 |
|
Rehabilitation Medicine |
0.00 |
0.00 |
0.00 |
0.00 |
0.72 |
0.00 |
0.00 |
0.72 |
|
Spinal Cord Injury |
0.00 |
0.00 |
0.00 |
0.00 |
0.00 |
0.00 |
0.00 |
0.00 |
|
Subtotal |
5.07 |
0.00 |
20.20 |
0.55 |
0.72 |
0.00 |
0.00 |
26.54 |
|
Ambulatory |
|
|
|
|
|
|
|
|
|
Medicine |
0.001 |
0.00 |
0.00 |
0.00 |
0.00 |
0.00 |
0.00 |
0.00 |
|
Surgery |
0.00 |
0.001 |
0.00 |
0.00 |
0.00 |
0.00 |
0.00 |
0.00 |
|
Psychiatry |
0.00 |
0.00 |
0.21 |
0.00 |
0.00 |
0.00 |
9.75 |
9.96 |
|
Neurology |
0.00 |
0.00 |
0.00 |
0.00 |
0.00 |
0.00 |
0.00 |
0.00 |
|
Rehabilitation Medicine |
0.00 |
0.00 |
0.00 |
0.00 |
0.21 |
0.00 |
0.00 |
0.21 |
|
Other Physicians Services |
0.00 |
0.00 |
0.20 |
0.00 |
0.00 |
0.00 |
0.65 |
0.85 |
|
Subtotal |
0.00 |
0.00 |
0.41 |
0.00 |
0.21 |
0.00 |
10.40 |
11.02 |
|
Long-Term Care |
|
|
|
|
|
|
|
|
|
Nursing Home |
0.08 |
0.00 |
0.00 |
0.00 |
0.29 |
0.00 |
1.81 |
2.18 |
|
Intermediate Care |
0.18 |
0.00 |
0.00 |
0.00 |
0.40 |
0.00 |
22.88 |
23.46 |
|
Subtotal |
0.26 |
0.00 |
0.00 |
0.00 |
0.69 |
0.00 |
24.69 |
25.64 |
|
Total |
5.33 |
0.00 |
20.61 |
0.55 |
1.62 |
0.00 |
35.09 |
63.19 |
|
NOTE: VAMC IV = psychiatric. 1 Actual projected FTEE estimate was slightly negative, because projected workload for this PCA for FY 2000 was significantly different than what PF would predict for the PCA, given its attributes. Put differently, the PCA in this facility is an "outlier" (see Chapter 7) and FTEE projections derived for it must be regarded with caution. |
||||||||
TABLE 4.27 PF-Derived Projections of Physician Requirements for Direct Patient Care, by PCA, in Seven Specialty Categories at VAMC IV, FY 2005
|
|
Projected Physician FTEE Requirements for FY 2005 |
|||||||
|
Patient Care Areas |
MED_MD |
SUR_MD |
PSY_MD |
NEU_MD |
RMS_MD |
SCI_MD |
OTHER_MD |
Total |
|
Inpatient |
|
|
|
|
|
|
|
|
|
Medicine |
4.99 |
0.00 |
0.70 |
0.39 |
0.00 |
0.00 |
0.00 |
6.08 |
|
Surgery |
0.00 |
0.00 |
0.00 |
0.00 |
0.00 |
0.00 |
0.00 |
0.00 |
|
Psychiatry |
0.00 |
0.00 |
19.71 |
0.00 |
0.00 |
0.00 |
0.00 |
19.71 |
|
Neurology |
0.00 |
0.00 |
0.00 |
0.16 |
0.00 |
0.00 |
0.00 |
0.16 |
|
Rehabilitation Medicine |
0.00 |
0.00 |
0.00 |
0.00 |
0.73 |
0.00 |
0.00 |
0.73 |
|
Spinal Cord Injury |
0.00 |
0.00 |
0.00 |
0.00 |
0.00 |
0.00 |
0.00 |
0.00 |
|
Subtotal |
4.99 |
0.00 |
20.41 |
0.55 |
0.73 |
0.00 |
0.00 |
26.68 |
|
Ambulatory |
|
|
|
|
|
|
|
|
|
Medicine |
0.001 |
0.00 |
0.00 |
0.00 |
0.00 |
0.00 |
0.001 |
0.00 |
|
Surgery |
0.001 |
0.00 |
0.001 |
0.00 |
0.00 |
0.00 |
0.00 |
0.00 |
|
Psychiatry |
0.00 |
0.00 |
0.21 |
0.00 |
0.00 |
0.00 |
9.96 |
9.96 |
|
Neurology |
0.00 |
0.00 |
0.00 |
0.00 |
0.00 |
0.00 |
0.00 |
0.00 |
|
Rehabilitation Medicine |
0.00 |
0.00 |
0.00 |
0.00 |
0.22 |
0.00 |
0.00 |
0.22 |
|
Other Physicians Services |
0.00 |
0.00 |
0.21 |
0.00 |
0.00 |
0.00 |
0.68 |
0.89 |
|
Subtotal |
0.00 |
0.00 |
0.42 |
0.00 |
0.22 |
0.00 |
10.64 |
11.28 |
|
Long-Term Care |
|
|
|
|
|
|
|
|
|
Nursing Home |
0.08 |
0.00 |
0.00 |
0.00 |
0.28 |
0.00 |
1.75 |
2.11 |
|
Intermediate Care |
0.19 |
0.00 |
0.00 |
0.00 |
0.42 |
0.00 |
23.68 |
24.29 |
|
Subtotal |
0.27 |
0.00 |
0.00 |
0.00 |
0.70 |
0.00 |
25.43 |
26.40 |
|
Total |
5.26 |
0.00 |
20.83 |
0.55 |
1.65 |
0.00 |
36.07 |
64.36 |
|
NOTE: VAMC IV = psychiatric. 1 Actual projected FTEE estimate was slightly negative, because projected workload for this PCA for FY 2005 was significantly different from what PF would predict for the PCA, given its attributes. Put differently, the PCA in this facility is an "outlier" (see Chapter 7) and FTEE projections derived for it must be regarded with caution. |
||||||||

