
Appendix E-7
American Mathematical Society Written Testimony
A Demographic Profile of the Faculty in Fall 201018
The following tables provide estimates of the numbers of faculty in various categories within departments housing the undergraduate mathematical sciences programs at two-year and four-year colleges and universities in the US. These tables are taken from a publication in preparation by the American Mathematical Society as part of the report of the 2010 Conference Board of the Mathematical Sciences Survey of Undergraduate Program in the Mathematical Sciences. The reported is scheduled for publication and distribution in September 2012. This project is supported by a grant from the National Science Foundation.
The tables provided are those that provide a view of the gender breakout of the faculty in various appointment categories and also the gender by race/ethnicity where available.
The numbers that appear throughout these tables are estimates based on the responses to a survey distributed to approximately 600 institutions selected as part of a stratified random sample of mathematics departments at the approximately 1400 four-year institutions and 1000 public two-year institutions in the US. Some of the tables for the four-year faculty also provide data for a subdivision of the mathematics departments according to the highest mathematics degree awarded by the department. There are approximately 200 PhD-granting mathematics departments, 180 master’s-granting mathematics departments, and 1000 bachelor’s-granting mathematics departments. In addition, data on the faculty at 78 departments of statistics which house undergraduate programs in statistics are also provided.
The first seven tables describe the mathematics and statistics faculty at four-year colleges and universities, and the final seven are for public two-year colleges.
Questions about these tables should be directed to Dr. James Maxwell, Associate Executive Director, AMS, jwm@ams.org and 401-455-4035.
__________________
18 Questions about data tables should be directed to Dr. James Maxwell, Associate Executive Director, AMS, jwm@ams.org and 401-455-4035.
Table E-7-1 Number of faculty, and of female faculty (F), of mathematics departments combined and of statistics departments combined in fall 2010. Postdocs are included within Other Full-time counts. (Fall 2005 figures are in parenthesis for Math Departments combined but are not available for Masters Statistics Departments.)
| Tenured | Tenure-eligible | OFT | Postdocs | Total Full-time | Total Part-time | |
| Mathematics Depts | Univ (Ph.D.) + Univ (MA) + Coll (BA) | |||||
| Total Mathematics | 12,747 | 3,617 | 5,929 | 1,025 | 22,293 | 6,050 |
| (12,875) | (4,381) | (4,629) | (819) | (21,885) | (6,536) | |
| Total Mathematics (F) | 2,740 | 1,227 | 2,449 | 233 | 6,416 | 2,678 |
| (2,332) | (1,250) | (2,059) | (191) | (5,641) | (2,578) | |
| Statistics Depts | Univ. (Ph.D.) + Univ (MA) | |||||
| Total Statistics | 727 | 267 | 272 | 86 | 1266 | 133 |
| (NA) | (NA) | (NA) | (NA) | (NA) | ||
| Total Statistics (F) | 117 | 102 | 108 | 24 | 327 | 32 |
| (NA) | (NA) | (NA) | (NA) | (NA) | ||
Table E-7-2 Percentage of gender and of racial/ethnic groups among all tenured, tenure-eligible, postdoctoral and other full time faculty in mathematics departments of four-year colleges and universities in fall 2010.
| Mathematics Departments | Asian | Black, not Hispanic | Mexican American/Puerto Rican/other Hispanic | White, not Hispanic | Other / Unknown |
| percent | percent | percent | percent | percent | |
| Tenured Men | 6 | 1 | 1 | 36 | 1 |
| Tenured Women | 1 | 0 | 0 | 10 | 0 |
| Tenure-eligible men | 2 | 0 | 0 | 7 | 0 |
| Tenure eligible women | 1 | 0 | 0 | 4 | 0 |
| Postdoctoral men | 1 | 0 | 0 | 2 | 0 |
| Postdoctoral women | 0 | 0 | 0 | 1 | 0 |
| Full-time men not included above | 1 | 1 | 0 | 10 | 1 |
| Full-time women not included above | 1 | 0 | 0 | 9 | 1 |
| Total full-time men | 9 | 2 | 2 | 56 | 2 |
| Total full-time women | 3 | 1 | 1 | 23 | 1 |
Notes: The column “Other/Unknown” includes the federal categories Native American/Alaskan Native and Native Hawaiian/Other Pacific Islander. 0 means less than half of 1 percent and this may cause apparent column sum inconsistencies.
Table E-7-3 Percentage of gender and racial/ethnic groups among all tenured, tenure-eligible, postdoctoral, and other full-time faculty in doctoral and masters statistics departments (combined) at universities in fall 2010.
| All statistics Departments | Asian | Black, not Hispanic | Mexican American/Puerto Rican/other Hispanic | White, not Hispanic | Other /Unknown |
| percent | percent | percent | percent | percent | |
| Tenured Men | 11 | 0 | 1 | 34 | 2 |
| Tenured Women | 2 | 0 | 0 | 6 | 1 |
| Tenure-eligible men | 5 | 1 | 0 | 6 | 1 |
| Tenure eligible women | 5 | 0 | 0 | 3 | 0 |
| Postdoctoral men | 3 | 0 | 0 | 3 | 0 |
| Postdoctoral women | 0 | 0 | 0 | 1 | 0 |
| Full-time men not included above | 1 | 0 | 0 | 6 | 0 |
| Full-time women not included above | 1 | 0 | 0 | 5 | 1 |
| Total full-time men | 20 | 1 | 1 | 49 | 3 |
| Total full-time women | 8 | 0 | 1 | 15 | 2 |
Notes: The column “Other/Unknown” includes the federal categories Native American/Alaskan Native and Native Hawaiian/Other Pacific Islander. 0 means less than half of 1 percent and this may cause apparent column sum inconsistencies.
Table E-7-4 Number of tenured, tenure-eligible, postdoctoral, and other full-time faculty in mathematics departments at four-year colleges and universities by gender and type of department in fall 2010. (Note: Postdoctoral faculty are included in other full-time totals.)
| Univ(PhD) | Univ (MA) | Coll (BA) | Total | |||||||||||||
| Tenured | Tenure-eligible | Other full time | Post-docs | Tenured | enure-eligible | Other full time | Post-docs | Tenured | enure-eligible | Other full time | Post-docs | Tenured | enure-eligible | Other full time | Post-docs | |
| Men, 2010 | 4096 | 724 | 1549 | 775 | 1829 | 490 | 470 | 10 | 4082 | 1175 | 1461 | 6 | 10007 | 2390 | 3480 | 792 |
| Women, 2010 | 525 | 270 | 946 | 226 | 605 | 284 | 516 | 7 | 1611 | 673 | 987 | 0 | 2740 | 1227 | 2449 | 233 |
| Total, 2010 | 4621 | 994 | 2495 | 1001 | 2434 | 775 | 986 | 18 | 5693 | 1848 | 2448 | 6 | 12747 | 3617 | 5929 | 1025 |
| Men, 2005 | 4292 | 713 | 1314 | 616 | 2011 | 682 | 495 | 4 | 4239 | 1737 | 761 | 8 | 10542 | 3132 | 2570 | 628 |
| Women, 2005 | 427 | 220 | 735 | 148 | 532 | 337 | 532 | 2 | 1373 | 693 | 792 | 41 | 2332 | 1250 | 2059 | 191 |
| Total, 2005 | 4719 | 933 | 2049 | 764 | 2544 | 1019 | 1027 | 7 | 5612 | 2429 | 1553 | 48 | 12874 | 4382 | 4629 | 819 |
Notes: A postdoctoral appointment is a temporary position primarily intended to provide an opportunity to extend graduate training or to further research experience. Postdoctoral faculty are included in the other full-time faculty totals throughout CBMS2010. This contrasts with publications of the AMS-ASA-IMS-MAA-SIAM Annual Survey since 2003, which list postdoctoral faculty as a category separate from other full-time faculty. Before 2003, separate counts of postdoctoral faculty were not collected by the Annual Survey. Round-off may make marginal totals seem inaccurate.
Table E-7-5 Number of tenured, tenure-eligible, other full-time, and postdoctoral faculty in statistics departments, by gender, in fall 2010 and 2005. (Postdoctoral faculty are included in other full-time faculty totals. Data for Masters Statistics Departments was not collected in 2005.)
| Doctoral Statistics Departments | Masters Statistics Departments | Total | ||||||||||
| Tenured | Tenure-eligible | Other full time | Post-docs | Tenured | Tenure-eligible | Other full time | Post-docs | Tenured | Tenure-eligible | Other full time | Post-docs | |
| Men, 2010 | 485 | 125 | 133 | 53 | 125 | 40 | 31 | 9 | 610 | 165 | 164 | 62 |
| Women, 2010 | 95 | 84 | 82 | 18 | 22 | 18 | 26 | 7 | 117 | 102 | 108 | 24 |
| Total, 2010 | 580 | 209 | 215 | 71 | 147 | 57 | 57 | 15 | 727 | 267 | 272 | 86 |
| Men, 2005 | 525 | 113 | 97 | 35 | na | na | na | na | na | na | na | na |
| Women, 2005 | 79 | 66 | 66 | 16 | na | na | na | na | na | na | na | na |
| Total, 2005 | 604 | 179 | 163 | 51 | na | na | na | na | na | na | na | na |
Notes: A postdoctoral appointment is a temporary position primarily intended to provide an opportunity to extend graduate training or to further research experience. Postdoctoral faculty are included in the other full-time faculty totals throughout CBMS2010. This contrasts with publications of the AMS-ASA-IMS-MAA-SIAM Annual Survey since 2003, which list postdoctoral faculty as a category separate from other full-time faculty. Before 2003, separate counts of postdoctoral faculty were not collected by the Annual Survey.
Table E-7-6 Percentages of full-time faculty belonging to various ethnic groups, by gender and type of department, in fall 2010. Except for round-off, the percentages within each departmental type sum to 100 percent.
| Percentage of full-time faculty | |||||
| Asian % | Black, not Hispanic % | Mexican American/Puerto Rican/Other Hispanic % | White, not Hispanic % | Other/Unknown % | |
| PhD Mathematics Departments | |||||
| All full-time men | 13 | 1 | 2 | 59 | 3 |
| All full-time women | 4 | 0 | 1 | 16 | 1 |
| MA Mathematics Departments | |||||
| All full-time men | 12 | 4 | 2 | 47 | 2 |
| All full-time women | 5 | 2 | 1 | 26 | 1 |
| BA Mathematics Departments | |||||
| All full-time men | 4 | 2 | 2 | 57 | 2 |
| All full-time women | 2 | 1 | 1 | 28 | 1 |
| Combined Statistics Departments | |||||
| All full-time men | 20 | 1 | 1 | 49 | 3 |
| All full-time women | 8 | 0 | 1 | 15 | 2 |
Notes: The column “Other/Unknown” includes the federal categories Native American/Alaska Native and Native Hawaiian/Other Pacific Islander. Zero means less than one-half of one percent.
Table E-7-7 Percentages of part-time faculty belonging to various ethnic groups, by gender and type of department, in fall 2010. Except for round-off, the percentages within each departmental type sum to 100 percent.
| Percentage of full-time faculty | |||||
| Asian % | Black, not Hispanic % | Mexican American/Puerto Rican/Other Hispanic % | White, not Hispanic % | Other/Unknown % | |
| PhD Mathematics Departments | |||||
| All full-time men | 5 | 2 | 1 | 46 | 6 |
| All full-time women | 4 | 1 | 1 | 30 | 3 |
| MA Mathematics Departments | |||||
| All part-time men | 3 | 4 | 2 | 38 | 11 |
| All part-time women | 3 | 3 | 2 | 27 | 7 |
| BA Mathematics Departments | |||||
| All part-time men | 2 | 1 | 0 | 43 | 8 |
| All part-time women | 1 | 1 | 0 | 38 | 5 |
| Combined Statistics Departments | |||||
| All part-time men | 3 | 4 | 0 | 64 | 5 |
| All part-time women | 1 | 0 | 0 | 19 | 4 |
Notes: The column “Other/Unknown” includes the federal categories Native American/Alaska Native and Native Hawaiian/Other Pacific Islander. Zero means less than one-half of one percent.
Faculty at Public Two-year Colleges
Table E-7-8 Percentage of full-time permanent faculty and part-time faculty in mathematics programs at public two-year colleges by gender, in fall 2010. Also master’s degrees in mathematics and statistics granted in the U.S. to citizens and resident aliens, by gender, in 2008-09. Part-time faculty paid by a third party are not included.
| Percentage of | |||
| Full-time permanent faculty | Part-time faculty | Masters degrees in mathematics and statistics granted in the U.S. in 2008-09 to citizens and resident aliens* | |
| Men | 50 | 51 | 59 |
| Women | 50 | 49 | 41 |
| Total | 100% | 100% | 100% |
| Number | 9790 | 23453 | 3137 |
Notes: * denotes the data source of that column is from Report Table 65 from IPEDS Fall 2009 Compendium Tables, National Center for Education Statistics. nces.ed.gov/library/ipeds_com.asp. (These figures include resident aliens but do not include a total of 2074 nonresident aliens who also received masters degrees.)
Table E-7-9 Percentage and number of ethnic minority full-time permanent faculty in mathematics programs at two-year colleges in fall 1995, 2000, 2005, and 2010.
| 1995 | 2000 | 2005 | 2010 | |
| Percentage of ethnic minorities among full-time permanent faculty | 13% | 13% | 14% | 16% |
| Number of full-time permanent ethnic minority faculty | 948 | 909 | 1198 | 1566 |
| Number of full-time permanent faculty | 7578 | 6960 | 8793 | 9790 |
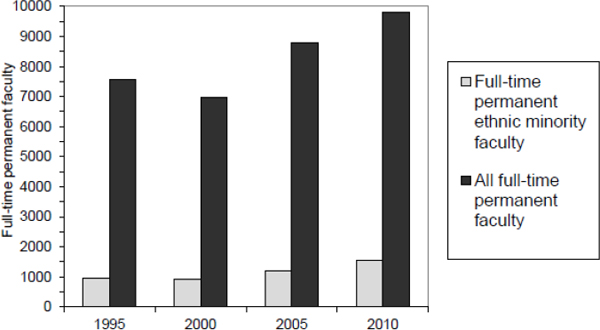
Figure E-7-1 Number of ethnic minority full-time permanent faculty and number of all full-time permanent faculty in mathematics programs at two-year colleges in fall 1995, 2000, 2005, and 2010.
Table E-7-10 Percentage of full-time permanent faculty in mathematics programs at two-year colleges by ethnicity, in fall 1995, 2000, 2005, and 2010.
| Percentage of full-time permanent faculty | ||||
| Ethnic Group | 1995 | 2000 | 2005 | 2010 |
| American Indian/Eskimo/Aleut | 0 | 1 | 0 | 0 |
| Asian/Pacific Islander | 4 | 4 | 6 | 6 |
| Black (non-Hispanic) | 5 | 5 | 5 | 6 |
| Mexican American / Puerto Rican / Other Hispanic | 3 | 3 | 3 | 4 |
| White (non-Hispanic) | 87 | 85 | 84 | 79 |
| Status unknown | 1 | 2 | 2 | 5 |
| Number of full-time permanent faculty | 100% | 100% | 100% | 100% |
| 7578 | 6960 | 8793 | 9790 | |
Notes: Zero means less than half of one percent.
Table E-7-11 Number and percentage of full-time permanent faculty in mathematics programs at two-year colleges by ethnic group and percentage of women within each ethnic group, in fall 2010.
| Ethnic Group | Number of full-time permanent faculty | Percentage of ethnic group in full-time permanent faculty | Percentage of women in ethnic group |
| American Indian/Eskimo/Aleut | 20 | 0 | 63 |
| Asian | 605 | 6 | 48 |
| Native Hawaiian, Pacific Islander | 42 | 0 | 49 |
| Black or African American (non-Hispanic) | 544 | 6 | 37 |
| Mexican American / Puerto Rican / Other Hispanic | 356 | 4 | 34 |
| White (non-Hispanic) | 7733 | 79 | 52 |
| Status unknown | 490 | 5 | 50 |
| Total | 9790 | 100% | 50% |
Notes: Zero means less than half of one percent.
Table E-7-12 Percentage of ethnic minority part-time faculty in mathematics programs at public two-year colleges, in fall 2005 and 2010.
| 2000 | 2005 | 2010 | |
| Percentage of ethnic minorities among part-time faculty | 13 | 16 | 17 |
| Number of part-time faculty | 14887 | 18227 | 23453 |
Table E-7-13 Number and percentage of part-time faculty in mathematics programs at public two-year colleges by ethnic group and percentage of women within each ethnic group, in fall 2010.
| Ethnic Group | Number of part-time faculty | Percentage of ethnic group among part-time faculty | Percentage of women within ethnic group |
| American Indian/Eskimo/Aleut | 44 | 0 | 6 |
| Asian | 1341 | 6 | 49 |
| Native Hawaiian, Pacific Islander | 59 | 0 | 34 |
| Black or African American (non-Hispanic) | 1796 | 8 | 36 |
| Mexican American / Puerto Rican / Other Hispanic | 762 | 3 | 44 |
| White (non-Hispanic) | 18105 | 77 | 51 |
| Status unknown | 1346 | 6 | 46 |
| Total | 23453 | 100% | 49% |
American Mathematical Society Committee on the Profession Award for Mathematics Programs that Make a Difference19
This Award for Mathematics Programs that Make a Difference was established in 2005 by the AMS's Committee on the Profession to compile and publish a series of profiles of programs that:
• aim to bring more persons from under-represented minority backgrounds into some portion of the pipeline beginning at the undergraduate level and leading to advanced degrees in mathematics and professional success, or retain them once in the pipeline;
• have achieved documentable success in doing so; and
• are replicable models.
Mathematics Programs That Make a Difference 2007
Citation 2007
This year the AMS recognizes Enhancing Diversity in Graduate Education (EDGE), run collaboratively by Bryn Mawr College and Spelman College, and the Mathematical Theoretical Biology Institute (MTBI), currently conducted at Arizona State University. Both of these are successful programs that have made significant contributions to the effort of supporting and encouraging underrepresented minorities to continue in the study of mathematics.
Enhancing Diversity in Graduate Education (EDGE)
Bryn Mawr College and Spelman College
The EDGE program pairs an academic component (a four-week summer program) with a mentoring component. The program's long-range goals are to increase the presence of women, with a special focus on women of color, in the upper ranks of mathematical scientists, and to create models for mathematics programs that allow people from all backgrounds and cultures to thrive, advance and contribute to the profession. The four-week Summer Program provides intense exposure to material and mastery through problem solving by a combination of individual effort and teamwork. The curriculum consists of two, four-week core courses, one in abstract and linear algebra and one in analysis; problem sessions conducted by three graduate student mentors; a mini-course and guest lectures on timely areas of mathematical research; TeX sessions and presentations by participants. The Follow-Up Mentoring Program provides support, both socially and professionally, for the graduate school experience. The co-directors and local coordinator arrange for a faculty mentor at each student's graduate institution. In addition, they maintain contact with students during the year and provide a small research allowance for books and professional travel. Each student is invited to return to EDGE the following summer for a
__________________
19 This information is drawn from the following page on the AMS website: www.ams.org/profession/prizes-awards/ams-supported/make-E-diff-award. For more information about this program, please contact Dr. Ellen Maycock, Associate Executive Director, AMS, via e-mail at ejm@ams.org or by phone at 800-321-4267, ext. 4101.
reunion, and an electronic bulletin board allows alumnae to share triumphs and challenges throughout their graduate school years.
One hundred five outstanding women were accepted into the EDGE Program from 1998 to 2006. As of 2005, data show that EDGE participants are from diverse racial (49 percent underrepresented minorities) and educational (44 percent liberal arts) backgrounds. In the first eight years of EDGE (1998-2005), 90 EDGE students entered graduate programs; approximately 92 percent of these students either are actively pursuing or have earned a graduate degree. By 2006, 28 percent of the total group had earned a master's degree and discontinued their education, most often to accept employment, and 58 percent were continuing in a graduate degree program. To date, six EDGE participants (6.7 percent) and three other EDGE graduate mentors have earned their doctoral degrees in mathematics, and several other participants expect to complete their degree requirements by the end of 2007. Among the six doctoral recipients, three are white and three are African American.
EDGE web site: www.edgeforwomen.org/
Full program description: www.ams.org/programs/diversity/EDGEdescription.pdf
The AMS commends the program co-directors, Sylvia Bozeman (Spelman College) and Rhonda Hughes (Bryn Mawr College), for their success in improving the diversity of the profession of mathematics in the United States.
Mathematical Theoretical Biology Institute (MTBI) Arizona State University
Every summer MTBI offers sequential research experiences for undergraduates and graduate students, most of whom come from underrepresented minority groups. The program has run for eleven years in conjunction with Cornell University, Los Alamos National Laboratory and Arizona State University. MTBI focuses on the field of applied mathematics, in particular on applications to the biological and social sciences, and provides research training and mentorship for students. New students take three and a half weeks of intense training in dynamical systems (broadly understood to include stochastic processes) and modeling in the biological and social sciences. At the end of the initial training period, students set their own research agenda each summer by forming research groups of 3-4 participants around a project of their choice. Each group is assigned a faculty advisor and provided with appropriate graduate student support.
MTBI has mentored and supported 285 undergraduate students and 31 graduate students, 14 of whom had participated previously in MTBI as undergraduate students. Over its first ten years of existence, MTBI sent 128 students from underrepresented minority groups to graduate school, and a total of 152 students overall. Furthermore, 53 percent of those were females, including 66 from minority groups. MTBI's efforts have significantly increased the number of U.S. Ph.D.s awarded to members of underrepresented groups. For example, in 2005, Ph.D.s in the mathematical sciences were awarded to 10 MTBI alumni, 8 of whom are members of underrepresented minorities. Those 8 Ph.D.s represent about one-quarter of the total number of doctorates awarded that year to members of underrepresented minority groups. In 2005, 6 of the 15 women who have received Ph.D.s in mathematics and are members of underrepresented minorities are MTBI alumnae.
MTBI web site: http://mtbi.asu.edu/
Full program description: www.ams.org/programs/diversity/MTBIdescription.pdf
The AMS commends the director of MTBI, Carlos Castillo-Chavez, for his high level of commitment and his successful efforts to improve the diversity of the profession of mathematics in the United States.
For more information about the nomination process, please contact Dr. Ellen Maycock, Associate Executive Director, AMS, via e-mail at ejm@ams.org or by phone at 800-321-4267, ext. 4101.


