
Distributed Anomaly Detection for Timely Fault Remediation in Modern Manufacturing
DRAGAN DJURDJANOVIC
University of Texas at Austin
Decades of academic and industry-based research on traditional condition monitoring led to precedent-based approaches, which recognize faulty behavior modes whose indications have already been established based on engineering knowledge or training data. But for the highly sophisticated systems used in manufacturing today, the precedent-based approach is cumbersome, time consuming, and costly. First, the condition monitoring procedures have to be trained to recognize a large number of potential faults, some of which cannot be anticipated during the design stage. Second, because modern manufacturing equipment can perform a variety of operations, it displays highly dynamic behavior. Finally, faults may manifest very differently under different operating conditions, so training of diagnostic units for all possible conditions and all possible faults is practically impossible. Research is needed to better understand the applications of such tools and support their implementation to promote more efficient and cost-effective manufacturing.
COMPLICATIONS AND COSTS OF UNPRECEDENTED FAULTS
One does not have to look far for evidence of manufacturers scrambling to deal with unprecedented faulty situations. For example, connections in communication networks among stations in automotive assembly lines are commonly interrupted because of contacts compromised by moving robots and workpieces, coolants, and improper installation (Lei et al. 2010, 2011). They are inherently unprecedented faults because, with different network configurations, usage patterns, and fault severities, every intermittent connection in every plant is different, which means that there are no fault signatures available a priori. In one case an intermittent connection on a DeviceNet network in a major automotive assembly
plant resulted in a 4½-hour downtime because of an inability to diagnose the problem and find the node that caused it. One minute of downtime on an automotive assembly line can cost more than $20,000 (Spiewak et al. 2000).
With more sophisticated manufacturing processes and systems, consequences of the inability to cope with unprecedented situations become more frequent and have greater impacts. For example, analysis of data for more than 6 months of operation of a plasma-enhanced chemical vapor deposition (PECVD) in a major domestic 300 mm semiconductor fabrication plant found two downtime instances that each lasted more than a week and each cost close to $1 million just in scrapped wafers (lost production damage is probably even larger) (Cholette 2012). The tool kept messing the wafers while emitting signatures that were totally new, and no one could fix the problem. One of those downtimes was finally resolved after a teleconference with a quantum physics PhD, who led the control design and development of the PECVD tool in question. (I have seen the same type of tool cause similar problems in two other semiconductor manufacturing companies, again because it took a long time to find the root causes and do appropriate repairs.)
In the examples described above, the manufacturers were stymied by unknown situations, searching blindly for the sources of the problems, devising ad hoc repair procedures, and wasting significant resources. Such “learning by doing” is inexcusably frequent, especially in highly sophisticated, high-value manufacturing areas, and leads to expensive equipment downtimes and ineffective repairs, costing US manufacturers hundreds of billions of dollars annually (Heng et al. 2009).
It seems evident that the traditional precedent-based diagnostic paradigm has reached its limits and a radically new approach is needed to deal with the ever increasing complexity of modern manufacturing. The planning and scheduling of manufacturing operations in an environment plagued by unknown, unprecedented situations represent an exciting research opportunity with potentially enormous positive impact.
COPING WITH UNPRECEDENTED CONDITIONS
The traditional precedent-based diagnostic approach involves a database of fault models based on elaborate training data and/or modeling efforts describing system behavior in the presence of those faults. Each time an abnormality is detected, the system behavior is checked against the fault models to identify the cause and determine the appropriate maintenance actions. Faults whose models do not exist in the database required lengthy efforts to identify the cause, relying heavily on human expertise and costly trial and error.
Distributed Anomaly Detection
Maintenance personnel in a manufacturing facility need to be able to identify, or localize, the source of a fault and the corresponding field replaceable
unit (FRU); the specific character of the fault is usually secondary. For example, a maintenance worker on a PECVD tool needs to know whether a pendulum valve on the tool is anomalous or not. Information about whether the anomaly was caused by a faulty actuator or accumulation buildup or any other reason is secondary; the remedial action is the same: replace the pendulum valve. Hence, instead of identifying various faulty behavior regimes, the more useful focus would be on localizing the source of the anomalous behavior, using the paradigm of distributed anomaly detection. Essentially, monitoring can be realized through a set of anomaly detectors (ADs) covering the target system, with each detector that perceives an anomaly splitting into a set of ADs monitoring the pertinent subsystems. This cascading “proliferation” of ADs continues until the FRUs that caused the abnormality are identified (Cholette and Djurdjanovic 2012a,b; Djurdjanovic et al. 2010). Thus, rather than a database of specific faulty behavioral modes, this approach requires a database of only normal behavior models of the target system and its subsystems. ADs use these models to detect anomalies as statistically significant departures.
Figure 1 shows how this approach enables the identification of subsystems causing anomalies in the exhaust gas recirculation (EGR) system of an automotive diesel engine (from Cholette and Djurdjanovic 2012b). Initially, an AD monitors the entire EGR system based on the dynamic model of its normal behavior, as indicated in plot (a). Once it detects an anomaly, five ADs are distributed, as shown in plot (b), each using the relevant model of normal behavior of the target subsystem to monitor its behavior.
The “normalness” of behavior of each system is assessed through confidence values (CVs), which express the overlap of modeling residuals observed during normal behavior and those most recently observed. This quantity fluctuates between 0 and 1, with 1 indicating a perfect match (performance identical to normal) and small values indicating anomalies. Using the terminology of the literature on artificial immune systems, CVs are analogous to each detector’s “affinity” to the normal behavior of its respective target system(s) (Forest et al. 1994).
Figure 2 shows CVs from the relevant ADs when progressively more severe clogging was simulated in the EGR valve. Interpretation of the CVs clearly points to the culprit subsystem (a valve), even though no fault signatures were collected, only models of normal behavior of the EGR system and its subsystems. The same approach was used to isolate faults in the controller and EGR cooler (Cholette and Djurdjanovic 2012b).
But precedent-free fault localization is not yet used in manufacturing, primarily because of the immense complexity of modern manufacturing machines in which such an approach is really needed. One problem concerns the lack of observability of the underlying phenomena in such machines; for example, the state of plasma in a PECVD or etching tool is inherently unobservable, as will be elaborated below. Another challenge lies in the fact that distributed anomaly detection requires an understanding of interactions among subsystems—which
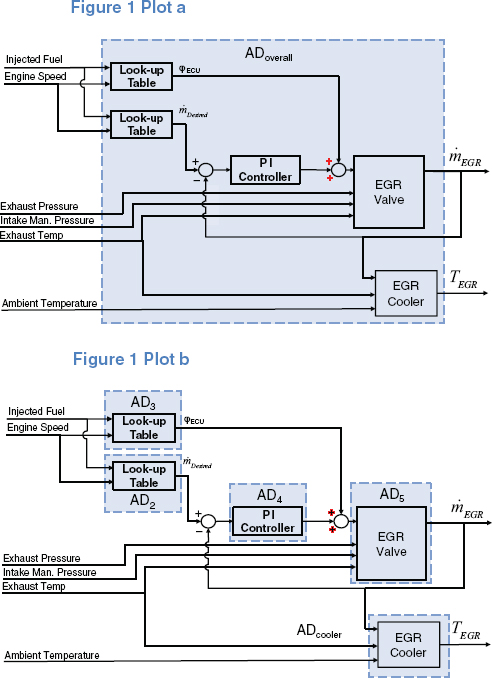
FIGURE 1 Distribution of anomaly detectors (ADs) in a diesel engine exhaust gas recirculation (EGR) system. Once an anomaly is detected, the overall AD, depicted in plot (a), splits into ADs that monitor pertinent subsystems, as illustrated in plot (b). ECU = electronic control unit; Man. = manifold; PI = proportional-integral; T = temperature; ![]() = mass flow.
= mass flow.
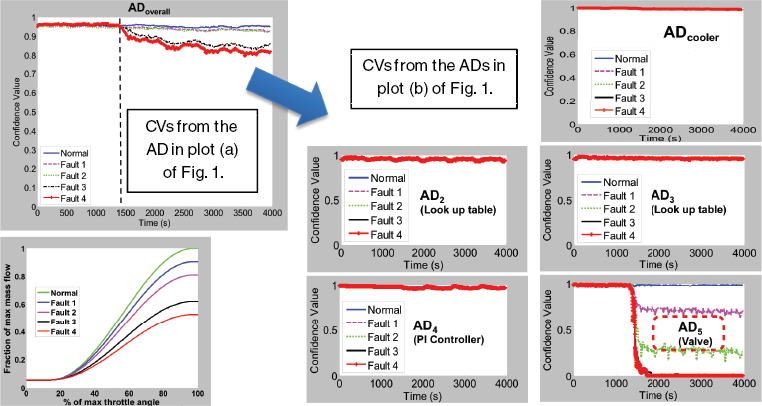
FIGURE 2 Confidence values (CVs) from anomaly detectors (ADs) that proliferate through the exhaust gas recirculation (EGR) system as progressively severe faults are inserted into the EGR valve. Interpretation of CVs clearly identifies the valve as the source of the problem. PI = proportional-integral. Figure can be viewed in color at http://www.nap.edu/catalog.php7record_id=18558.
variables affect the performance of a given system as inputs and which act as outputs, potentially affecting other systems. In an automotive engine, this information can be known from the design of the control system (Cholette and Djurdjanovic 2012b). But in a modern lithography tool or etcher, hundreds of subsystems and components operate in very different physical domains and at very different timescales, emitting thousands of signals representing physical variables whose interactions are not well understood even by the domain experts.
Degradation Modeling and Hidden Markov Models
Anomaly detection is particularly challenging in the case of inherently unobservable phenomena, such as plasma used in CVD, etching, and lithography processes. Plasma is described by 3-dimensional fields of magnetic induction, pressures, and temperatures. But it is possible to detect only a few temperature and pressure points, a few characteristics of the magnetic field at one or two selected points. The state of plasma between these points is inherently invisible, although it can be inferred with more or less confidence from the sensor readings.
In addition, the variable operating conditions of modern manufacturing machines in highly flexible and reconfigurable environments mean that degradation dynamics and fault signatures—which, as mentioned above, are often only probabilistically visible—change with the operating regime. An assumption that the underlying condition of a system is deterministically related to one or several sensor readings in this context is inadequate to cope with such complexity. Advanced signal processing, statistical analysis, and time-series modeling, which worked so well with rotating machinery and traditional manufacturing, do not help in this case.
A new mathematical construct was recently devised for degradation modeling and anomaly detection in inherently unobservable processes in variable operating regimes. The new method models the degradation process through a collection of operating regime–specific hidden Markov models (HMMs) (Cholette 2012; Rabiner 1989). In this context, the equipment conditions are hidden states (equipment conditions) that are stochastically related to the observable variables (based on the sensor readings). The observable variables, hidden states, and dynamics of progression of the hidden states are made to be operating regime dependent, thus enabling context-dependent, operating regime–specific degradation modeling.
Figure 3 illustrates degradation modeling via interconnected HMMs, each of which corresponds to an operation executed on the monitored system.1 The state dynamics of each of the underlying HMMs is modeled to be unidirectional,
__________________
1 On the fictitious machine shown in Figure 3, operation 1 is executed first, followed by operation 2, then operation 1, followed by a maintenance operation and then a totally new operation 3. Each of these operations has its own HMM, with hidden states representing degradation states, while sensor readings are modeled as observable HMM variables.
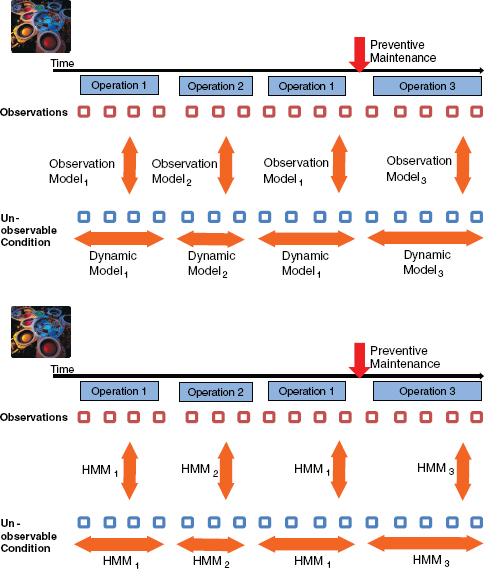
FIGURE 3 Illustration of degradation modeling based on the concept of interconnected, operating regime–specific hidden Markov models (HMMs) of equipment degradation.
which means that without maintenance, the condition (hidden HMM state) of the monitored system increasingly degrades. In addition, following the continuity of degradation, the probability distributions of hidden states at the end of one operation become initial state probabilities for the next. Based on these assumptions, Cholette (2012) introduces a genetic algorithm (GA)–based procedure to identify parameters for the degradation-describing HMMs using sensor readings emitted by a system in arbitrarily mixed operating regimes.
Once the operating regime–specific degradation HMMs are identified, conditional log-likelihoods of the new sensor observations can be used to detect abnormalities. These log-likelihoods drop linearly with the length of an observation sequence, with slopes corresponding to the HMM dynamics. Normalizing these slopes by removing the means of operating mode–dependent slopes and scaling them with operating mode–dependent variances enables the detection of unusual slopes (sequences inconsistent with the degradation HMMs observed during normal system behavior) using simple statistical process control methods, such as an exponentially weighted moving average (EWMA) chart. Detailed information about methods for identifying operating mode–specific degradation HMMs and for detecting anomalies based on such models of degradation are available in Cholette (2012).
The HMM-based degradation modeling and monitoring methods were applied to a PECVD tool at the semiconductor manufacturing facility mentioned above. Over a period of more than 6 months the tool deposited films on more than 100,000 standard 300 mm silicon wafers of the same chemistry but of four varying thicknesses. Signals were collected at a 10 Hz sampling rate from sensors mounted on the tool to gauge gas flow, pressure, radio-frequency (RF) power generation, and chamber pressure. A set of features, such as signal rise times, overshoots, time-durations, and amplitudes of various events during the deposition process were extracted from the sensor signals.2
The EWMA chart of normalized log-likelihoods of observations and the corresponding 4-σ control limits are shown in Figure 4. The dashed vertical line labeled “Training” demarcates the data used to identify the parameters of the operating regime–specific HMMs. Two major downtimes caused by severely unacceptable tool behavior were observed during this period and are labeled in Figure 4 as “Big particle event” and “Coulomb crystals.” In addition, based on the analysis of particle counts obtained via particle monitoring wafers (special non-production wafers occasionally passed through the system to assess particle contamination in the system), several minor particle events occurred and are also labeled in Figure 4.
The first minor particle excursion coincides with the cluster of out-of-control points visible somewhat before the first preventive maintenance. During this period particle-monitoring wafers3 showed a significant increase in particle counts. These anomalous events lasted several days and were consistent with particle contamination from within the chamber itself, leading to a number of scrapped dies on the contaminated wafers.
__________________
2 For details on the feature extraction procedure, the reader is referred to Bleakie and Djurdjanovic (2011).
3 Nonproduction wafers “sense” particle contamination in the chamber by essentially undergoing a deposition process, after which they are sent to a metrology tool that counts the number of particles on the wafer.
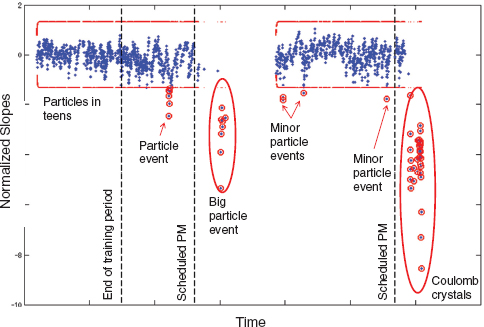
FIGURE 4 Exponentially weighted moving average (EWMA) control chart of normalized log-likelihood slopes kT, with indications of the times of abnormal behavior events and particle excursions observed during the monitoring period. Each dot in the figure corresponds to a batch of 25–100 wafers.
The first major downtime was more than a week long and was characterized by particle counts two orders of magnitude higher than normal. The length of the downtime was due to the inability to find the source of the particles; various subsystems of the tool were overhauled until the problem simply went away (suspicion is that preventive maintenance that occurred just a bit before this downtime, may have been done poorly and led to the particle failures).
Between the two major downtimes, several minor particle excursions were observed, during which particle monitoring wafers had significantly elevated counts (slightly less severe levels than what was seen during the first minor particle excursion and order of magnitude less severe than what was seen during the first major downtime). As can be seen from Figure 4, each one of those events was flagged by the out of control (unusually low) normalized likelihood slopes produced by the method described in this paper. No downtime occurred due to any of those excursions simply because the nature of the production process was such that particle levels observed during those periods could be tolerated (the product produced in this factory was not requiring the highest possible levels of particle control).
Finally, the second major downtime occurred at the end of the dataset shown in Figure 4. During this event, a number of particle failures and “plasma forma-
tions” were noted in the chamber. Again, days of downtime ensued, with fruitless attempts to clear the chamber of the source(s) of particles. After consultation with experts from the company that made the tool, the events were found to be the result of improper evaporation of the deposition product, which caused a phenomenon known as Coulomb crystals (Chu and Lin 1994). In other words, the source of the problem was not even close to the chamber: it was in the gas delivery system, and the failure there led to symptoms that looked as if the problem were in the chamber.
Potential Approaches for Localizing the Sources of Problems in Complex Manufacturing Machines
Although degradation modeling enables anomaly detection even in partially observable, complex processes, the ability to automatically pinpoint the subsystems and components that led to the anomaly remains a challenge. HMM-based anomaly detection could warn the manufacturer using the PECVD tool in the example described above, thus preventing the loss from wasted wafers, but the duration of downtimes could not be reduced because the manufacturer would still need to go through a trial and error procedure until the root cause of the problem was found.
To automate identification of the root cause using distributed anomaly detection, it is necessary to understand the causal interactions between various subsystems of the monitored system—what variables describe each subsystem and FRU of the PECVD tool, and through which variables and in what ways these systems interact while the tool operates.
In the case of the automotive EGR system, all relevant variables were adequately sensed, and it was possible to see exactly how various subsystems interacted (what were the inputs and outputs of each subsystem and component). But with many types of modern manufacturing equipment, such causal topology (what affects what) of interactions between various subsystems may be much harder to determine. Seemingly, everything could affect everything, especially in highly complex and integrated systems, such as PECVD or lithography tools.
Figure 5 illustrates causal interactions for a PECVD tool. However, even the tool experts who designed and manufactured the tool are not sure whether this graph effectively represents all its interactions. And a lithography tool is even less understood.
Formal and systematic identification of causalities in manufacturing equipment is essential to understand how FRUs interact with each other. An optimal model may emerge from a metaheuristic topological search, such as GA or Tabu search, and evaluations using the Akaike information criterion (Akaike 1974) or minimal description length criterion (Rissanen 1978). Such model discovery methods were previously attempted in hot rolling (Li and Jin 2010; Lin et al. 2008), but never in anything remotely as complex as a semiconductor manufac-
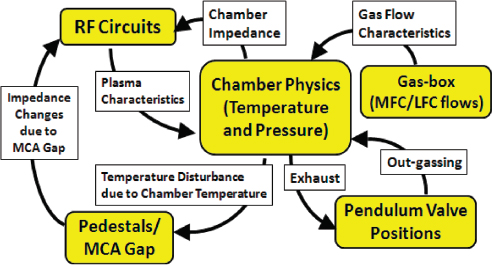
FIGURE 5 Causal graph of plasma-enhanced chemical vapor deposition (PECVD) tool field replaceable units (FRUs), with brief explanations of interaction mechanisms. LFC = liquid flow controller; MCA = minimum contact area; MFC = mass flow controller; RF = radio frequency.
turing tool, where the number of variables is several orders of magnitude greater, modes of operation are much more diverse, and boundaries between (definitions of) FRUs and subsystems are much more blurred.
In addition, research is needed to explore agent distribution policies that optimize tradeoffs between computational resources needed for each AD, their sensitivity to anomaly detection, and the speed of localization of the sources of anomalous behavior. A simple example in Figure 6 illustrates how the use of computational resources can increase fault sensitivity and speed of localization. In that figure, it is assumed that there are only three admissible AD distribution and proliferation policies. Policy 1 is based on always having three ADs monitoring all three FRUs. Policy 2 relies on a single AD monitoring the entire machine, which proliferates into three pertinent ADs as soon as it detects an anomaly (similar to what we see in Figure 2). Policy 3 uses only one AD at a time, and this AD can appear above any FRU with equal probability (implicit assumption that each FRU is equally likely to fail). Let us also assume that only one fault can develop in each of the FRUs, and let d0 and d2 be the detection rates within some unit time interval T for the overall AD and each of the FRU ADs, respectively. Also, let Ci be the cost of not reaching the decision within the time interval T, and let Cc be the computational cost of running each of these ADs during the time interval T (realistically, AD monitoring FRU3 should be more complicated because it has to take into account behavior of FRU1 and FRU2, but for the sake of analytic
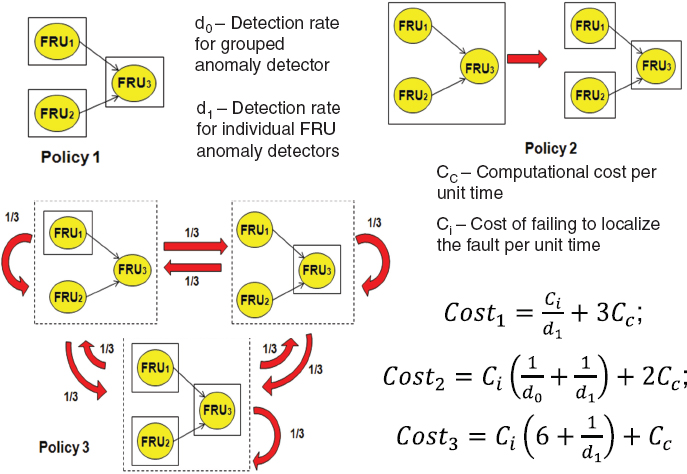
FIGURE 6 Example of tradeoffs in agent distribution policies for distributed anomaly detection. FRU = field replacement unit.
tractability, they are all assumed to be equally complex). Then, simple (but somewhat tedious) algebra gives the following costs for each policy (false alarm costs were not included, but it can be done easily):
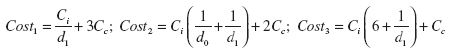
Obviously, as we go from policy 1 to 2 to 3, the cost of detection grows because more time is needed to isolate the source of the problem. At the same time, the computational cost drops because we are less and less aggressive in terms of AD usage. Thus, policy 1 becomes optimal when the time to isolate the fault is very costly (Ci is high) and/or computational resources are cheap (Cc is low). Conversely, policy 3 is optimal when the time to isolate the fault is cheap and/or computational resources are expensive. Unfortunately, a study like this in any realistic setting (more FRUs, more complex policies, more realistic diagnostic models) has never been conducted.
HUMANS AS DISTRIBUTED AGENTS FOR REMOVAL OF FAULTS (“ANTIGENS”) IN A MANUFACTURING SYSTEM
The unprecedented-fault localization process described above resembles to a degree that of a natural immune system, which identifies and labels an antigen by coating it with appropriately generated antibodies: the diagnostic system described here uses ADs to identify and label faulty subsystems and FRUs.
Once the immune system labels an antigen, leukocytes (white blood cells) dispose of the intrusion by killing anything coated with antibodies. The job of “antigen removal” in a manufacturing system is performed by maintenance practitioners who effectively act as leukocytes. However, unlike the natural leukocytes programmed to kill anything antibodies label as “nonself,” manufacturing “leukocytes” (people) can think, learn—and forget over time. There is a tremendous need for innovative methods to model and match dynamically evolving human skills with maintenance and operational jobs, including (especially) those corresponding to unprecedented situations and faults.
A tree-based representation of machine faults and human skills (Figure 7) may be a way to ensure that a dispatched practitioner has the appropriate skills, even when confronted with an unprecedented problem. An optimization procedure for the joint scheduling of operations and dispatch of operators would also take into account the dynamics of evolving operator skills and interactions between various components of the manufacturing system.
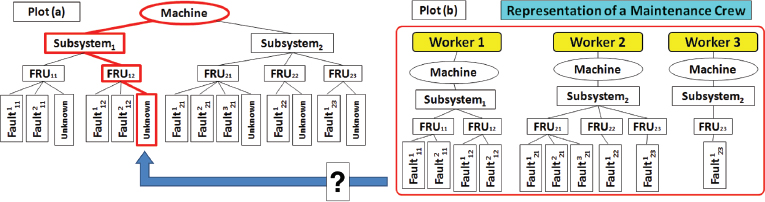
FIGURE 7 Plot (a) illustrates the proposed tree-based representation of a machine and its subsystems and field replacement units (FRUs). It also shows a representation of a maintenance job as a portion of the machine tree “illuminated” (with heavy lines) by the diagnostic system (here, it points to an unknown fault in FRU12). Plot (b) shows the assignments and skills of a three-member maintenance crew, enabling ready identification of the worker best suited for the particular job.
CONCLUDING THOUGHTS
It is clear that a fruitful focus of research pertains to the need and possibility to realize equipment diagnostics and the entire realm of manufacturing system operations through the concept of distributed agents capable of dealing with new, unprecedented situations. Incorporating such agents, architecture of autonomous process and operations control—cognizant and aware of “self” and “nonself”—may be dearly needed as the complexity of future manufacturing systems grows into the realm of cognitive manufacturing.
REFERENCES
Akaike H. 1974. A new look at the statistical model identification. IEEE Transactions on Automatic Control 19(6):716–723.
Bleakie A, Djurdjanovic D. 2011. Dynamic feature monitoring technique applied to thin film deposition processes in an industrial PECVD tool. ASME 2011 International Manuacturing Science and Engineering Conference, Corvallis, OR.
Cholette ME. 2012. Performance monitoring and fault-tolerant control of complex systems with variable operating conditions. PhD dissertation, Department of Mechanical Engineering, University of Texas at Austin.
Cholette M, Djurdjanovic D. 2012a. Immunity-inspired monitoring of systems of interacting dynamic systems. Applied Intelligence 37(1):60–79.
Cholette M, Djurdjanovic D. 2012b. Precedent-free fault isolation in a diesel engine EGR system. Journal of Dynamic Systems, Measurement and Control 134(3):031007–1-031007–11.
Chu JH, Lin I. 1994. Direct observation of Coulomb crystals and liquids in strongly coupled RF dusty plasmas. Physical Review Letters 72(25):4009–4012.
Djurdjanovic D, Liu J, Marko KA, Ni J. 2010. Immune systems inspired approach to anomaly detection, fault localization and diagnosis in automotive engines. In: Applications of Neural Networks in High Assurance Systems, ed. Liu Y, Schumann J. Springer-Verlag Berlin Heidelberg. pp. 141–164.
Forest S, Perelson AS, Allen L, Cherukuri R. 1994. Self-nonself-discrimination in a computer. Proceedings of the 1994 IEEE Symposium on Research in Security and Privacy. Los Alamitos, CA: IEEE Computer Society Press.
Heng A, Zhang S, Tan ACC, Mathew J. 2009. Rotating machinery prognostics: State of the art, challenges and opportunities. Mechanical Systems and Signal Processing 23:724–739.
Lei Y, Djurdjanovic D, Barajas L, Workman GC, Ni J, Biller S. 2011. Network health monitoring for DeviceNet using physical layer parameters. Journal of Intelligent Manufacturing 22:289–299.
Lei Y, Djurdjanovic D, Ni J. 2010. DeviceNet reliability assessment using physical and data link layer parameters. Quality and Reliability Engineering International 26:703–715.
Li J, Jin J, Shi J. 2008. Causation-based T2 decomposition for multivariate process monitoring and diagnosis. Journal of Quality Technology 40(1):46–58.
Li J, Jin J. 2010. Optimal sensor allocation by integrating causal models and set covering algorithms IIE Transactions on Quality and Reliability Engineering 42(8):564–576.
Rabiner LR. 1989. A tutorial on hidden Markov models and selected applications in speech recognition. Proceedings of the IEEE 77(2):257–286.
Rissanen J. 1978. Modeling by shortest data description. Automatica 14(5):465–471.
Spiewak SA, Duggirala R, Barnett K. 2000. Predictive monitoring and control of the cold extrusion process. CIRP Annals of Manufacturing Technology 49(1):383–386.
This page intentionally left blank.


