7
Potential Sources of Error in the NCVS:
Sampling, Frame, and Processing
The nation needs accurate measurements of victimization rates to allocate resources to fight crime, support victims’ needs, and shape policies and programs to deter these crimes in the future. The National Crime Victimization Survey (NCVS), which is administered by the Bureau of Justice Statistics (BJS), is currently the major tool available to measure these rates and victim characteristics. As discussed in the preceding chapters, there is controversy as to whether the incidence of rape and sexual assault is being underestimated on the NCVS, in part because other sources of data have shown higher levels of victimization than estimated through the NCVS. These differences reflect, in part, the clear definitional differences and methodological differences among the sources, which in turn affect the estimated victimization levels.
The panel could not ascertain which data source provided the most accurate estimates of rape and sexual assault. Even though the other sources (excluding the Uniform Crime Reports [UCR]) showed larger estimates than did the NCVS (or National Crime Survey), the panel is not concluding that “bigger is better.” With that said, the higher rates estimated by the several reviewed surveys lend support to concerns about a potential underestimate by the NCVS. These concerns, as well as the original charge to the panel (see Box 1-1 in Chapter 1), led to the panel’s close analysis of the NCVS. It is important to note that the panel’s work focused on the NCVS and did not examine as closely the other sources of data on rape and sexual assault described in Chapter 5. By addressing only the NCVS in this
and the next three chapters, the panel is not implying that there are more issues with the NCVS than with the others.1
To assess potential issues with the survey, including reasons for this possible underestimate, the panel examined the NCVS using the structure of total survey error. Total error involves a holistic view of all potential errors in a survey program, including both sampling error and nonsampling error. Biemer (2010), in the Handbook of Survey Research, outlines the components of nonsampling error in surveys: specification error, frame error, nonresponse error, measurement error, and processing error. Specification error arises when the construct underlying an observed variable, y, differs from the desired construct, x—that is, the construct that data analysts and other users prefer. Frame error arises in the process of constructing, maintaining, and using the sampling frame(s) for selecting the survey sample. It includes the inclusion of nonpopulation members (overcoverage), exclusion of population members (undercoverage), and the duplication of population members. Frame error also includes errors in the auxiliary variables associated with the frame units (sometimes referred to as content error) as well as missing values for these variables. Nonresponse error encompasses both unit and item nonresponse. Unit nonresponse occurs when a sampled unit does not respond to any part of a questionnaire. Item nonresponse occurs when the questionnaire is only partially completed because an interview was prematurely terminated or some items that should have been answered were skipped or left blank. Measurement error includes errors arising from respondents, interviewers, survey questions and factors that affect survey responses. Data processing error includes errors in editing, data entry, coding, computation of weights, and the tabulation of the survey data. It also includes errors arising from fitting models for various purposes such as imputation, derivation of new variables, disclosure avoidance and so forth.
This chapter reviews potential sampling problems for the NCVS in measuring rape and sexual assault and then reviews potential problems for two nonsampling errors: frame and processing. Chapter 8 reviews the other three nonsampling errors: nonresponse, specification, and measurement.
Sampling error occurs because survey information is observed from only a sample of the target population instead of from the entire population. In general, increasing the size of the sample decreases sampling error.
___________
1In fact, the panel was somewhat discomfited by the estimates from the National Intimate Partner and Sexual Violence Survey (NISVS), which are so much larger than estimates from other sources of data. The field would benefit from a rigorous error evaluation of that survey to better understand those differences.
Because the costs of increasing sample size are not trivial, survey practitioners strive to create operationally efficient sample designs that can provide sufficient coverage of the target population while keeping both sample size and sampling error within specified bounds.
The target population of the NCVS is the noninstitutionalized population of the United States, 12 years of age and older. This includes “residents living throughout the United States, including persons living in group quarters, such as dormitories, rooming houses, and religious group dwellings” (Bureau of Justice Statistics, 2008b). As detailed in Chapter 4, the Census Bureau uses a multistage sample design for the NCVS, with primary sampling units (PSUs) coming from an area frame and secondary units of addresses selected within the sampled PSUs. The household at a selected address is contacted in person by a Census Bureau field representative, and each household member, 12 years of age and older, is identified for a separate interview. Subsequent waves of interviewing are conducted by the field representative, mostly by telephone.
The NCVS features a rotating panel design, with selected addresses included in the sample for seven waves of collection over 3 years. Every 6 months, a new rotation group is rotated into the NCVS and an existing group is rotated out. The second stage sample is of addresses, so if individuals move into or out of the housing unit during the time that their address is in the NCVS sample, then field interviewers will contact current residents at the originally sampled address.
BJS derives annual estimates of victimization levels and rates by accumulating data from all rotation groups across all data collections in the year. The sampling weights used in these estimates are adjusted for nonresponse and calibrated to known population totals. There is also an adjustment for data collected during a first interview that compensates for potential telescoping (see details in Chapter 4).
Large Coefficients of Variation
The coefficient of variation (CV), which is defined as the standard error of a survey estimate divided by the estimate itself (expressed as a percent), provides a relative measure of the sampling error associated with survey estimates. Table 7-1 shows national-level estimates and their CVs from the NCVS for rape and sexual assault and serious violent crimes for 3 years: 2002, 2010, and 2011. For the category of all serious violent crimes (which includes rape and sexual assault, robbery, and aggravated assault), the sampling error at the national level for both the number of victimizations and the victimization rate is approximately 6 percent and appears to be fairly stable from year to year. However, for rape and sexual assault (as measured in 2011), which account for only 13 percent of all serious vio-
TABLE 7-1 NCVS Estimates and Coefficients of Variation (CVs): Rape and Sexual Assault and Serious Violent Crimes (including series victimization)
| Number of Victimizations | Rate per 1,000 People (12+ years and older) | ||||||||
| Year | Category of Victimization | Estimate | CVs (%) | Estimate | CVs (%) | ||||
| 2002 | Rape and sexual assault | 349,810 | 10.9 | 1.5 | 13.3 | ||||
| All serious violent crimes | 2,306,710 | 5.2 | 10.0 | 5.0 | |||||
| 2010 | Rape and sexual assault | 268,570 | 13.4 | 1.0 | 10.0 | ||||
| All serious violent crimes | 1,694,840 | 6.4 | 6.6 | 6.1 | |||||
| 2011 | Rape and sexual assault | 243,800 | 14.3 | 0.9 | 11.1 | ||||
| All serious violent crim | 1,852,650 | 6.2 | 7.2 | 5.6 | |||||
SOURCE: Data from Criminal Victimization, 2011 (Bureau of Justice Statistics, 2012a).
lent crime victimizations, the CVs for the number of those victimizations are approximately 14 percent at the national level with more year-to-year variation. The CVs for victimization rates for rape and sexual assault are slightly smaller: 10–11 percent in the two most recent years.
As important as national-level estimates of rape and sexual assault are, there is an equivalent need for quality estimates for certain subpopulations to ascertain which demographic groups are more “at risk” to become victims and to look at regional differences in criminal victimization levels. These more focused estimates are important because they allow for better allocation of resources to prevent crime and support victims.
Unfortunately, the sampling error for estimates of victimization rates for many subpopulations of interest can become quite large on the NCVS because there are very few affirmative responses to questions about serious violent criminal victimization in the sampled groups. Thus, BJS does not provide estimates for rape and sexual assault for these subpopulations; they only provide estimates for the larger category, serious violent crimes.
For the aggregated category, serious violent crime, Table 7-2 shows that the CVs at the national level are approximately 6 percent. However, the CVs for important subpopulations are much higher because of their smaller sample sizes. For example, the NCVS estimates that blacks experienced an estimated serious violent victimization rate of 10.8 percent in 2011, which were 65 percent higher than that experienced by whites, 6.5 percent, and the CVs for blacks were high (13 percent). American Indians/Alaska Natives experienced an estimated serious violent victimization rate of 47.3 percent in 2010 and 12.6 percent in 2011, and the CVs for those years were 24 and 51 percent, respectively. It is clear that the sampling errors for these important “at-risk” subpopulation were large and the estimates were very unstable from year to year.
Age groups show different estimated levels of victimizations, with highest rates for people 24 years of age and younger. The CVs for all age groups were above 10 percent in 2010 and 2011. The estimate and CVs of the rate for people 65 years of age and older illustrates the concern. In 2010, the estimated incidence rate was 0.9. In 2011, the incidence rate almost doubled to 1.7. However the CVs in 2010 were 33 percent, giving a confidence interval of [0.249, 1.55]. Thus a data user could not tell whether there was a major increase in rape and sexual assault for older people, or whether the estimated change was due to random variation. By marital status, people who were married but separated experienced the highest estimated victimization rates, along with year-to-year instability in the estimates. The CVs for these rates in 2010 and 2011 were around 20 percent. Again, data users have said that the year-to-year variability is a particular issue for their use of the estimates.
Table 7-3 shows similar data by geographic areas. For serious violent
TABLE 7-2 NCVS Victimization Rates and Coefficients of Variation (CVs) for Serious Violent Crimes, per 1,000 People (12+ years) for Selected Subpopulations
| Estimated Serious Violent Crime | CVs (%) | ||||||||
| Category | 2002 | 2010 | 2011 | 2002 | 2010 | 2011 | |||
| Total | 10.0 | 6.6 | 7.2 | 5.0 | 6.1 | 5.6 | |||
| Gender | |||||||||
| Male | 10.4 | 6.4 | 7.7 | 6.7 | 9.4 | 9.1 | |||
| Female | 9.5 | 6.8 | 6.7 | 7.4 | 8.8 | 9.0 | |||
| Race/Ethnicity | |||||||||
| White | 8.6 | 5.8 | 6.5 | 5.8 | 8.6 | 7.7 | |||
| Black | 17.8 | 10.4 | 10.8 | 9.6 | 12.5 | 13.0 | |||
| Hispanic | 12.3 | 6.7 | 7.2 | 11.4 | 13.4 | 13.9 | |||
| American Indian/Alaskan Native | 14.3 | 47.3 | 12.6 | 47.6 | 24.1 | 50.8 | |||
| Asian | 3.4 | 2.3 | 2.5 | 32.4 | 35.8 | 36.0 | |||
| 2 or more | 17.7 | 26.2 | 29.4 | 24.0 | |||||
| Age | |||||||||
| 12-17 | 17.0 | 11.7 | 8.8 | 10.0 | 12.8 | 15.9 | |||
| 18-24 | 24.7 | 17.0 | 16.3 | 8.1 | 10.0 | 11.0 | |||
| 25-34 | 12.3 | 7.1 | 9.5 | 9.8 | 12.7 | 11.6 | |||
| 35-49 | 7.6 | 5.6 | 7.0 | 9.2 | 12.5 | 11.4 | |||
| 50-64 | 4.4 | 3.7 | 4.3 | 13.6 | 16.2 | 14.0 | |||
| 65 and older | 1.8 | 0.9 | 1.7 | 22.2 | 33.3 | 23.5 | |||
| Marital Status | |||||||||
| Never married | 16.1 | 11.9 | 11.7 | 6.8 | 7.6 | 8.5 | |||
| Married | 5.7 | 2.2 | 3.7 | 8.8 | 13.6 | 10.8 | |||
| Widowed | 4.4 | 3.0 | 0.7 | 25.0 | 30.0 | 57.1 | |||
| Divorced | 10.9 | 11.2 | 9.2 | 13.8 | 13.4 | 15.2 | |||
| Separated | 34.8 | 18.8 | 26.4 | 15.2 | 20.7 | 18.9 | |||
SOURCE: Data from Criminal Victimization, 2011 (Bureau of Justice Statistic, 2012a).
TABLE 7-3 NCVS Victimization Rates and Coefficients of Variation (CVs) for Serious Violent Crimes, per 1,000 People (12+ years) by Geographic Areas
| Area | Serious Violent Crime | CVs (%) | |||||||
| 2002 | 2010 | 2011 | 2002 | 2010 | 2011 | ||||
| Total | 10.0 | 6.6 | 7.2 | 5.0 | 6.1 | 5.6 | |||
| Region | |||||||||
| Northeast | 7.1 | 6.8 | 6.4 | 11.3 | 13.2 | 14.0 | |||
| Midwest | 11.5 | 7.6 | 7.8 | 8.7 | 10.5 | 11.5 | |||
| South | 10.8 | 5.4 | 6.5 | 7.4 | 11.1 | 10.8 | |||
| West | 9.5 | 7.5 | 8.4 | 9.5 | 10.7 | 9.5 | |||
| Location of residence | |||||||||
| Urban | 15.2 | 9.5 | 9.7 | 7.2 | 8.4 | 9.3 | |||
| Suburban | 7.8 | 5.5 | 5.7 | 7.7 | 9.1 | 8.8 | |||
| Rural | 7.9 | 4.7 | 6.7 | 11.4 | 14.9 | 14.9 | |||
SOURCE: Data from Criminal Victimization, 2011 (Bureau of Justice Statistic, 2012a).
crimes, the CVs for regional estimates are generally 10 percent or somewhat higher. The estimated rates for urban and suburban areas have CVs of less than 10 percent, but the CVs for households in rural areas are about 15 percent, and there is considerable fluctuation in this estimate from year to year.
Data users have a great deal of difficulty establishing temporal trends with wide fluctuations due to sampling error in the annual estimates. The executive director of the Rape, Abuse and Incest National Network (RAINN), the nation’s largest anti-sexual violence organization, has indicated that the problem of inadequate sample size on the NCVS is very serious from the data user perspective (Berkowitz, 2011). He indicated that wildly fluctuating year-to-year numbers is one of his major concerns with the NCVS because it makes difficult the analysis of trends across years.
Pooling NCVS data across years is currently the only way to look at subpopulation estimates of rape and sexual assault. Many data users use this technique to examine subgroup risk for rape and sexual assault. For example, Lauritsen (2012) combined up to 15 years of data to produce estimates and confidence intervals. Berkowitz (2011) also reported combining several years of data to follow rate changes over time. This technique can prove very useful, but it has potential pitfalls, one of which is that it can obscure important year-to-year changes. The finer (more disaggregated) the subgroups that are included in an analysis, the greater the number of years that must be combined to obtain a sufficient number of positive responses to stabilize the estimates.
CONCLUSION 7-1 The National Crime Victimization Survey, which is designed as an omnibus victimization survey, is efficient in measuring the many types of criminal victimizations across the United States, but it does not measure the low incidence events of rape and sexual assault with the precision needed for policy and research purposes. Comparisons across subgroups and years are particularly problematic.
The Effect of Series Victimization on Estimates
Series victimization is defined on the NCVS as the situation when a single respondent reports six or more separate but similar victimizations over the reference period but is unable to recall these events individually or describe them separately in detail to the interviewer (see Chapter 4).2Table 7-4 shows that approximately 6 percent of the reports of rape and sexual assault are identified as series victimizations, a larger percentage than for other crimes. Lauritsen et al. (2012) provide analysis of the distribution of series victimizations for all violent crimes, but they are not often able to isolate results for rape and sexual assault. The authors found evidence of response error in these reports because these victims (Lauritsen et al., 2012, p. 13)
[had] difficulty recalling exactly how many times violent victimizations occurred within a 6-month reference period. The observed patterns of response clustering indicated that many victims provided estimates of the number of times the victimizations occurred rather than counting directly from memory.
Thus, when an individual is victimized so many times during a 6-month period that he or she has difficulty recalling individual incidents, that respondent may also have difficulty providing an accurate count of the number of incidents that happened and whether the incidents occurred within the reference period. Lynch, Berbaum, and Planty (2002, p. 23) further speculated about another potential measurement error problem that may exist in this category:
[S]eries incidents in a large part may be an artifact of Census Bureau procedures. More specifically, multiple events may be treated as a series event when the respondent can clearly recall and report on these incidents, simply because it is easier for the interviewer to complete a single incident form, as opposed to multiple incident forms.
___________
2If a respondent suffers multiple victimizations and is able to recall the events individually, then the situation is not classified as a series victimization, and each victimization is recorded separately.
TABLE 7-4 Victimizations Reported as Series Victimizations in the NCVS, by Type of Crime, 1993-1999 and 2000-2009, as Percentage of All Victimizations Reported
| Category of Victimization | 1993-1999 | 2000-2009 |
| Rape and sexual assault | 6.3 | 5.7 |
| Robbery | 2.9 | 2.5 |
| Aggravated assault | 4.6 | 3.1 |
| Simple assault | 6.9 | 4.3 |
| Personal larceny | 0.3a | 0.7a |
| Burglary | 1.4 | 1.0 |
| Motor vehicle theft | 0.3 | 0.2a |
| Theft | 1.1 | 0.7 |
NOTE: Table shows the number of incident reports recorded under “series victimization” procedures (which will include multiple victimizations) as a percentage of all incident reports recorded.
aInterpret with caution; estimate based on 10 or fewer sample cases, or coefficient of variation is greater than 50 percent.
SOURCE: Lauritsen et al. (2012, p. 3, Table 2).
Lauritsen et al. (2012) found some supportive evidence for this conjecture.3
From a statistical point of view, series victimization procedures create outlier problems for estimation. In general, outlier problems can be caused by large estimation weights, large outlying data values, or moderate values. Estimation weights for the NCVS are fairly large. When estimating rape and sexual assault (a low-incidence item in the NCVS data), the data values are generally zero (no rape or sexual assault reported). When rape or sexual assault is reported as a series, the data value can be quite high.4 Under the new procedures the value is truncated at “10” for individuals reporting more than 10 incidents in a single series. Even with the truncation, these outliers (representing only 6 percent of the positive responses to rape and sexual assault) tied to the NCVS weights have a substantial impact on the estimates and the standard errors of those estimates, with both increasing fairly substantially. Fortunately, the statistical literature is fairly well developed in the areas of detecting and adjusting for outliers, and some of the developed techniques (adjusting the weights, the data value, or both)
___________
3By the definition of series victimization, the respondent must report six or more similar victimizations during the reference period for which she or he cannot recall the separate details. However, Lauritsen et al. (2012) found examples of records categorized as a series victimization in which the respondent identified fewer than six victimizations.
4Lauritsen et al. (2012, p. 10) reported a maximum value of “750” incidents in series has been reported for serious violent crimes. They did not report the maximum value reported for rape and sexual assault.
may be appropriate for use in measuring rape and sexual assault (see, e.g., Barnett and Lewis, 1994; Hodge and Austin, 2004; Pedlow et al., 2010).
Until 2011, NCVS deleted these outliers for the purpose of estimates reported in Criminal Victimization (although they counted a series as a single victimization, rather than deleting, in some special reports). The effect was to heavily suppress the larger numbers that were reported by ignoring these multiple victimizations. This process added to a potential underestimation of victimizations (Planty and Strom, 2007).
Beginning in 2011, BJS stopped deleting these outliers. Instead, reported series victimizations are now directly included in the estimates with no additional adjustment unless more than 10 victimizations are reported in one series. Reported values greater than 10 are truncated to the value of 10. BJS has made the change retroactively back to 1993 in its online NCVS database.5
The effect of changing the method for handling these outliers in the estimates of rape and sexual assault is huge (see Figure 7-1 and Table 7-5). Across the past 18 years, this change in methodology increased the estimates of incidents of rape and sexual assault by an average of 52 percent per year, and it increased the estimates of incidence rate by 55 percent. The estimates (number of victimizations) also fluctuated more from year to year. The change ranged from a low of zero percentage change in 2007 (there were no series victimizations reported) to a high of 143 percentage change in 2009.
An important question is how large are these changes relative to the overall sampling error of the estimates. Figure 7-1 shows confidence intervals and thus allows a comparison as to whether the 95 percent confidence intervals for the two estimates (“with series victimization” and “without series victimization”) generally overlap. Of the 18 years depicted in the graphics, the confidence intervals for the two estimates overlapped seven times and did not overlap eight times. There were 3 years (1996, 2003, and 2008) in which the end points of the two bands touched with minimal overlap.
Figure 7-2 displays the percentage of each estimate that is directly attributable to series victimization outliers. It shows that the effect is large and very volatile across years. In 2009, nearly 60 percent of the estimate of the number of rape and sexual assault victimizations was due to series victimizations. Combining the two graphics (Figure 7-1 and Figure 7-2) together, we see that the confidence intervals overlap in years when the series victimizations make up less than 30 percent of the total estimate.
The panel did not have the time and resources to examine specific alternative outlier adjustment procedures. Thus we address the issue in
___________
5The panel found out about this change late in its work and so was unable to analyze its significance as thoroughly as we would have liked.
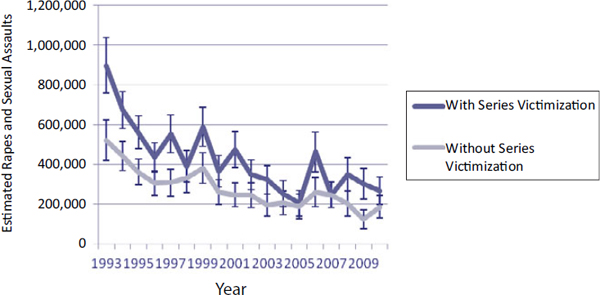
FIGURE 7-1 Estimates and confidence intervals for rape and sexual assault, with and without series victimizations, NCVS, 1993-2010.
SOURCE: Bureau of Justice Statistics (1994, 1995, 1996, 1997, 1998, 1999, 2000, 2001, 2002a, 2003, 2004, 2005, 2006, 2007, 2008a, 2009, 2010, 2011, n.d.-a).
more general terms. It is clear that a subpopulation is at risk for being repeatedly raped and sexually assaulted over a relatively short period of time. This is a statistically rare subpopulation within the population of all victims of rape and sexual assault, which already has a low incidence rate. The panel believes that this subpopulation needs to be better understood, and its victimizations should be accounted for in BJS statistics. However, the panel believes that a more sophisticated approach than currently used may be needed to properly represent series victimizations in the estimates of incidence rates for rape and sexual assault.
CONCLUSION 7-2 Records identified as series victimizations create an outlier problem in the estimation process for the National Crime Victimization Survey. The current method for handling series victimization, although an improvement over the method used until 2011, allows these relatively rare reports to have a large impact on the national estimates of rape and sexual assault and creates large year-to-year volatility.
TABLE 7-5 Effect of Series Victimizations on National Crime Victimization Survey Estimates of Rape and Sexual Assault, by Year
| Number of Victimizations | |||||||||
| Year | Counting Series Victimization | Standard Error Series | Ignoring Series Victimization | Standard Error Ignoring Series | Percentage Change in Estimate | ||||
| 1993 | 898,239 | 71348 | 521,223a | 51573 | 72 | ||||
| 1994 | 674,291 | 47198 | 433,509a | 36858 | 52 | ||||
| 1995 | 563,249 | 42418 | 363,527a | 32830 | 55 | ||||
| 1996 | 437,198 | 37345 | 307,100 | 30430 | 42 | ||||
| 1997 | 553,523 | 48035 | 311,110 | 34409 | 78 | ||||
| 1998 | 391,101 | 39935 | 332,500 | 36103 | 18 | ||||
| 1999 | 591,460 | 49907 | 383,170 | 38340 | 54 | ||||
| 2000 | 366,747 | 39485 | 260,950 | 32152 | 41 | ||||
| 2001 | 476,578 | 46216 | 248,250 | 31043 | 92 | ||||
| 2002 | 349,805 | 38253 | 247,730 | 31352 | 41 | ||||
| 2003 | 325,311 | 36759 | 198,850 | 27884 | 64 | ||||
| 2004 | 255,769 | 33339 | 209,880 | 29887 | 22 | ||||
| 2005 | 207,760 | 32551 | 190,592b | 31032 | 9 | ||||
| 2006 | 463,598 | 50305 | 260,940 | 36990 | 78 | ||||
| 2007 | 248,277 | 32924 | 248,277 | 32924 | 0 | ||||
| 2008 | 349,691 | 42837 | 203,830 | 31719 | 72 | ||||
| 2009 | 305,574 | 39443 | 125,910 | 24079 | 143 | ||||
| 2010 | 268,574 | 36057 | 188,380 | 29399 | 43 | ||||
| 2011 | 248,803 | 34800 | 217,331 | 32616 | 14 | ||||
| Average Percentage Change Across Years | 52 | ||||||||
aThe estimates published in Criminal Victimization, 1993, 1994, 1995 were revised in 1996 to reflect a methodology change to estimate victimizations for the “collection year” rather than the year in which the victimization occurred.
bBased on errata issued June 16, 2011.
| Incidence Rate per 1,000 People (12+ years) | |||||||||
| Counting Series Victimization | Ignoring Series Victimization | Percentage Change in Estimate | |||||||
| 4.3 | 2.5 | 87 | |||||||
| 3.2 | 2.1 | 60 | |||||||
| 2.6 | 1.7 | 63 | |||||||
| 2.0 | 1.4 | 43 | |||||||
| 2.5 | 1.4 | 79 | |||||||
| 1.8 | 1.5 | 20 | |||||||
| 2.6 | 1.7 | 53 | |||||||
| 1.6 | 1.2 | 33 | |||||||
| 2.1 | 1.1 | 91 | |||||||
| 1.5 | 1.1 | 36 | |||||||
| 1.4 | 0.8 | 75 | |||||||
| 1.1 | 0.9 | 22 | |||||||
| 0.8 | 0.8 | 0 | |||||||
| 1.9 | 1.1 | 73 | |||||||
| 1.0 | 1.0 | 0 | |||||||
| 1.4 | 0.8 | 75 | |||||||
| 1.2 | 0.5 | 140 | |||||||
| 1.0 | 0.7 | 43 | |||||||
| 55 | |||||||||
SOURCES: Bureau of Justice Statistics (1994, 1995, 1996, 1997, 1998, 1999, 2000, 2001, 2002a, 2003, 2004, 2005, 2006, 2007, 2008a, 2009, 2010, 2011, n.d.-a).
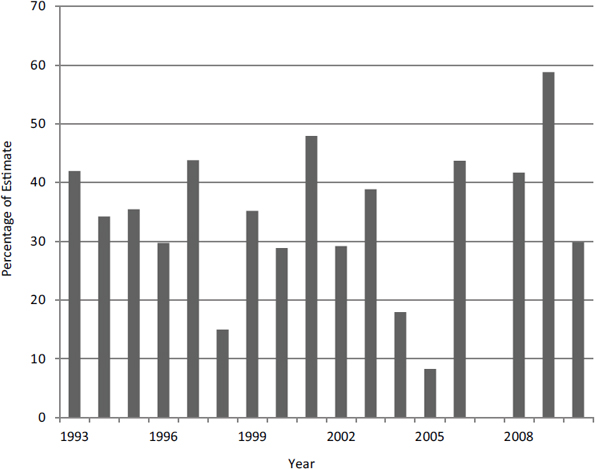
FIGURE 7-2 Effect of including series victimization in rape and sexual assault estimates in the National Crime Victimization Survey.
SOURCE: Panel-designed graphic using data from Bureau of Justice Statistics (1994, 1995, 1996, 1997, 1998, 1999, 2000, 2001, 2002a, 2003, 2004, 2005, 2006, 2007, 2008a, 2009, 2010, 2011, n.d.-a).
A sampling frame is the source material (such as a listing of people, addresses, or counties) from which a sample is selected. Errors can arise in the process of constructing, maintaining, or sampling from a frame. A quality sampling frame should provide complete (or nearly complete) coverage of the target population. The operational task of building a sampling frame is difficult and susceptible to error; consequently, steps in that process need to be operationally workable and monitored for quality. The frame should provide a base for reasonable response rates and accurate collection of data. If used for ongoing surveys, the frame must be maintained to meet specified standards.
The NCVS uses several sampling frames that are built and maintained by the Census Bureau and which the Bureau uses for a number of large
national surveys. In particular, the NCVS uses a two-stage design similar to that used in the Census Bureau’s Current Population Survey. The primary frame is the area frame built for the decennial census. PSUs are selected from this frame, consisting of small groups of neighboring counties that include individual counties, groups of counties, or large metropolitan areas. In the second stage of sampling, the NCVS uses four secondary frames within selected PSUs.
A secondary frame comes from the Census Bureau’s Master Address File (MAF), which is developed through address listing activities in support of the decennial census. For the NCVS, it is used within selected PSUs. Information from a decennial census is generally not available for use in the NCVS sample until 5 years after a census year (e.g., 2005), and it then is used for the next 10 years. Because the MAF is not comprehensively updated during this time and can become out-of-date, the Census Bureau uses a frame based on new building permits to supplement the existing MAF between censuses. Another secondary frame, the “area” listings, is generated from periodic canvassing of selected census blocks within the PSUs: they consist of identified residential units that are not on the other secondary frames. This process of supplemental listings is helpful but still leaves a basic problem: it slows but does not eliminate the inevitable coverage lapses and inefficiencies of the MAF over time.
An additional secondary frame developed for the census process and used by the NCVS is a “noninstitutionalized group quarters” listing. This frame includes such facilities as college residence halls, halfway houses for substance abuse, homes for the developmentally disabled and for the physically handicapped, religious group quarters, agricultural workers dormitories, vocational training residence facilities, and more. It does not include institutions such as prisons. A study of residence rules in the decennial censuses (National Research Council, 2006, p. 6) found issues with the construction of the group quarters frame and its enumeration:
[A]s implemented in the 2000 and recent censuses, group quarters enumeration is unacceptably bad. Failure to reconcile the group quarters roster with the MAF contributed to a host of census errors. Group quarters frames were constructed without sufficient standardization and awareness of diversity in housing unit and group quarters stock … the challenge of collecting even the basic census items from group quarters’ populations remains.
Another report from the National Research Council (2012) looked at improving the measurement of people living in group quarters on the American Community Survey (ACS), a survey that is sampled from this
same frame.6 Its title—Small Populations, Large Effects—could also be used to describe the measurement of sexual violence to people who live in group quarters. Group quarters residents are likely to have higher, or at least different, risks of such violence. Thus, they are very important to the population estimates, but the number of group quarters selected in the sample is very small. The National Research Council’s report (2012, p. 5) on the ACS concluded:
[The estimates] must rely on a sample of what is a small and very diverse population, combined with limited funding available for survey operations, makes the ACS GQ [group quarters] sampling, data collection, weighting and estimation procedures more complex and the estimates more susceptible to problems stemming from these limitations.
The report provided several recommendations, including that the “Census Bureau should give high priority to developing a detailed and systematic operational plan … for a group quarters address updating system” (National Research Council, 2012, p. 5).
CONCLUSION 7-3 Because the decennial Master Address File, which is used for selecting the main second-stage sample of the National Crime Victimization Survey, is about 15 years old before it is completely updated, there is potential for incompleteness and inefficiency in the frame. The use of a supplemental frame of new building permits and a periodic “area” canvassing of some primary sampling units are helpful, but not a complete solution.
CONCLUSION 7-4 The frame for the ancillary listing of group quarters, which is an important part of the secondary sample for the National Crime Victimization Survey because their residents may be at higher risk for sexual violence, is seriously flawed in terms of both the building and enumeration of this secondary frame.
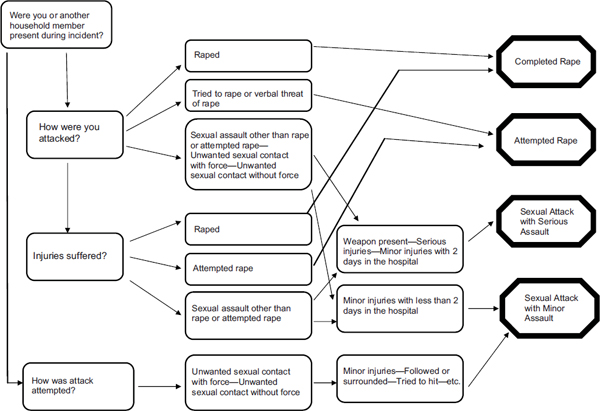
The panel reviewed the processing code that categorizes reported incidents and developed a flow chart of that classification coding. BJS has created eight different categories that encompass the sexual-related incidents that they define as criminal:
___________
6The American Community Survey, which is continuous, has replaced the former “long form” of the decennial census.
1. completed rape,
2. attempted rape,
3. sexual assault with serious assault,
4. sexual assault with minor assault,
5. sexual assault without injury,
6. unwanted sexual contact without force,
7. verbal threat of rape, and
8. verbal threat of sexual assault.
Incidents reported on the NCVS that are classified in one of these categories are considered “criminal victimizations.” The process of classification is complex. Figure 7-3 shows a flow chart for this classification for the four most serious victimizations listed above. It is unclear how often classification errors occur, or how many victimizations fall initially into an “unclassified code” because they cannot be classified through an automated process.
The current screening questionnaire used on the NCVS uses a series of cue screening questions that talk about various life domains such as work and leisure, and trigger memories of victimizations that may have occurred in these domains. A respondent may report a victimization at any point during the screening questionnaire or when answering questions in an incident report. The panel has seen no data that shows the relative rate of reporting of sexual victimization in various parts of the screener questionnaire (or within an incident report for another type of victimization). This would be very interesting data to see, and deserves greater transparency.
The NCVS, like any major survey, includes an extensive edit process. Cleaning up data that have been collected is a major part of the total data collection process. The edit process used by BJS for the NCVS is not included in the description of NCVS methodology. Thus, it was not possible for the panel to assess it, and it is similarly not possible for data users to understand this important assessment of the NCVS.
CONCLUSION 7-5 The Bureau of Justice Statistics does not provide public information on the edit process in the National Crime Victimization Survey, although processing and editing errors are an important part of any major survey data collection. The lack of transparency about these processes makes it difficult for data users to fully understand the survey’s estimates.