
3
Data from Law Enforcement Agencies
This chapter describes the Uniform Crime Reports (UCR) Program that is maintained by the Federal Bureau of Investigation (FBI) using data from local police reports. The program provides important data on crime rates in general and on rates of rape and attempted rape in particular. The UCR is composed of two components: the Summary Reporting System, which was established in 1929 (Wolfgang, 1963), and the newer National Incident-Based Reporting System (NIBRS), which is not yet nationally representative. As background to our discussion of the strengths and weaknesses of both systems and the UCR’s statistics on rape, we begin with a discussion of local police reports that provide the detailed data that go into the UCR.
Basic Reports
Local law enforcement officers compile basic information related to incidents of crimes, arrests, and investigations in a police incident report, referred to simply as the police report. Each jurisdiction and law enforcement organization uses its own format for its police report and has varying instructions on what is to be collected, and when and how it should be completed. A police report may include the following types of information:
• the officer’s identifier;
• name and contact information for the victim, witnesses, and any other individuals known to be involved;
• basic factual information, including location, date, and timing of the incident;
• narrative(s) of what happened, including statements from the victim and any witnesses;
• anything that the officer(s) observed first-hand; and
• a description of any suspects.
A police report may also include an indicator of case closure, such as an arrest, or that the officer judged the complaint to be unfounded.
Not every “call for service” that an officer attends will result in an official police incident report. In addition to the specific reporting guidelines from the law enforcement agency, individual officers have some discretion in deciding whether to fill out a report. Those officers also have some discretion in classifying the type of crime and deciding that a particular complaint is unfounded.
Underreporting of Rape and Sexual Assault
There is ample evidence that the crimes of rape and sexual assault are substantially undercounted through police reports, and this section details a selection of that evidence. Some undercounts appear to be due to victims’ failing to report these crimes to the police, and some to the way in which law enforcement in certain jurisdictions handles both the victims and the police reports of those crimes.
Victims’ Failures to Report
Conducted in 1989-1991, the National Women’s Study (NWS; see Chapter 5) collected information on rape and sexual assault. It estimated that 84 percent of rape victims did not report their victimization to police (Kilpatrick, Edmunds, and Seymour, 1992). Tjaden and Thoennes (2006) reported a similar percentage (81 percent) of nonreporting from the National Violence Against Women Survey (see Chapter 5).
Other evidence of nonreporting comes from the National Crime Victimization Survey (NCVS; see Chapter 4), which includes information on whether a victim reported the incident to police. A recent special report, Victimizations Not Reported to the Police, 2006-2010 (Bureau of Justice Statistics, 2012b), provides basic information on the rates of unreported crimes and the reasons the victims did not involve the police (see Table 3-1).
During the 5 years covered in the special report, the Bureau of Justice
TABLE 3-1 Victimizations Not Reported and Reasons, by Type of Crime, 2006-2010 (in percentage)
| Reason Not Reported | |||||||||
| Type of Crime | Not Reported | Dealt with in Another Way/ Personal Matter | Not Important Enough to Report | Police Would Not or Could Not Help | Fear of Reprisal or Getting Offender in Trouble | Other Reason or No Main Reason | |||
| All crimes | 58 | 20 | 27 | 31 | 5 | 17 | |||
| Rape and sexual assault | 65 | 20 | 6 | 13 | 28 | 33 | |||
| Robbery | 41 | 20 | 13 | 34 | 10 | 23 | |||
| Aggravated assault | 44 | 31 | 16 | 17 | 22 | 15 | |||
| Personal larceny | 41 | 17 | 24 | 43 | 2 | 14 | |||
| Burglary | 45 | 12 | 27 | 40 | 4 | 17 | |||
| Motor vehicle theft | 17 | 16 | 26 | 30 | 7 | 21 | |||
| Theft | 67 | 16 | 31 | 35 | 3 | 16 | |||
SOURCE: Data from Bureau of Justice Statistics (2012b, p. 4): the data are generated from the National Crime Victimization Survey.
Statistics (BJS) estimated that 65 percent of rapes and sexual assaults had not been reported to police. As shown in the table, when asked why they did not report to the police, an estimated 41 percent of the victims thought that either the police would not or could not help or they had a fear of reprisal or getting the offender in trouble; 20 percent had dealt with it in another way or felt it was a personal matter; and 33 percent had another reason or not one most important reason. Only 6 percent thought that the crime was not important enough to report. The Bureau of Justice Statistics (2012b, p. 2) further reported “from 2005 to 2010, the percentage of victimizations that went unreported due to the belief that the police would not or could not help increased from 7% to 20%.” In addition, it is important to note that all of these figures exclude rapes and sexual assaults that were not reported to police and also not disclosed in the NCVS.
Wolitzky-Taylor et al. (2011, pp. 809-810) summarized the research on the victim and offender characteristics that were related to the decision not to report rape and sexual violence to police:
Stranger rapes are more likely to be reported than rapes by acquaintances (Estrich, 1987). Victims who sustain injuries are also more likely to report their rapes (Bachman, 1993, 1998; Lizotte and Wolfson, 1981), as are those whose assailants used weapons during the rape (Amir, 1971; Bachman, 1998; Lizotte and Wolfson, 1981). Furthermore, victim use of alcohol and/or drugs at the time of the assault has been found to be associated with lower likelihood of reporting (Clay-Warner and Burt, 2005; Fisher et al., 2003).
Demographic variables have also been associated with reporting. One study found that married rape victims and highly educated rape victims were more likely to report than unmarried victims and less educated victims (Lizotte, 1985). Another study found that reports were more likely to be made if the perpetrator was African American (Greenberg and Ruback, 1992).
Police Responses to Reports
In September 2010, the Subcommittee on Crime and Drugs of the Senate Committee on the Judiciary held a hearing titled Rape in the United States: The Chronic Failure to Report and Investigate Rape Cases.1 As summarized by one of the witnesses in prepared testimony, witnesses were asked to comment on three factors related to police handling of reported rape crimes that might contribute to an undercount in statistics from law enforcement agencies: police not accepting rape and other sex crimes for
_____________
1The hearing occurred on September 14, 2010, and its report was published in 2011 as S.Hrg. 111-891.
investigation; police misclassifying rape and other sex crimes as non-crimes; and police “unfounding”2 rape cases at an extremely high rate (Dempsey, 2010, p. 1).
A very well-publicized example that involved the Philadelphia Police Department was uncovered and reported by the Philadelphia Inquirer in the late 1990s. It revealed a 20-year long practice of downgrading rape cases to a noncriminal category. “The methods and motives varied but the result was almost always the same—to shift offenses out of the ‘Part I’ group of major crimes tallied nationally by the FBI [in the UCR] and watched closely by the media, the public, politicians and the headquarters brass” (Matza, McCoy, and Fazlollah, 1998). The current Philadelphia Police Commissioner testified at the 2010 Senate hearing, saying, “the deliberate downgrading of rape cases in the Philadelphia Police Department in the late 1990s … was a pervasive and systemic failure” (Ramsey, 2010, p. 2).
Similar concerns were raised in a 2010 Baltimore Sun article. Reviewing 4 years of UCR data, the reporter found that the Baltimore Police Department coded reported rape cases as false or baseless 30 percent of the time, more often than any other city in the country. In addition, the article noted (Fenton, 2010): “[I]n 4 of 10 emergency calls to police involving allegations of rape, officers conclude that there is no need for a further review, so the case never makes it to detectives—a proportion that experts say is disturbingly high.”
In Louisiana, a 2009 article in the New Orleans Time-Picayune stated (Maggi, 2009): “[M]ore than half the time New Orleans police receive reports of rape or other sexual assaults against women, officers classify the matter as a noncriminal ‘complaint.’” UCR statistics for New Orleans for rape and attempted rape showed a sharp decrease from 2007 to 2008, in contrast with data from the Interim Louisiana State University Public Hospital, where rape victims seeking treatment increased during that same period.
Yet another example comes from Detroit. A recent report found that between 9,000 and 11,300 rape kits3 were stored for many years, untested, by Detroit police (Williams, 2012).
_____________
2Dempsey (2010, pp. 1-2) further elaborates on three possible reasons for the “unfounding”: (1) police misconduct, malfeasance, or lack of proper education regarding the investigation of rape; (2) the existence of a “justice gap” indicating the continued need for law reform; and (3) the limited range of categories in the UCR available to police officers in recording case dispositions.
3The sexual assault forensic exam kit (commonly referred to as a “rape kit”) is the collection of DNA and other forensic evidence, which is then kept by the sexual assault nurse examiner or medical provider until picked up by law enforcement or the crime lab (Rape, Abuse and Incest National Network, n.d.).
The Summary Reporting System
More than 80 years ago, in 1929, the International Association of Chiefs of Police published Uniform Crime Reporting: A Complete Manual for Police and instituted an experimental reporting system with the purpose of providing uniform crime statistics across jurisdictions. The FBI began managing that system the following year and published the first bulletin of Uniform Crime Reports (Wolfgang, 1963). The FBI has maintained the Summary Reporting System (SRS) since then.4 (For a history of changes to the SRS system across those seven decades, see Barnett-Ryan, 2007.)
Although reporting is voluntary, approximately 18,000 law enforcement organizations across the United States contribute to the SRS of the UCR (Federal Bureau of Investigation, n.d.-a), based on information taken from their local police incident reports. Ninety percent of all jurisdictions participate in this system, with coverage of urban areas slightly higher than coverage of rural areas. The FBI produces simple aggregations of these monthly reports from jurisdictions, and uses this compiled information to issue several annual statistical publications, with Crime in the United States most relevant to this project.
Because crime statutes related to rape and sexual assault vary across jurisdiction, the FBI attempts to provide uniformity in what is reported by these jurisdictions and how incidents are classified in that reporting through a guidance handbook, the Uniform Crime Reporting Handbook (Federal Bureau of Investigation, 2004). The most recent edition of the Handbook is dated 2004.5 On its website, the FBI (n.d.-a) discusses the Handbook, stating:
[It] explains how to classify and score offenses and provides uniform crime offense definitions. Acknowledging that offense definitions may vary from state to state, the FBI cautions agencies to report offenses not according to local or state statutes but according to those guidelines provided in the handbook. Most agencies make a good faith effort to comply with established guidelines.
However, because police investigate crimes and complete reports in the framework of their own jurisdictional statutes, law enforcement agencies are being asked to report a summary of these crimes on the UCR based on a different set of definitions characterizing those events. To assess this process
_____________
4The SRS, unlike the NIBRS, contains only summary-level data, not incident-level data.
5In June 2013, the FBI released a Summary Reporting System (SRS) User Manual, Version 1.0, as a replacement for the Handbook. However, this chapter (and this report) use the 2004 Handbook as reference because it was the standard during the panel’s data gathering period.
the FBI offers a voluntary UCR Quality Assurance Review (QAR) as part of a triennial audit of states’ criminal justice information systems (Federal Bureau of Investigation, 2004, p. 3):
The purpose of the QAR is to ensure that each state UCR Program adheres to summary and incident-based reporting methods that are consistent with UCR standards in order to achieve uniform crime reporting nationwide. In 2001, the QAR incorporated a statistical sampling methodology to select records for data quality review and to project the number of discrepant crime reports a state UCR Program submits to the national UCR Program.
The panel did not find any public information that includes or summarizes results from these quality reviews.
The guidelines in the Handbook divide crimes into two categories: major crimes (known as Part I crimes) to be recorded as “crimes known to police” and other crimes (Part II) ranging from minor assault to vagrancy.6 “The Part I offenses came to be used as a crime index, much like a price or cost-of-living index” (Wolfgang, 1963, p. 709).7 Part II offenses are reported on the UCR only after arrests are made.
Law enforcement agencies submit a monthly summary of crimes for the SRS component of the UCR. The primary reporting form,8Return A—Monthly Return of Offenses Known to the Police, lists seven major (Part I) crime categories: criminal homicide, forcible rape, robbery, assault, burglary, larceny, and motor vehicle theft. Each major category has several subcategories (see Figure 3-1). For each major category and subcategory, the form requests the following information:
• number of offenses reported or known to police (includes “unfounded” and attempts);
• number of unfounded offenses (i.e., false or baseless complaints);
• number of actual offenses (unfounded offenses subtracted from the total);
• number of offenses cleared by arrest or exceptional means; and
• number of clearances involving only persons under 18 years of age.
_____________
6Part II offenses include other assaults; forgery and counterfeiting; fraud; embezzlement; stolen property—buying, receiving, possessing; vandalism; weapons—carrying, possessing, etc.; prostitution and commercialized vice; sex offenses; drug abuse violations; gambling; offenses against the family and children; driving under the influence; liquor laws; drunkenness; disorderly conduct; vagrancy; all other offenses; suspicion; curfew and loitering laws; and runaways.
7The systematic downgrading of reports of rape from a Part I crime to a Part II crime in certain jurisdictions was the subject of newspaper investigations described above.
8Several other forms are submitted monthly for the SRS, but they are not relevant to the crimes of rape and sexual assault.
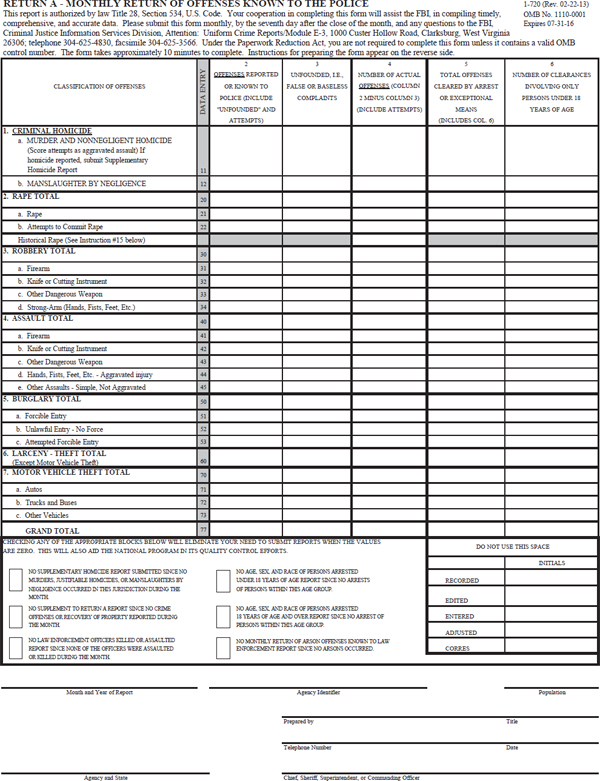
INSTRUCTIONS FOR PREPARING RETURN A
(Detailed instructions are given in the Uniform Crime Reporting Handbook )
1. All Offenses listed on the Return A which occur during the month should be scored whether they become known to the police as the result of:
a. Citizens' complaints.
b. Reports of police officers.
c. “On view” (pick-up) arrests.
d. Citizens' complaints to sheriff, prosecutor, county police, private detectives, constables, etc.
e. Any other means.
2. The offenses listed in Column 1 are the Part I offenses of the Uniform Crime Reporting Program plus the offenses of simple assault and manslaughter by negligence. Follow the instructions for classifying and scoring as presented in the Uniform Crime Reporting Handbook. Offenses committed by juveniles should be classified in the same manner as those committed by adults even though the juveniles may be handled by juvenile authorities.
3. Adjustments should be made on this month's return for offenses omitted or scored inaccurately on returns of preceding months or those now determined to be unfounded. Offenses that occurred in a previous month but only became known to you this month should be scored this month.
4. Consider all spaces for each classification of offenses in Columns 2, 3, 4, 5, and 6. The breakdowns for rape, robbery, assault, burglary, and motor vehicle theft, when added should equal the total for each of these offenses. Do not enter zeroes where no count exists.
5. Attempts of rape, robbery, assault, burglary, larceny-theft, and motor vehicle theft are to be scored on this form.
6. Column 2: Enter opposite the proper offense classification the total number of such offenses reported or known through any means. "Unfounded" complaints are included. Attempts are included except in homicide classifications.
7. Column 3: Enter the number of complaints which were proven to be "unfounded' by police investigation. An "unfounded" offense is one in which a complaint was received, but upon investigation, proves either to be baseless or not to have actually occurred. Remember that recovery of property or clearance of an offense does not unfound a complaint.
8. Column 4: Number of actual offenses. This number is obtained by subtracting the number in Column 3 from that in Column 2.
9. Column 5: Enter the total number of offenses cleared during the month. This total includes the clearances which you record in Column 6. An offense is cleared when one or more persons are charged and turned over for prosecution for that offense. Clearance totals also include exceptional clearances which are explained in the Uniform Crime Reporting Handbook.
10. Column 6: Enter here the number of offenses which are cleared through the arrest, releasing to parents, or other handling of persons under the age of 18. In those situations where an offense is cleared through the involvement of both an adult and a person under 18 years of age, count the clearance only in Column 5.
11. The grand totals for Columns 2, 3, 4, 5, and 6 are the totals of each of the seven classifications.
12. Tally books can be used to maintain a running count of offenses through the month. Totals for the Return A can then be taken directly from the Tally book. These Tally books can be obtained by corresponding with the FBI, Criminal Justice Information Services Division, Attention: Uniform Crime Reports/Module E-3, 1000 Custer Hollow Road, Clarksburg, West Virginia 26306; telephone 304-625-4830, facsimile 304-625-3566.
13. This Return A report should be forwarded to the FBI Uniform Crime Reports even though no offenses of this type listed were committed during the month. However, it is not necessary to submit supplemental reports in such cases. Simply check the appropriate box within the block near the bottom of the Return A report.
14. Any inquiry regarding the completion of this form, the classification and scoring of offenses, or prior to submitting crime data by computer printout, contact the Uniform Crime Reporting Program at the above-mentioned address.
15. Reporting according to the historical definition of rape is optional. This count should be included in the total reported in line 2a or line 2b. It is intended to be used for trending purposes.
It is important to note that these are the only crimes that are reported to the FBI on the Return A, and thus the only crimes (except arson)9 that are included in the crime rates published in Crime in the United States.
When multiple Part I crimes are committed simultaneously by the same
_____________
9Arson is a Part I crime, but data on it are collected on a separate form instead of the Return A.
offender(s) on the same victim in the same incident, the Handbook provides a hierarchy rule and states that the “multiple crime” should be categorized as the single crime highest in the hierarchy list.10 This rule ensures that the incident is reported only once on the Return A. For example, a rape/homicide would be classified as a homicide, and a rape/robbery would be classified as a rape.
Definition of Rape in the UCR SRS
In regard to rape and sexual assault, it is important to consider the definitions used in the UCR. Under forcible rape, there are two subcategories: “rape by force” and “attempts to commit forcible rape.” The FBI provides a definition of forcible rape in the 2004 version of the Handbook (the latest as of the development of this report) as the “carnal knowledge of a female forcibly and against her will” (Federal Bureau of Investigation, 2004, p. 19). The Handbook further explains that “carnal knowledge” is penetration (however slight) of a penis into a vagina. This definition of rape in the UCR has remained essentially unchanged since 1929, and the category of sexual assault does not exist in the UCR. Thus, sexual assaults that do not meet the above narrow definition of rape are included with the more general category of “aggravated assault” as a Part I crime or as “other assaults” as a Part II crime.
Discussions to update the definition of forcible rape used by the UCR began in 1999 and moved through a series of reviews, input from police organizations, further discussions, and public hearings (Federal Bureau of Investigation, 2013); a revision was announced on January 6, 2012, by Attorney General Eric Holder. The revision, which is designed to lead to a more comprehensive reporting of rape through the UCR, is more aligned with changes that individual jurisdictions have been making in criminal statutes since the 1970s. The new definition of forcible rape is as follows (Federal Bureau of Investigation, 2012):
The penetration, no matter how slight, of the vagina or anus with any body part or object, or oral penetration by a sex organ of another person, without the consent of the victim.
The new definition is a substantial change from the older definition: it recognizes that males as well as females may be rape victims; it includes penetration in the anus and mouth as well as in the vagina; and it in-
_____________
10Hierarchy List of Part I crimes, in descending order: criminal homicide, forcible rape, robbery, aggravated assault, burglary, larceny-theft (except motor vehicles), motor vehicle theft, and arson. The Handbook hierarchy list also includes subcategories within each of these major categories.
cludes penetration by body parts other than a penis or by objects. This new definition was expected to be used operationally on the Return A beginning January 2013.
Statistics from the UCR SRS
The FBI annually publishes Crime in the United States based on data from the UCR SRS. The most recent edition is for 2011, and therefore the statistics in this volume reflect the pre-2012 definition of forcible rape. That is, these counts include forcible rape and attempted rape as described above. In 2011, the UCR counted 83,425 forcible rapes (see Table 3-2 and Figure 3-2 for data from 1992 through 2011). Because of the narrow definition of rape and the likely underreporting of these victimizations (discussed above),
TABLE 3-2 Counts of Forcible Rapes and Attempted Forcible Rapes, Uniform Crime Reports Summary Reporting System
| Year | Population | Forcible Rapes and Attempted Rapes | Rate per 1,000 People | ||||||
| 1992 | 255,029,699 | 109,062 | 0.428 | ||||||
| 1993 | 257,782,608 | 106,014 | 0.411 | ||||||
| 1994 | 260,327,021 | 102,216 | 0.393 | ||||||
| 1995 | 262,803,276 | 97,470 | 0.371 | ||||||
| 1996 | 265,228,572 | 96,252 | 0.363 | ||||||
| 1997 | 267,783,607 | 96,153 | 0.359 | ||||||
| 1998 | 270,248,003 | 93,144 | 0.345 | ||||||
| 1999 | 272,690,813 | 89,411 | 0.328 | ||||||
| 2000 | 281,421,906 | 90,178 | 0.320 | ||||||
| 2001 | 285,317,559 | 90,863 | 0.318 | ||||||
| 2002 | 287,973,924 | 95,235 | 0.331 | ||||||
| 2003 | 290,788,976 | 93,883 | 0.323 | ||||||
| 2004 | 293,656,842 | 95,089 | 0.324 | ||||||
| 2005 | 296,507,061 | 94,347 | 0.318 | ||||||
| 2006 | 299,398,484 | 94,472 | 0.316 | ||||||
| 2007 | 301,621,157 | 92,160 | 0.306 | ||||||
| 2008 | 304,059,724 | 90,750 | 0.298 | ||||||
| 2009 | 307,006,550 | 89,241 | 0.291 | ||||||
| 2010 | 309,330,219 | 85,593 | 0.277 | ||||||
| 2011 | 311,591,917 | 83,425 | 0.268 | ||||||
NOTE: Population numbers are U.S. Census Bureau provisional estimates as of July 1 for each year except 2000 and 2010, which are decennial census counts. The rate per 1,000 people is based on those population counts.
SOURCE: Data from online Uniform Crime Reports Data Tool, Federal Bureau of Investigation (n.d.-c).
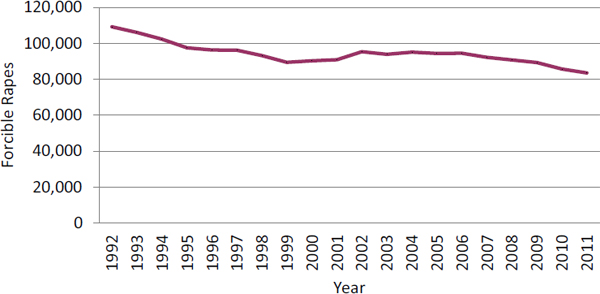
FIGURE 3-2 Forcible rapes and attempted rapes, Uniform Crime Reports Summary Reporting System.
SOURCE: Data from online Uniform Crime Reports Data Tool, Federal Bureau of Investigation (n.d.-c).
the numbers significantly underestimate the number of rape crimes. Other types of sexual assault are not included in these numbers.
The UCR SRS documentation is fairly clear in how these statistics are tabulated based on the reports submitted to the FBI from various law enforcement agencies. However, the details of how these law enforcement agencies actually complete their monthly reports are very murky. It is particularly unclear how an agency would categorize a victimization that is considered rape under state/local statutes but not under the FBI definition. Is this situation handled consistently across agencies? This is an important question that needs more transparency.
The NIBRS Component
The National Incident-Based Reporting System is a modern addition to the UCR system that reflects several innovations in comparison with the SRS. It is incident based (i.e., a record is submitted for each incident), rather than based on a monthly summary of incidents. This approach provides the opportunity to include more important information about each incident that cannot be included in a summary system. A second innovation is that the NIBRS reports on 46 different types of offenses.
Currently, only 6,444 law enforcement agencies representing approximately 25 percent of the U.S. population report through NIBRS instead of the SRS. FBI personnel generate monthly reports for those agencies from NIBRS for the SRS. Because of the relatively few agencies that report through NIBRS, it cannot be used for meaningful national-level crime statistics.11 Consequently, the panel did not use data from NIBRS in this report. Many users of UCR crime data would like to see this system grow and develop so that it replaces the SRS.
_____________
11The panel is unaware of any existing statistical procedure for extrapolating the NIBRS data to the entire United States.


