
2
Concepts and Uses of Indicators
The purpose of this chapter is to introduce the concept of “indicators” as distinct from raw data and basic science and engineering statistics. It is also useful for the reader to understand how the production of science, technology, and innovation (STI) indicators is informed by the precepts of conceptual or logic models that attempt to reflect the actors, actions, dynamics, systems, and resulting outcomes that analysts try to capture. Entailed in this process are assumptions, reasoned inferences, and a “black box” (see Rosenberg, 1982) where tangible and intangible inputs become measurable outputs.
One difficulty encountered in constructing the STI indicators users want is that users are not monolithic. The specific types of indicators users need depend on the types of decisions they must make and the networks to which they belong. User diversity was therefore an important consideration as the panel deliberated on which indicators the National Center for Science and Engineering Statistics (NCSES) should produce in the future. Also considered was the expected diversity of the future user base—for instance, the potential for more business users and more users who must make decisions in regional contexts within the United States and abroad.
At the same time, however, all users want reliable values and to varying degrees wish to have the “black box” mechanisms exposed and detailed to the extent possible. As discussed in Chapter 1, users of STI indicators share the need for high-quality, accessible, and timely observations on the rapidly changing global STI system. In addition, they expect those measures to be based on fundamentals and not merely on ad hoc relationships.
After defining the term “indicators” for this volume, the main task of this chapter is to demonstrate the utility of STI indicators, specifying those that address specific policy issues. In the process, the chapter establishes the characteristics of and user priorities for these indicators, many of which are already satisfied by NCSES’s publications and data tables (as discussed in Chapter 3).
DESIRABLE ATTRIBUTES OF INDICATORS
Generally, indicators point toward or foreshadow trends, turning point patterns, expectations, and intentions. They are often things one should know about issues of interest to a variety of users. Indicators have analytical qualities such that they typically go beyond raw data. As a result, they are usually rough proxies for activities that are difficult to observe or measure directly. They are like baseball statistics: a single statistic is unlikely to tell the whole story; instead, users often rely on a collection or suite of indicators. Furthermore, indicators should not be used in isolation; they require contextual information to be useful. Indicators can be composite indices of other statistics, designed to smooth out volatility in contributing factors. Indicators also provide input for the construction of econometric models used to evaluate the key determinants in systems and guide policy development.
Most familiar indicators are related to the weather or the economy. For example, The Conference Board publishes leading, coincident, and lagging economic indicators. The index of leading economic indicators comprises 10 individual measures, each of which is a leading indicator. These leading indicators are designed to signal coming peaks and troughs in the economic business cycle. Leading indicators inform prospective analyses, while coincident and lagging indicators facilitate contemporaneous or retrospective analyses.
This report focuses specifically on statistical indicators of STI activities—their composition, uses, and limitations—and hence the statistical measurement of activities that fall within the mandate of NCSES. To discuss measurement, the report defines a statistical indicator as a statistic, or combination of statistics, providing information on some aspect of the state or trends of STI activities. International comparability of these indicators is an important quality because it provides a benchmark against which to judge the performance of one system relative to others. STI indicators often substitute for direct measures of knowledge creation, invention, innova-
tion, technological diffusion, and science and engineering talent, which would be difficult if not impossible to obtain. For example, economic growth in a given nation is linked to the ingenuity of residents in science and engineering sectors. Since it is difficult to measure ingenuity directly, proximate measures that are more readily observed are used, such as numbers of master’s or Ph.D. degrees produced in a given nation within a given time period. Following trends in the number of degrees also enables users of indicators to develop projections of future economic growth. Notably, these indicators do not precisely measure ingenuity, but they are arguably reasonable proxies. Techniques for obtaining data that directly measure innovation activities are improving, however,1 and these data are already being used to complement indicators derived with traditional methods.
Some indicators—those derived from modeling—can answer certain policy questions. Indicators also can reveal potential issues that require exploring, for example, the impact and cost-effectiveness of research and development (R&D) tax credits in stimulating incremental business R&D. Moreover, indicators can help refine and perhaps usefully narrow the policy question being asked. For example, is it innovation by large businesses or small, young firms that yields faster and more lucrative breakthroughs?
A comprehensive review of the use of STI indicators for policy decisions is provided by Gault (2010), who outlines four ways indicators are used for policy purposes: monitoring, benchmarking, evaluating, and forecasting or “foresighting”:2
- monitoring—the international innovation system, linkages within and between national innovation systems, regional innovation systems and industrial clusters, the implementation of national science and technology (S&T) projects, the selected quantitative indicators in the S&T development goals;
- benchmarking—international and interprovincial (or interstate) benchmarking;
- evaluating—the performance of public investment in S&T, the performance of government research institutes and national laboratories, national S&T programs, specialization of S&T fields, advantages versus disadvantages, emerging industries (e.g., information technology, biotechnology, energy, health, knowledge-based services); and
- forecasting—the latest data not available in gathered statistics.
These categories are widely accepted as functional characteristics of STI indicators. For instance, at the panel’s July 2011 workshop, Changlin Gao reported that they are being used by China to target its STI indicators program.
At the same workshop, several other presenters suggested attributes that NCSES should keep in mind as it develops new STI indicators and improves existing indicators. One such attribute is low sensitivity to manipulation. During the workshop, Hugo Hollanders of UNU-MERIT3 stated that composite indices have both political and media appeal,4 although caution is essential in interpreting such indices, which may be readily understood but may not be adequate for conveying complex information. Other desirable characteristics of indicators mentioned by workshop participants included being scientifically derived and evidence based, comparable across regions, powerful for communication, affordable, accessible, scalable, sustainable, and policy and analytically relevant. STI indicators also should be policy neutral, even though the particular indicators selected may reflect the preferences of the stakeholders who request them.
During its deliberations, the panel encountered several challenges in seeking a single framework or model for the STI system.
First, all the known elements of the STI system are not necessarily measurable; some are “unknown knowns.” Because poor measurement often leads to poor decision making, recommending the development of new but perhaps mismeasured indicators could leave users worse off than they are now.
Second, although linkages among the elements in a representation of the STI system are important to measure, such linkages often are difficult to identify quantitatively. In these instances, case studies or qualitative representations may be preferable to indicators. Moreover, spillover effects—for example, when two or more elements in the system contribute to synergistic or configural outcomes—are difficult to disentangle, and developing indicators that measure such effects is therefore a difficult task. Thus, linkages and spillovers often are “unknown unknowns”; that is, developing reliable indicators of these important components of the STI
____________________
1See Eurostat’s Community Innovation Statistics in European Commission (2010) and NCSES’s Business Research and Development and Innovation Survey statistics in U.S. Department of Commerce (2011).
2Wehrmeyer and colleagues (2002) give extensive definitions of foresighting as the term is used differently in business consulting and in government decision-making practices. Citing Coates (1985, p. 30), Wehrmeyer and colleagues give the generic definition of foresighting as follows: “Foresighting is a process by which one comes to a fuller understanding of the forces shaping the long-term future which should be taken into account in policy formulation, planning and decision-making…. Foresight involves qualitative and quantitative means for monitoring clues and indicators of evolving trends and developments and is best and most useful when directly linked to the analysis of policy implications.”
3UNU-MERIT—the United Nations University Maastricht Economic and Social Research Institute on Innovation and Technology—is a research and training center of the United Nations University and works in close collaboration with the University of Maastricht.
4To clarify, the panel is not advocating that NCSES develop one composite indicator, or as it is often termed, a “headline indicator.” A suite of key STI indicators should be more informative for users.
system is difficult. For example, developing valid measures of intangible assets is problematic precisely because they are typically intermediate inputs with realized values that depend on the values of other outputs over some time horizon.
Third, models of the STI system or its components are plentiful and typically are shaped by the user’s goal (see, e.g., Cornell University, INSEAD, World Intellectual Property Organization, 2013, p. 6; Crépon et al., 1998; Department of Business Innovation and Skills, 2011, p. 30; European Union, 2013, p. 4; Griliches, 1998, pp. 17-45; Hall and Jaffe, 2012; Hall et al., 2010; National Science Board, 2012c, p. 3; OECD, 2011; Sampat and Lichtenberg, 2011; Shanks and Zheng, 2006, pp. 105 and 288; Tassey, 2011). For example, some models list elements that have been shown to matter, either alone or in combination with other elements, to generate new ideas, products, processes, and other outcomes of the STI system, while other models are functional, in that the stocks (boxes) and flows (arrows connecting the boxes) represent estimable elements. Many of these models identify the same key elements that should be measured (or at least assessed), while offering added dimensionality depending on the model’s utility.
Economists, policy analysts, information scientists, material scientists, physicists, statisticians, and geographers (all represented on the panel) have different predilections for how to develop a representative model of the STI system. The identification of one common model by the panel was unlikely and could have appeared to be ad hoc or arbitrary. Therefore, instead of choosing a single model for the STI system, the panel used aspects of several models to inform its decisions about which elements of the system are most important to assess. Box 2-1 shows seven of the “models” that informed the panel’s guiding framework of key STI indicators that NCSES should produce. Since its charge was to focus on identifying policy-relevant, internationally comparable STI indicators, the panel also decided to use a policy-driven approach. This approach was informed by the published work of leading academicians and practitioners who map the STI system, as well as experiences in the international S&T policy arena. The resulting policy-driven framework, depicted in Figure 2-1, identifies key activities that should be measured, as well as the links among these activities and the actors and outcomes in the STI system.
The panel’s policy-driven framework provides a useful rubric for identifying the key policy issues and the indicators that can support analysis of these issues. These issues can range from highly aggregate (e.g., What is the contribution of STI to growth?) to highly granular (e.g., What is the supply of individuals with science, technology, engineering, and mathematics [STEM] skills by gender and ethnicity?). The issues tend to change over time (e.g., geographic interest has shifted from Japan to China, while sectoral interest has shifted from space to nanotechnologies). In some cases, the indicators needed to examine these issues are quite advanced, in other cases they are being developed, and in still other cases they are still in an embryonic state and require that NCSES partner with other organizations in their development. In nearly all cases, indicators offer only partial insight into the issue; gaining insight into the key determinants often requires empirical analysis involving econometric or growth accounting techniques or qualitative analysis that makes use of stylized facts or case studies. In any event, high-quality, policy-relevant data are needed to construct the indicators, support the econometric analysis, and create the stylized facts.
Policy makers, policy analysts, and the greater user community have an almost inexhaustible supply of questions they would like to have indicators to inform. Statistical agencies therefore are challenged as they seek to address user demands within the practical limits of available resources and expertise. With this tension in mind, the panel sought to populate its framework with a set of policy questions it believes are enduring and can serve as part of a strategic plan going forward.
As shown in Figure 2-1, the key question on which almost all users want bedrock statistics is: What are the social returns to public and private expenditures on STI activities? The follow-on question is: Given expenditures on STI activities, what is the impact on economic growth, competitiveness,5 and jobs? These questions are nuanced in several ways. Users want to know the drivers of innovation that could be encouraged through funding mechanisms and creative organizational structures. For example, indicators are sought not only for static measures of stocks of human capital, but also for trends as to which countries will be generating the most scientific research that can be commercialized or which countries are likely to attract the most R&D investments in the near future. Users have questions about advances in science on the horizon or vulnerabilities in the innovation ecosystem that could impede the commercialization of new ideas. They want quantitative measures to inform these questions, but they also need stories or case studies to provide a full understanding of the issues. Users are interested in the most fertile organizational structures or networks that foster creativity and the transfer of technology from bench to market. They also are interested in the nature of cooperative relationships that foster collaboration while protecting intellectual property rights and downstream profits and mitigating risks. Distributional questions are
____________________
5The term “competitiveness” as used here denotes relative standing. Users of STI indicators often want to know the U.S. position relative to other nations on factors that are critical to U.S. preeminence in STI outcomes. Users are also interested in the standing of certain demographic groups and economic regions vis-à-vis other groups and geographic regions, respectively. The term “competitiveness” here does not relate to low cost or high profitability (as it often does in economics), and it does not necessarily have a strategic basis (as it does in the business literature).
BOX 2-1
Conceptual and Functional Models of the Science, Technology, and Innovation System (Synthesized by the Panel to Create Figure 2-1)
Innovation Systems: The National Science Board has used a systems model to illustrate what its data and statistics attempt to measure. The purpose of this diagram (see Figure Box 2-1A) is to show key elements in the global innovation system and the relationships between elements in the system. As important as it is to measure variables in the boxes or to develop scenarios that explain those elements, it is as important to measure or explain the linkages (arrows) between the boxes. This diagram has several “black boxes” or “assumptions” that require further explanation, and government expenditures on research and development (R&D) at universities and firms, and public sector R&D are not explicitly shown in this diagram.
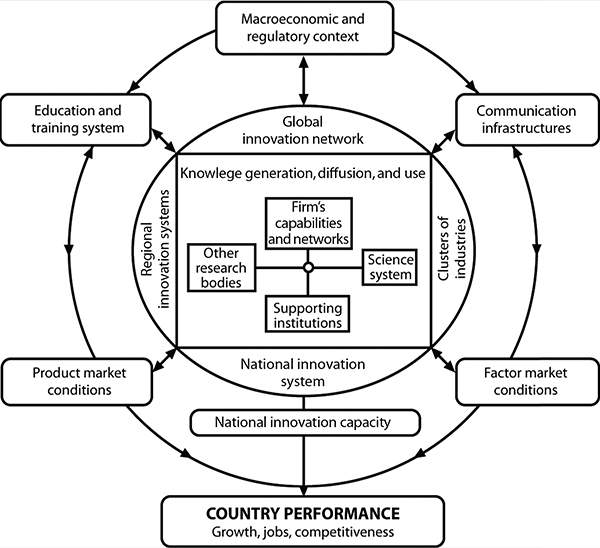
FIGURE BOX 2-1A
SOURCE: National Science Board (2012b).
Knowledge Capital: With a focus on measuring innovation and knowledge assets, Cornell University, INSEAD, and the World Intellectual Property Organization collaborated on a representation of the innovation system (see Figure Box 2-1B). The European Commission framework has similar elements, with human and financial capital inputs, linkages and employment outputs specifically identified (see Figure Box 2-1C). Together these frameworks capture many important dimensions of the STI system.
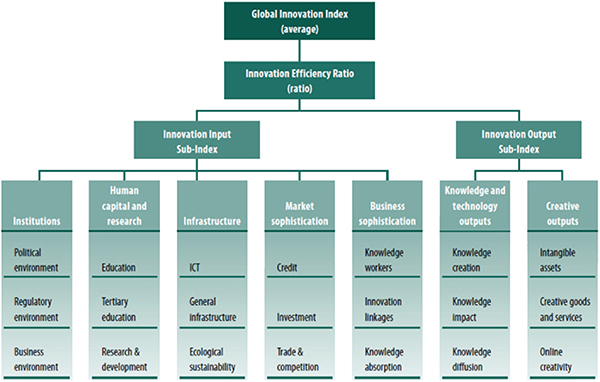
FIGURE BOX 2-1B
SOURCE: Cornell University, INSEAD, and World Intellectual Property Organization (2013).
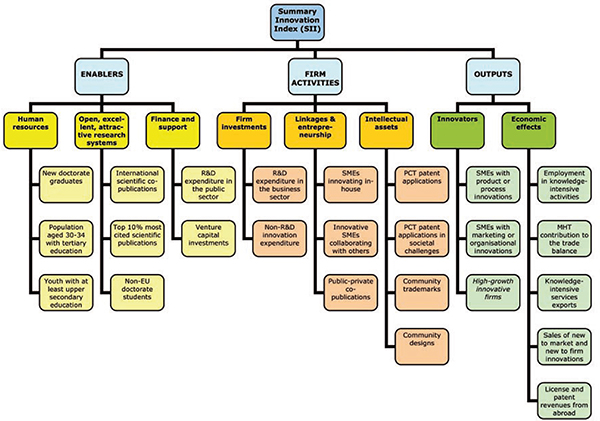
FIGURE BOX 2-1C
SOURCE: European Union (2013).
Return on Expenditure: Growth accounting models are also used to describe the STI indicators system. STI indicators are often used to relate knowledge inputs to outputs, outcomes, or impacts. At a very basic level, knowledge inputs include years of schooling, level of degree, and the amount of training an employee receives on the job. Outputs are specific products, processes, or services. Outcomes and impacts are the near-term and long-term effects and ramifications to the economy or society in which the technological ecosystem operates. Productivity and returns on expenditures are often used to measure economic outcomes of STI activities. Other social outcomes, such as improvements in health outcomes associated with cleaner water or more effective medical treatments, are important to assess. For example, scientific advancement in detecting and removal of pathogenic microorganisms leads to technological mechanisms that in turn lead to cleaner water, thereby increasing productivity (through a healthier workforce) and hence increasing inputs in the production of goods and services, as well as increased welfare of citizens. Indicators are relied on for both post-activity evaluations and analysis prior to an activity, although there are major limitations in using STI indicators for predictive exercises. [See Abramovitz (1956); Carson et al. (1994); Fraumeni and Okubo (2005); Jorgenson and Griliches (1967); Solow (1957).] Other models focus on returns to R&D, where the framework is similar to the traditional production function/total factor productivity model. It is important to note that the second diagram calls out obsolescence of knowledge, making it important to measure not only the depreciation of capital stock but also the depreciation of knowledge and human capital. [See Crépon et al. (1998), see Figure Box 2-1D below; David (2010); Furman et al. (2002); Griliches (1958, 1998); Hall-Jaffe (2012); OECD (2009); Jorgenson and Gollop (1992); Mairesse and Mohnen (2010); Nelson (1993); Rogoff (2012); Shanks and Zheng (2006), see Figure Box 2-1E below; Solow (1994); and Soete (2012).]
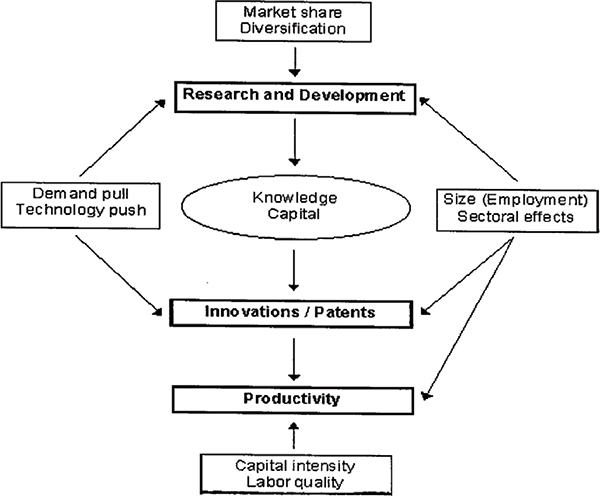
FIGURE BOX 2-1D
SOURCE: Crépon et al. (1998).
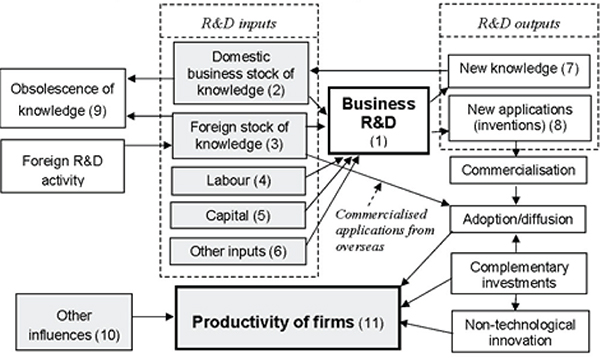
FIGURE BOX 2-1E
SOURCE: Shanks and Zheng (2006).
Specific Outcomes: There are models that look at specific outcomes of scientific and innovation activities, such as Acemoglu et al. (2012), David (1990), David et al. (2011), Mowery (2010), Popp (2010), Rogoff (2011), and Sampat (2011). Sampat’s logic model of publicly funding R&D shows the pathways to new medical products and eventually health outcomes resulting from initial R&D expenditures. This model (see Figure Box 2-1F) shows the importance of measuring nodes and connections between nodes, which show the influence on health outcomes of various elements in the system.
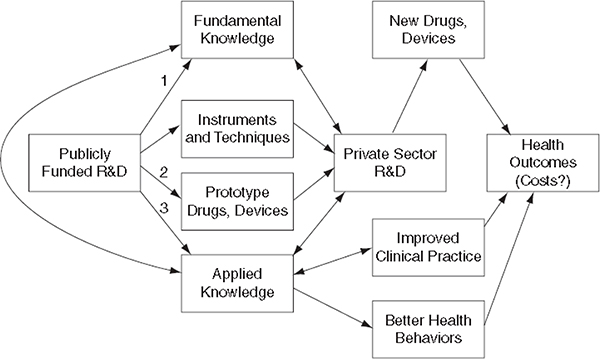
FIGURE BOX 2-1F
SOURCE: Sampat (2011).
Linkages: There are frameworks that identify specific relationships between actors in the STI system (see Figure Box 2-1G). Tassey (2011) highlights the coexistence of government and private funding for technological development. The blue shows contributions from government agencies while the red shows funding from private firms and organizations. This is a relational model but not necessarily predictive.
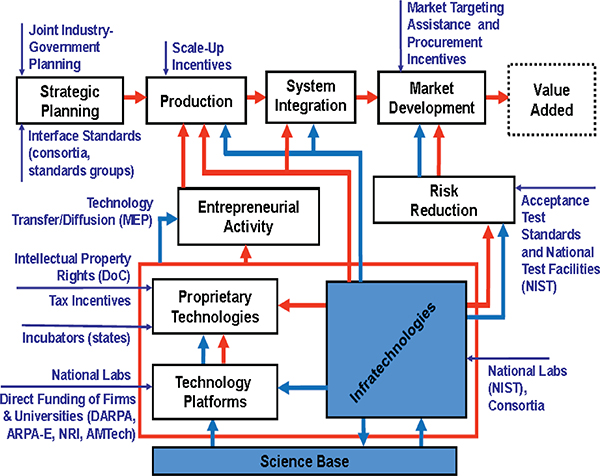
FIGURE BOX 2-1G
SOURCE: Tassey (2011).
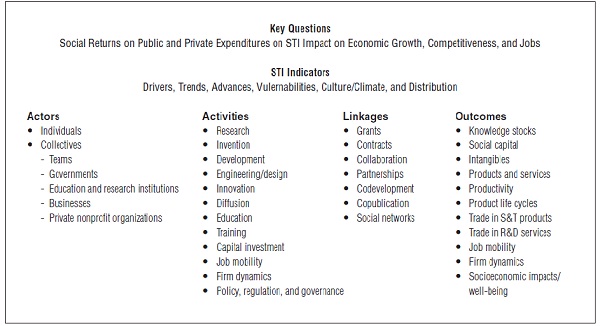
FIGURE 2-1 A policy-driven framework for STI indicators.
NOTE: R&D = research and development; S&T = science and technology; STI = science, technology, and innovation. SOURCE: Panel’s own work.
important in many areas, including geospatial hot spots for entrepreneurial activities; potential avenues for broadening the participation of women, minorities, and people with disabilities in STEM fields; contributions to S&T breakthroughs from the social and behavioral sciences; the uptake of ideas for innovation from consumers; and the inclusivity of growth for various rungs of society. All of these top-level issues—drivers, trends, advances, vulnerabilities, relationships, and distributions—have underlying metrics that users want.6
At the panel’s June 2012 workshop, representatives of the OECD-National Experts on Science and Technology Indicators (NESTI) Working Group implicitly described the STI system.7 A system consists of actors, engaged in activities, with linkages to other actors and activities, giving rise to short-term outcomes and long-term impacts. Actors are people who are observed individually or as collectives, such as teams or organizations. In a high-level analysis, the actors are governments, institutions of education and research, businesses, and others such as private nonprofit organizations. The activities in which the actors engage include research, invention, development, design and other engineering tasks, innovation, diffusion of technologies and practices, education and training, and capital investment. Examples of linkages are grants and contracts, collaboration, partnerships, codevelopment, copublication, and social networks.
Mapping the system, understanding it, and explaining it to policy makers—all themes that emerged in the workshop—require data linkage and microdata analysis. The result of addressing these themes would be new and better indicators on linkages in addition to existing indicators on activities such as R&D, trade in R&D services, and the production and mobility of highly qualified people. Workshop participants also stressed that a system exists in space and time, and looking in more detail at regions is important, as is providing policy-relevant indicators to policy makers in a more timely manner.
This section summarizes the priorities of two key groups of users of NCSES products: users of microdata and users of STI indicators.
____________________
6A list of policy issues and related questions appears in Appendix B and is referenced in Chapters 4-6.
7See Appendix D for the workshop agenda and the list of attendees. NCSES staff were represented at the workshop.
8The panel was unable to obtain a full list of users from NCSES. Identifying its full customer base is difficult for NCSES because the vast majority obtain information anonymously via the World Wide Web. Therefore, the panel derived information about key users from NCSES, panel members who are experienced data users, and some of the users who were interviewed for this study.
Users of Microdata
Although data development and access were not the focus of this study, it is important to mention here the primary request of a significant number of data users. Academic researchers, as well as data analysts at government agencies and private organizations, uniformly requested greater access to microdata (in this case, disaggregated data from NCSES surveys), not just aggregates or other statistics derived from those data. This type of user relies on NCSES for expertly curated datasets.9
Over the years, for example, NCSES has collected longitudinal data,10 administering follow-up surveys to students after graduation from college. These data are useful to researchers who, for instance, want to determine the propensity of STEM-educated students to persist in STEM occupations. Another example relates to data from the Business Research and Development and Innovation Survey (BRDIS). Since the BRDIS pilot was conducted in 2008, NCSES has published only one InfoBrief reporting statistics on innovation based on that survey. The 2009, 2010, and 2011 BRDIS data were collected. Users of NCSES’s datasets are eager to analyze the data on innovation from these surveys. However, only researchers with access to U.S. census data at census research data centers can work with BRDIS data. Upon request, NCSES makes statistics derived from these data available in tabular form.11 The tables include the incidence of innovation in the United States, measures of R&D expenditure, performance and employment domestically and worldwide, and measures of projected R&D costs and intellectual property (e.g., see Borousch, 2010, p. 5).12
NCSES has long had means through which data users can gain access to microdata, with some stipulations. From time to time, the agency has invited proposals from researchers for use of its datasets, and in 2012 it revived its grants program under the title “Research on the Science and Technology Enterprise: Statistics and Surveys.” This program increases data access for academic and other researchers, potentially yielding dividends in improved S&T indicators, as well as improved methodologies for analyzing and disseminating data and statistics.
Abstracts from the NCSES research awards are given in Appendix E. They show a wide array of topics, including the impact of tax incentives on increasing R&D, factors that affect time to degree for doctoral students, the impact of firms’ economic activities on economic outcomes, differences in employment rates for women and other groups underrepresented in STEM, differences in promotion and retention rates for women and minority professors, experimental methods for assessing ways of mitigating the survey nonresponse problem, and experimental methods for improving recall accuracy on questionnaires. Just this small group of grants shows that NCSES data can be used effectively by researchers to (1) examine the questions the panel heard were critically important to users of STI indicators, especially those that indicators cannot fully address and therefore require analytical research; and (2) inform data extraction and statistical practices that could enhance NCSES’s survey development, its data collection and analysis activities, and ultimately its productivity. Compared with the contract vehicle used by NCSES to produce some of its analytical products, the grants program allows for greater breadth of content through an investigator-initiated research agenda.
RECOMMENDATION 2-1: The National Center for Science and Engineering Statistics should continue its Grants and Fellowships Program for using its datasets, maintaining the high National Science Foundation standards for peer-reviewed award decisions.
One additional issue raised by data users was the need for more up-to-date taxonomies. For example, there is some discrepancy between the Science and Engineering Indicators 2008 figures and those calculated by staff at the National Institutes of Health (NIH) on the number of postdoctoral employees in the medical sector. Several factors could account for this discrepancy, including differences in the data taxonomies used at NCSES and NIH.
A previous National Research Council study (National Research Council, 2005) sponsored by the National Science Foundation (NSF) identified the need for collaborative efforts among federal agencies to review ways in which multiple classifications of science and engineering fields could be reconciled. The study recommended that a follow-on data taxonomy study be conducted to produce consistent definitions of fields and occupations across the sciences,
____________________
9Data curation is the active and ongoing management of data through their life cycle of interest and usefulness to scholarship, science, and education. Data curation enables data discovery and retrieval, maintains data quality, adds value, and provides for reuse over time through activities including authentication, archiving, management, preservation, and representation. (See http://www.lis.illinois.edu/academics/programs/specializations/data_curation [June 2013].)
10The Survey of Doctorate Recipients (SDR) has been conducted every 2 to 3 years since 1973. It follows a sample of doctorate recipients in science, engineering, and health fields throughout their careers up to age 75. See National Science Foundation (2012c) for more detail on this dataset.
11From the 2009 BRDIS Table Notes: “There are two types of tables in the table set. Most tables classify survey items by detailed industry, company size, or business code. Table 1 is a different kind of table. It contains aggregate totals for a variety of survey items that may not be tabulated at detailed levels. Since there is a large number of data items in BRDIS, tabulating all of them at a detailed level at this time is impractical and would unduly delay release of the statistics. Consequently, only selected items have been tabulated at the detailed industry, company size, or business code level. Most of the rest of the items are included in Table 1, but only at the aggregate (all industry) level. In the future, NSF intends to add more tables to cover some of the most requested data items that are not currently tabulated at the detailed level.”
12The panel was able to obtain data tables from NCSES. Chapter 3 and Appendix F of this report provide more detail on NCSES’s datasets and comparable data at other organizations worldwide.
including the health sciences, the social sciences, and engineering. Specifically:
The panel recommends that it is now time for the U.S. Office of Management and Budget to initiate a review of the Classification of Fields of Science and Engineering, last published as Directive 16 in 1978. The panel suggests that OMB appoint the Science Resources Statistics office of the NSF to serve as the lead agency for an effort that must be conducted on a government-wide basis, since the field classifications impinge on the programs of many government agencies. The fields of science should be revised after this review in a process that is mindful of the need to maintain continuity of key data series to the extent possible (Recommendation 6-1). (National Research Council, 2005, p. 127)
Such consistency is particularly important if NCSES data are to be linked with data from other statistical agencies, as is recommended later in this report.
A subsequent NSF-funded NRC study (National Research Council, 2010) included extensive analysis on the issue of data taxonomies for science and engineering statistics. That study found a need for harmonization of data taxonomies on R&D across federal agencies. Below are two relevant excerpts from the report on that study:
The importance of updating the taxonomy to better incorporate interdisciplinary research is widely recognized by policy makers, funding agencies, professional organizations, and across academia. The growing role of research involving more than one discipline is a serious challenge to any taxonomy of fields and therefore to gathering, analyzing, and using federal funds data based on a single-field taxonomy. (National Research Council, 2010, p. 22)
… No single taxonomy will satisfy all. However, for purposes of collecting data on research and development statistics in a consistent manner across federal government agencies, it is necessary to establish a common taxonomy that will be useful to the largest number of data providers and users. In the longer term, a provision can be made for tailoring structures that meet the specific needs of providers and users by flexibly categorizing administrative records. (National Research Council, 2010, p. 32)
The panel that produced the 2010 NRC report did not recommend, however, an immediate broad updating of the science and engineering taxonomy because of concerns about breaks in time series and the difficulties of the task. It limited its formal recommendation to a call for NCSES to “in the near term … make the changes necessary to improve the comparability of the federal funds taxonomy and the taxonomy for the academic research and development expenditures survey” (National Research Council, 2010, Recommendation 3-1, p. 44).
Recognizing the problems of developing classifications that can satisfy a variety of user needs and the need for historical continuity to the extent possible, this panel nonetheless concludes, consistent with the 2005 NRC report, that a broader effort to revise the existing classifications for science and engineering fields and occupations is long overdue. Changes in the U.S. economy led to a government- and continent-wide effort to develop what became the North American Industry Classification System in 1997, which is regularly updated every 5 years and has enabled federal statistics to take cognizance of the growth of the service sector and other changes in the economy. So, too, is it important to update the science and engineering taxonomy, given the evolution of new areas of science and the growth of interdisciplinary research. Indeed, NCSES has undertaken some work along these lines, which it is important to continue and to step up to the extent feasible. It is also important for these efforts to include development of a process for performing updates as needed.
RECOMMENDATION 2-2: The National Center for Science and Engineering Statistics should engage with other statistical agencies, including but not limited to the Bureau of Labor Statistics, the U.S. Census Bureau, the National Center for Education Statistics, and the National Institutes of Health, to develop a consistent taxonomy of science and engineering fields and occupations (including the health and social sciences). There should also be an established process for performing updates of this taxonomy as needed.
Users of STI Indicators
Issue-driven requests for analytical measures are legion, and NCSES does not have the capacity to develop indicators for all issues. As discussed in Chapter 1, moreover, indicators address but cannot fully answer most of the policy questions posed regarding the functioning of the STI system. Therefore, priorities need to be set regarding (1) which issues indicators can address, at least in part; (2) which users’ needs will be met; (3) where high-quality indicators will be obtained absent processing in house; and (4) where additional dollars will be spent and what will be produced less frequently or not at all should funds decrease. The remainder of this chapter focuses on the first two questions; the latter two relate to make-buy decisions for NCSES and strategic expenditures on activities within the agency, which the panel believes are for NSF staff to determine.
User-identified high-priority STI indicators are listed in Box 2-2. The list is broken down by the categories in Figure 2-1—STI activities, outputs and outcomes, and linkages; metrics related to actors and intermediate inputs in the system appear under activities and outcomes. Although the list is extensive, it represents only a subset of the measures users said they wanted to have, either specifically from NCSES or in general. The panel used its collective expertise to determine which indicators from that total set should be
deemed priorities for NCSES, focusing in particular on the utility of indicators in the policy context. The panel also considered other factors that could be used to prioritize STI indicators produced by NCSES, including ease of acquisition, cost, flexibility, and periodicity (see Figure 1-1 in Chapter 1). These factors often were difficult for the panel to ascertain. For example, the cost of producing any given indicator depends on the type of data (survey, unstructured, administrative) required, the need to link to other datasets that NCSES might have to acquire, the possibility that NCSES would have to invest in new skill sets in house to use new data acquisition and manipulation techniques, and so on. Therefore, the panel focused primarily on high-utility indicators; suggestions are offered later in the report on how to acquire new types of data and the skill sets needed to work with those data.
This report reflects the systems framework of STI activities shown earlier in Figure 2-1. However, the lines between activities and outcomes (inputs and outputs) are imprecise, and attempts to draw them are imperfect. Therefore, linkages between various elements of the system are highlighted throughout the report to help the reader appreciate why a suite of indicators is important for a fuller understanding of drivers, trends, advances, and vulnerabilities in the global STI system.
International Comparability
Because one of the primary goals of this study was to determine how to improve the comparability of STI indicators in the United States and abroad, the panel discussed priorities for indicators with internationally known experts in the field during its two workshops. Several recurring themes emerged from these discussions.
First, mapping and understanding the innovation system (or system of systems) is important. However, priorities for indicator development are driven by policy makers’ queries.
Second, understanding and producing indicators on the commercialization of publicly funded knowledge is a priority. Linkage indicators need to show the flow of knowledge from public institutions to businesses and from businesses to the market, leading to social and economic impacts. This flow of knowledge includes highly qualified people as well as licenses for intellectual property and R&D services. Thus, it is important to have good measures of the STEM workforce and other talent employed in S&T sectors. In addition, measures of knowledge assets (including those considered intangible) and innovation are a high priority for improved measurement.
Third, the development of STI indicators at different geographic scales and for a variety of sectors is a priority. Other distributional elements of the STI system also are important, including characteristics of people—their gender, age, level of education and experience, and willingness to take risks and be entrepreneurial, as well as their employment and mobility. Measures of social capital that affect the development and diffusion of knowledge capital are important indicators of STEM talent. The characteristics of firms matter, too—their location, size, rate of employment and revenue growth, entrepreneurial characteristics, and complexity (multinational corporations are different from small and medium-sized firms).
Fourth, outcome measures are necessary but not well developed. It is important to have internationally comparable measures of innovation and of its social and economic impacts.
Finally, there is a need to measure innovation that is not the direct result of R&D expenditures. This class of indicators could begin to answer questions about what governments obtain in return for their funding and how their expenditures affect productivity, economic growth, and job creation.
Dahlman (2012) discusses the “changing geography of innovation,” with a focus on the engineered emergence of technological capabilities in Brazil, China, and India. In addition to measures of innovation activities that are used in the developed-country context, Dahlman presents several indicators that are particularly useful early warning signals of the potential for ascendency of a developing country in the international innovation system. These indicators include (1) human capital (enrollments in higher education outside the home country, number of back-expatriated citizens, number of top foreign scientists recruited by local universities and industry); (2) R&D expenditure (information-enabled service industries and knowledge services); (3) learning (investments from transnational corporations, including locations of research, development, and engineering functions; exports and imports with the rest of the world; technology licensing and S&T cooperative agreements at home and abroad); (4) institutions (regulations, including protection of property rights, trade restrictions at home and abroad); (5) intermediate and final outputs (share of total world R&D);13 (6) domestic demand for high-technology products (including alternative energy technologies);14 and (7) social outcomes (income inequality; measures of children’s access to education, health care, and food; programs that support product, process, and service innovations that address the needs of low-income populations).
NCSES publishes many STI indicators that are comparable to those available in OECD’s 2011 Science, Technology, and Industry Scoreboard; the Cornell-INSEAD-World Intellectual Property Organization (WIPO) Global Innovation Index 2013; and the European Union’s Innovation Union Scoreboard 2013. NCSES is most prolific in international
____________________
13Dahlman (2012, p. 6) states that “….there has been concern about significant fraud and cheating in research and scientific publications and that many patents are of little value. The argument is that this activity has proliferated because promotions and salary increases in universities and research labs have been reoriented to be based on publications and patenting.”
14“Domestic demand conditions” is one of Porter’s (1990) four determinants of national competitive advantage.
BOX 2-2
Key Indicators Suggested by Major Users of STI Indicators
Activities
Research and Development (R&D)
- National R&D expenditures
- Federal and state funds for basic research
- Public-sector R&D (focus on advanced manufacturing, green technologies, energy-related R&D, nanotechnology, agriculture, weapons)
- Public R&D spending as a share of gross domestic product (GDP)
- Business R&D spending
- Business R&D as a share of GDP
- Industry support for R&D in universities
- Social science R&D
- National R&D performance (by type of industry and source of funds)
- Trends in grant size to universities
- Number of R&D centers in the United States and other countries
Innovation
- Direct measures of innovation (data similar to those from the Community Innovation Survey)
- Ratings for propensity to innovate
- Subject matter experts (SMEs) innovating in house as a share of SMEs
- Firms (<5, 5+, 10+, 20+ employees) introducing new or significantly improved products or processes as a share of all firms
- Firms (<5, 5+, 10+, 20+ employees) introducing new or significantly improved goods or services as a share of all firms
- Firms (<5, 5+, 10+, 20+ employees) introducing marketing or organizational innovations as a share of all firms
- Numbers and types of new products per year, by region (Thomasnet.com)
- Drug and other approvals per year, by region
- Sale of new-to-market and new-to-firm innovations as a share of turnover
- Non-R&D expenditures on innovation activities and non-R&D innovation spending as a share of turnover
- Inclusive innovation for development (case studies)
- Capital expenditures related to the introduction of new processes
- Marketing expenditures related to new products
- Expenditures on design and technical specifications
- Expenditures on service-sector innovation
- Investment in new information and communication technology (ICT) hardware and software
- Innovation inhibitors (case studies)
Market Capital Investments
- Venture capital investments in science and technology (S&T) (early-stage, expansion, and replacement) and venture capital investments in S&T as a share of GDP
- Number of initial public offerings (IPOs) in S&T
- Number of S&T spinoffs
- Expenditures in later phases of development/testing that are not included in R&D
Outputs and Outcomes
Commercial Outputs and Outcomes
- Performance of high-growth small and large firms
- High-growth enterprises as a share of all enterprises
- Medium- and high-tech manufacturing exports as a share of total product exports
- Knowledge-intensive service exports as a share of total service exports
- Value added in manufacturing
- Value added in technical services
- Trade flows of S&T products and services
- ICT outputs and sales (intermediate and final)
- Other intermediate inputs
- Technology balance of trade (especially intellectual property)
- Contracts to S&T firms
- Advanced manufacturing outputs (information technology-based processes)
- Market diffusion activities
- Emerging industries (based on universities, government laboratories, firms, value chains, key occupations, and individuals)
- Help-wanted ads, “how to” books, and other derivative STI activities
- Use and planned use of general-purpose technologies
Knowledge Outputs
- U.S. receipts and royalty payments from foreign affiliates
- U.S. patent applications and grants by country, technology
- U.S. trademark applications and grants by country, technology
- Patent citations
- License and patent revenues from abroad as a share of GDP
- Triadic patent families by country
- Percentage of patent applications per billion GDP
- Percentage of patent applications related to societal challenges per billion GDP (e.g., climate change mitigation, health)
- Intangible assets
- Average length of a firm’s product life cycle or how often the firm usually introduces innovations
- Births and deaths of businesses linked to innovation outputs; firm dynamics by geography, industry, business size, and business age
- Knowledge depreciation
- Knowledge stocks and flows in specific sectors, including nanotechnology; information technology; biotechnology and agriculture research (local foods, organic foods, biofuels, environment, nutrition, health); oil and gas production; clean/green energy; space applications; weapons; health care technologies; educational technologies (massive open online courses [MOOCs]); and mining
Science, Technology, Engineering, and Mathematics (STEM) Education
- Expenditures, direct and indirect costs, investments, revenues, and financing for STEM education
- Percentage of faculty in nonteaching and nonresearch roles at universities
- Enrollment data by STEM field at various levels (e.g., associate’s, bachelor’s, master’s, doctorate) and for various types of institutions
- New degrees (e.g., associate’s, bachelor’s, master’s, doctorate); new doctoral graduates per 1,000 population aged 25-34
- Stock of degrees (e.g., associate’s, bachelor’s, master’s, doctorate)
- Share of population aged 30-34 having completed tertiary education
- Share of youth aged 20-24 having attained at least upper-secondary-level education
- Persistence and dropout rates in education, by geographic and demographic distinctions
- Number of high school students pursuing associate’s degrees and implications for the workforce and the cost of higher education
- Disciplines in which community colleges have a relative advantage
- Foreign-born STEM-educated individuals—country of birth, immigration visas, etc.
- Stay rates of foreign students
- Trends in online learning and MOOCs
STEM Workforce/Talent
- Postdoctoral levels and trends in various STEM fields, by country of birth and country of highest degree
- Number of postdoctorates in health, but specific fields
- STEM employment
- Labor mobility and workforce migration
- Demographic composition of people who would enter specific occupations (e.g., clean energy, ICT, biotechnology, health services)
- Fraction of STEM degree holders that hold STEM jobs
- Earnings by degree type and occupation
- Feeder fields in agricultural science
- On-the-job training activities in S&T, manufacturing, and services
- STEM demand
- Employment in knowledge-intensive activities (manufacturing and services) as a share of total employment
Socioeconomic Impacts/Well-Being
- Economic growth
- Productivity
- Other measures of impact on GDP and jobs
- Agricultural preparedness
- Energy preparedness
- Return on investment (ROI) on grants to universities, by type of S&T
- National security/defense
- Environment
- Energy use
- Geographic hot spots
Linkages
Organizations/Institutions/Infrastructure
- Public-private copublications per million population
- University-industry research collaborations
- Number and value of international collaborations
- Business structure dynamics
- Technology transfer between academic institutions and businesses, including mechanisms
indicators of human capital stocks and flows,15 and it has many essential indicators of firm activities in R&D, innovation, and knowledge-intensive services; financial expenditures; patent grants; and international trade in high-technology products. As discussed in Chapters 4 through 6 of this report, however, there are elements of innovation, knowledge generation, knowledge networks and flows, and even human capital for which NCSES should consider expanding its portfolio of indicators. Doing so would improve the comparability of STI indicators internationally, thereby improving the utility of these measures for a variety of users.
Subnational Statistics16
Users want more disaggregated STI information on multiple levels. They want STI comparisons across U.S. regions and between U.S. and foreign regions. Cooke and
____________________
15For example, NCSES’s InfoBriefs and the National Science Board’s Science and Engineering Indicators volume (for which NCSES provides statistical indicators) include the following statistics: enrollments in master’s and Ph.D. science and engineering programs in the United States by countries or economic regions of origin; baccalaureate origins of U.S.trained science and engineering doctorate recipients; number of science and engineering degrees earned in foreign countries; international mobility and employment characteristics of recent U.S. doctorates, including stay rates; employment in R&D activities worldwide, with specifics on R&D workers in multinational corporations; and international collaborations of scientists and engineers in the United States.
16This report uses the term “subnational” instead of “regional” to denote geographic areas that are defined within a nation’s boundaries. While the term “regional” is used extensively in the literature to denote states or provinces, standard metropolitan statistical areas (SMSAs), or even well-defined industry clusters, the term is also used in reference to clusters of countries (e.g., the North American region or the Pacific Rim). Cooke and Memedovic (2003, p. 5) give useful criteria for defining a region or subnational area: “(1) a region must not have a determinate size, (2) it is homogeneous in terms of specific criteria, (3) it can be distinguished from bordering areas by a particular kind of association of related features, and (4) it possesses some kind of internal cohesion. It is also important to mention that the boundaries of regions are not fixed once for all; regions can change, new regions can emerge and old ones can perish.”
- Technology transfer (Manufacturing Extension Partnership [MEP])
- Technology transfer from national laboratories
- Bilateral S&T agreements (including international)
- Collaboratories
- Industry clusters
- Incubators
- Consortia (Defense Advanced Research Projects Agency [DARPA], Advanced Research Projects Agency-Energy [ARPA-E], Technology Innovation Program [TIP])
- Intellectual property rights and policies
- Standards
- Market planning assistance (Department of Commerce [DoC], Bureau of Labor Statistics [BLS], Small Business Administration [SBA])
- Research and experimentation (R&E) tax credits (federal and state)
- Innovative SMEs collaborating with others as a share of SMEs
- Alumni contributions to R&D
- Communications linkages (including broadband)
Culture
- Public value of S&T
- Business climate
- Entrepreneurial activities
- Mappings of entrepreneurial density
- All establishments and firms with at least one employee, including start-ups, 1976 to the present
- All nonemployer firms and integrated-with-employer firms, 1994 to the present
- All employer-employee matches and transitions (hires, separations, job creation, and job destruction) 1990 to the present
- Information on innovation policy and its outcomes (contexts; national, regional, sectoral levels)
- Data on the existence of dealmakers and entrepreneurs and their connections in a given market
- Risk tolerance
- Social networks
- Social capital
Memedovic (2003, p. 31) surmise that “global economic forces have raised the profile of regions and regional governance not least because of the rise to prominence of regional and local business clusters as vehicles for global and national economic competitiveness.” Hollanders (2013, p. 79) states that “regions are increasingly becoming important engines of economic development.” Drawing on comparisons at the subnational level, Hollanders finds that understanding various components of the innovation system at this level yields useful insights into performance outcomes at the country level. A key caveat, however, is that subnational STI statistics are scarce relative to comparable national statistics. Furthermore, Hollanders asserts that comparing small countries (such as Bahrain and Cyprus) to large countries such as (China and India) clouds the ability to determine what he terms “best practices.” Hollanders (2013, p. 84) states:
Applying best practices from these large countries to smaller ones will be difficult because of the differences in scale. We need to be able to compare smaller countries with regions of larger countries that are similar to the smaller countries in size or in industrial structure. Such a comparison requires a breakdown of country-level statistics into regional statistics, where regions should not be defined as static administrative regions, … but rather as economic regions that can be distinguished from bordering regions and that should have a certain degree of internal cohesion. There are no guidelines for determining the “ideal” region, but large metropolitan areas seem to emerge as a natural category.
Research shows that innovation depends on many factors that together contribute to the success or failure of a given idea and therefore is highly local. The particular arrangement of R&D facilities, industry concentration, labor force skills, and labor mobility makes the local setting productive (see, e.g., Belleflamme et al., 2000; Braunerhjelm and Henrekson, 2013; Clark et al., 2003). A substantial body of evidence shows that these local settings have been highly influential in creating concentrations of innovation over the past century (see, e.g., Audretsch et al., 2005). For example, Route 128 around Boston saw the emergence of new industries and
relationships in the 1950s and 1960s characterized by a complex interaction among venture capital, real estate promoters, and major research universities; Silicon Valley subsequently emerged as the focal point for a range of new products and services (these two cases are considered in great detail by Saxenian [1996]; see also Gertler et al., 1995; Link and Scott, 2003). Some of the most successful clusters of innovation have far exceeded any original plans, arising from particular combinations that others have tried to replicate with varying degrees of success. State laws vary on postemployment covenants (also known as noncompete agreements), which can have differential effects on entrepreneurial outcomes (Marx and Fleming, 2012). Many cities have explicit policies for incubators, including some that have produced tangible results for the region and the economy as a whole (see, e.g., Tödtling and Trippl, 2005). Yet such policies are not panaceas and at times produce measured successes or failed outcomes. Therefore, it is critically important to have a variety of information, including subnational STI indicators that can inform judgment on whether such expenditures should continue and whether the portfolio of programs is optimal.
Countries other than the United States have more explicit regional strategies for fostering innovation, established over longer time frames (Cooke and Memedovic, 2003; Falck and Heblich, 2008). In recent years, for example, much of the funding for innovation in the European Union has been channeled through regional initiatives. The federal structure of the United States obscures some of the explicit regional strategies across states and in a complex collection of regional bodies, some spanning multiple states. Yet many U.S. policies that support innovation are at the local level, where industries are created and incubated.
Thus, local decision makers need indicators for their specific region in comparison with others; no single geographic subdivision scheme will serve all needs. Demographic statistics often are tabulated by legislated entities (e.g., states, counties, cities) because of the constitutional relationship to representation. These entities, though easily recognizable, may not well represent the economic realities of market areas and regional variation. Consider the vast commercial and demographic variability within some states, such as California, compared with the relative homogeneity of a state like Delaware. These two states are not at the same scale analytically, yet each needs indicators to manage its investments. A confounding factor is that economic information has another hierarchy—from the industry to firm to plant or establishment level. Only the finest level has a spatial expression, and therefore raises questions of subnational policy relevance. Some states, particularly those dependent on sales tax revenues and other highly cyclical sources, expend great effort in operating their own economic models at subnational scales. The decentralized way in which these local needs are being met makes it difficult to develop a national scheme for integrated information management.
During the panel’s July 2011 workshop, Robert Atkinson of the Information Technology and Innovation Foundation said subnational information would be particularly helpful for technology and innovation policy. Other workshop participants described subnational decompositions in several countries. Based on her extensive research on STI hot spots, Maryann Feldman of the University of North Carolina emphasized that economic growth does occur within these finer geographic units. She went on to stress that decision makers in the states and metropolitan areas need data on innovation activities at the subnational level. She suggested NCSES work with users to determine what statistics would be useful at this level and what some users have already created that could serve as useful inputs for NCSES’s subnational indicators.
At the workshop, representatives of the Association of Public and Land-grant Universities (APLU) David Winwood and Robert Samors presented an overview of the Commission on Innovation, Competitiveness, and Economic Prosperity (CICEP) project. They noted that APLU would like universities and other organizations to collect dozens of measures on a wide range of topics, especially numbers, types, and dollar amounts for research activities funded by private-sector entities (e.g., consortia, trade associations, companies); similar information for federal, state, or foundation sources of funding; numbers of students participating in work-related activities, regardless of whether they earn academic credit for those activities; numbers of full-time equivalent employees engaged in sponsored research-related activities; and equity investments in university technology development activities by graduates of the institutions, as well as other types of investors.17
In summary, comparing the almost two dozen subnational measures requested by users at the panel’s workshop with the information from APLU’s questionnaire exercise and with findings in the literature on regional innovation systems (e.g., Cooke and Memedovic, 2003, p. 17; Hollanders, 2013, p. 80) reveals the following to be high-priority subnational STI indicators: (1) academic R&D expenditures; (2) federal R&D expenditures (some of which are directed to academic institutions and private firms); (3) industry expenditures on R&D, including support for academic research; (4) non-R&D innovation expenditures; (5) STI equity investments (from various sources, including venture capital); (6) sales of products new to the firm (noting distortions introduced by multiplant, multisector firms); (7) share of the population aged 26-64 with tertiary degrees or engaged in certificate training programs; (8) employment in knowledge-intensive manufacturing and services; (9) knowledge transfer and other linkages between academic institutions and industry (e.g., public-private scientific copublications per million
____________________
17This information was circulated to participants at an APLU workshop in October 2012. APLU staff developed a list of 11 first-tier and 23 second-tier priority metrics from a pilot test of a questionnaire administered to its membership universities.
population); and (10) infrastructure investments (e.g., broadband access). These and many other indicators were requested at both the national and subnational levels and are included in Box 2-2 presented earlier. NCSES produces indicators in many of these categories at the state level.18 However, users are interested in an expanded set of subnational indicators at finer geospatial scales. Although expenditures on STI activities are at times determined by state legislators, venture capital investments and some economic outcomes are better observed in metropolitan areas or in smaller economic clusters.
One should not presume, however, that arriving at national aggregates based on subnational data is at all straightforward. The panel was advised during the workshop that the pursuit of more subnational STI indicators at the state and even local levels is fraught with problems of distribution and aggregation.
CAUTIONS, POSSIBILITIES, AND LIMITATIONS
Although the production of indicators across many fields has an established history, at least three major cautions regarding their use are important to note.
First, indicators can send mixed signals that require expert judgment for interpretation. For example, it is commonly held that increased innovation—which is key to advancing living standards—enhances job creation, and policy makers discuss spurring innovation as a job creation tactic. However, innovation can lead to fewer jobs if the process or managerial expertise increases efficiency. On the other hand, short-term displacement of workers in one industry or sector can be counterbalanced in the longer term by the development of new products, services, and even sectors and by increased market demand if process efficiencies drive down prices (see Pianta, 2005; Van Reenen, 1997). One way to be cautious about mixed signals is to develop STI indicators that support analysis of time scales, sectors, and geographic locations.
Second, once a given metric becomes widely used, it may change the behavior of the people and practices it attempts to measure. The worst thing a metric can do is not only deliver a bad (i.e., misleading) answer but also incentivize bad practice—that is, decisions or policies that are counterproductive (see, e.g., West and Bergstrom, 2010). It is important that indicators not send distorted signals to users.
Third, not everything that counts can be counted, and not everything that can be counted counts. Some outcome measures that reflect the importance of R&D and innovation to society are elusive. For example, social well-being is difficult to measure, yet one of the key interests of policy makers is the return on investment of public funding for S&T for the good of society.
For this study, Bronwyn Hall and Adam Jaffe prepared a commissioned paper that in part takes up the notion of a policy-driven framework for STI indicators. As mentioned in Chapter 1, Hall and Jaffe (2012, p. 39) give a balanced view of the extent to which users can rely on indicators to address key issues, making a strong case for the need for improved metrics that can be used for analytical purposes. Their observations are worth quoting at length here:
Overall level of public investment in R&D. Implicitly, the Congress and the President are continuously deciding what overall level of resources to invest in new knowledge creation through the R&D process. Ideally, this would be informed by data showing the marginal rate of return on these investments. But marginal rates of return are very difficult to measure. Economists and others have made estimates of the average rate of return to R&D investments (Hall et al., 2010). Within the model, the marginal rate of return declines with the intensity of R&D investment (R&D/GDP) other things equal, so a high average rate of return is a necessary but not sufficient condition to justify increased investment.
In the absence of explicit information, R&D intensity measures do provide some implicit evidence on the rate of return. Economic models typically presume that there are diminishing returns to increased R&D expenditure, so that the rate of return to R&D will fall as R&D/GDP rises. This means that if today’s U.S. R&D/GDP ratio is lower than at another point in time, we may be able to infer that the rate of return in the U.S. today is higher than it was at that point of time, assuming that nothing else has changed. The same argument applies when comparing R&D intensities across countries, although it is even more difficult to assume that other things are equal in that case. Thus if we have some reason to believe that the investment level was right at some point in time, then we might be able to infer that the implied high rate of return in the United States today justifies a higher level of investment (and vice versa if today’s U.S. R&D intensity is higher than at some other time or place). However, given all the uncertainties, it would probably be better to attempt to measure the return to R&D spending in this case.
Overall level of public investment in education and training. The issues with respect to the optimal level of investment in education and training are analogous to those related to R&D. We would, ideally, like to have measures of the rate of return; measures of the current ratio of investment to GDP may provide indirect evidence on the rate of return, at least relative to other times or places. In addition, public policy may view having an educated public as a desirable end in itself, over and above any return it may provide in terms of innovation and technology. If so, then data on years of schooling and degrees awarded are useful policy indicators independent of their indirect implications for the economic rate of return.
Education and training also take many forms and occur in
____________________
18NCSES’s state-level indicators are available in the following areas: elementary, secondary, and tertiary education; workforce; financial R&D inputs; R&D outputs; and S&T in the state economy (including venture capital activity, Small Business Innovation Research awards, and high-technology business activity).
many different contexts. We have better data on what occurs in formal educational institutions than we have on training that occurs on the job, or is otherwise provided by firms without recourse to formal educational institutions.
Allocation of both of above by scientific/technical area or area of ultimate application. Even more than the overall determination of public investment, the government must continuously decide the allocation of public resources for R&D and education/training across scientific and technical fields, and across areas of application. Again, within the model the most relevant information for these decisions would be the marginal rates of return. And again, these are hard to measure, and measurements of average rates of return are incomplete as indicators of marginal rates. In addition, there are substantial spillovers across scientific fields (e.g., the importance of computer science for DNA analysis) so that localized rates of return may not capture the true importance of some fields.
The relevance of investment intensity measures as indirect indications of marginal rates of return is more complex in the context of allocation across fields or sectors. If the inherent technological opportunity is greater in a given sector, then its marginal returns are higher at any given level of investment. Thus it is possible, for example, that our much higher level of public investment in research in health sciences than in other fields represents an implicit belief that technological opportunity, and hence marginal returns, are higher in that area than in others. On the other hand, no other country in the world devotes such a large share of its public research investment to health sciences. Unless the variation of technological opportunity across fields is different in different countries, comparative benchmarking on sectoral allocations may provide indirect evidence on rates of return. As noted above, however, this is a particularly problematic sector due to the difficulty of measuring output properly and the fact that health improvements are not completely captured by national income accounts.
Allocation of federal R&D and training resources by types of institutions (e.g., intramural versus extramural or universities versus firms). Allocation of public resources across different kinds of institutions raises the same issue of relative rates of return as allocation across sectors. In addition, different kinds of institutions play different roles in the STI system. Hence, indicators reflecting intermediate outputs of the research process, and flows of knowledge within the system, might be informative about imbalances within the system. It would also be useful to construct and publicize more detailed statistics on the demand for S&T skills in certain areas, including starting salaries, in a timely manner.
Science and technology policy choices other than spending. Many government policy choices explicitly or implicitly affect the STI system, including R&D subsidies (and other tax policies), intellectual property rules, and mechanisms for the transmittal of funds (e.g., basic research grants, contract research, prizes, etc.). It is not clear that indicators, as we normally think of them, shed light on the relative efficacy of different policy choices of this kind. But the data collected as the basis for indicators can also be used by social scientists to study the relative effectiveness of different mechanisms. In fact, these data are essential for this purpose.
Immigration policy (as applied to scientific/technical workers). Indicators related to the number and fields of scientific and technical workers, combined with the level of investment in research, may be useful for informing the nature and extent of visa programs to allow more technically trained immigrants to work in the United States.
Indicators for use by university administrators or firm managers. Firm managers and university administrators face many of the same choices as governments: how much to spend and what to spend it on. Many of them rely to some extent on benchmarking, that is, observing the spending patterns of their immediate competitors. Therefore, the same kinds of data as described above can be useful, preferably broken down by sector and by geography.
This chapter has presented a long list of indicators that users want to have, mainly to address key STI policy issues. Users requested many more indicators, but these did not rise to the level of importance of those listed in this chapter. This chapter also has offered two recommendations, focused on (1) continuation of NCSES’s Grants and Fellowships Program and (2) collaboration between NCSES and other statistical agencies to develop a consistent taxonomy of science and engineering fields and occupations.
With the focus on NCSES’s decision-making challenges in the future, the panel took on the task of prioritizing the measures NCSES should produce in the near term and identifying the processes it should develop to satisfy users’ future demands. The results of this effort are presented in Chapters 3 and 8, where the panel respectively identifies key policy-relevant STI indicators and strategic organizational principles for continuously developing those indicators as technology, economic, and policy environments change globally.


