
The National Science Foundation’s National Center for Science and Engineering Statistics (NCSES) is one of 13 major statistical agencies1 in the federal government, about half of which collect relevant information on science, technology, and innovation (STI) activities in the United States and abroad.2 The America Creating Opportunities to Meaningfully Promote Excellence in Technology, Education, and Science (America COMPETES) Reauthorization Act of 2010 expanded and codified NCSES’s role as a U.S. federal statistical agency (see Box 1-1).3 Aspects of the agency’s mandate most relevant to this study include collecting, acquiring, analyzing, reporting, and disseminating data on (1) research and development (R&D) trends; (2) the evolution of the science and engineering workforce in the United States and abroad; (3) U.S. competitiveness in science, technology, and R&D; and (4) the condition and progress of U.S. science, technology, engineering, and mathematics (STEM) education.4 NCSES is also explicitly charged with supporting research on the data it collects and its methodologies for data collection, analysis, and dissemination.
NCSES’s day-to-day activities serve two main functions: data curation and the provision of statistics, including indicators that distill underlying data into metrics that track inputs, processes, outputs, and outcomes of interest to policy analysts and others. Clients worldwide look to NCSES for basic measurements of STI activities, as well as aggregations, blended statistics, or indices designed to inform specific issues. NCSES’s clientele is diverse. Some use a wide range of its data on a variety of STI actors and activities, while others require more processed, analytically salient statistics derived from those data. Users of NCSES data and statistics include staff of other statistical agencies in the United States and abroad; local, state, federal, and international policy makers and government administrators; academic researchers and administrators; and, to a much lesser extent, managers of businesses, consultants, and nonprofit organizations.5 As it works to meet these commitments, NCSES also is focused on deepening its core competencies in anticipation of future demands. As it further develops its indicators program, the agency must in particular consider the synergies between its R&D and human resources statistics programs.
The purpose of this report is to make recommendations for what STI indicators NCSES should produce in the near term and over time, and what process changes or innovations are needed to help the agency produce high-utility indicators in a timelier fashion.
____________________
1The Office of Management and Budget-chaired Interagency Council on Statistical Policy has 14 members, 13 of which are recognized as major statistical agencies. See the full listing of Principal Statistical Agencies in Federal Statistics (2007).
2Agencies collecting such information include six statistical agencies—the Bureau of Economic Analysis, Bureau of Labor Statistics, Census Bureau, Economic Research Service (U.S. Department of Agriculture), National Center for Education Statistics, and NCSES—and also the National Institute of Standards and Technology (U.S. Department of Commerce).
3The act also gave the agency its new name; it was previously called the Science Resources Statistics Division.
4In this report, STEM occupations include engineers, mathematical and computer scientists, life scientists, physical scientists, social scientists, technicians, programmers, and science and engineering managers, but not health care practitioners and technicians. This is the definition of STEM occupations used by NCSES (see Regets, 2010).
5“… NCSES has responsibility for statistics about the science and engineering enterprise. NCSES designs, supports, and directs a coordinated collection of periodic national surveys and performs a variety of other data collections and research, providing policymakers, researchers, and other decision makers with high quality data and analysis on R&D, innovation, the education of scientists and engineers, and the S&E workforce. The work of NCSES involves survey development, methodological and quality improvement efforts, data collection, analysis, information compilation, dissemination, web access, and customer service to meet the statistical and analytical needs of a diverse user community. It also prepares two congressionally mandated biennial reports—Science and Engineering Indicators (SEI) and Women, Minorities, and Persons with Disabilities in Science and Engineering. The data collected by NCSES also serve as important tools for researchers in SBE’s Science of Science and Innovation Policy (SciSIP) Program” (National Science Foundation, 2012a).
BOX 1-1
Role of the National Center for Science and Engineering Statistics Under the America COMPETES Reauthorization Act
SEC. 505. NATIONAL CENTER FOR SCIENCE AND ENGINEERING STATISTICS.
(a) Establishment—There is established within the Foundation a National Center for Science and Engineering Statistics that shall serve as a central Federal clearinghouse for the collection, interpretation, analysis, and dissemination of objective data on science, engineering, technology, and research and development.
(b) Duties—In carrying out subsection (a) of this section, the Director, acting through the Center shall—
(1) collect, acquire, analyze, report, and disseminate statistical data related to the science and engineering enterprise in the United States and other nations that is relevant and useful to practitioners, researchers, policymakers, and the public, including statistical data on—
(A) research and development trends;
(B) the science and engineering workforce;
(C) United States competitiveness in science, engineering, technology, and research and development; and
D) the condition and progress of United States STEM education;
(2) support research using the data it collects, and on methodologies in areas related to the work of the Center; and
(3) support the education and training of researchers in the use of large-scale, nationally representative datasets.
(c) Statistical Reports—The Director or the National Science Board, acting through the Center, shall issue regular, and as necessary, special statistical reports on topics related to the national and international science and engineering enterprise such as the biennial report required by section 4(j)(1) of the National Science Foundation Act of 1950 (42 U.S.C. 1863(j)(1)) on indicators of the state of science and engineering in the United States.
In carrying out the mandate outlined above, NCSES confronts three key challenges: (1) the increasing complexity of STI activities, including the rapid technological changes that continue to reshape product markets and demand for human resources; (2) the globalization of technology and economic activities; and (3) the budget constraints under which NCSES (along with most other federal agencies) must operate.
Rapid technological change is a healthy feature of modern economies, and indeed decades of economic research have confirmed that it is the dominant driver of growth in gross domestic product (GDP) over the long run for developed countries such as the United States (Barro and Sala-I-Martin, 1997; Romer, 1990; Solow, 1956, 1957). At the same time, the pace of change today in areas such as information and communication technologies, medical sciences, materials science and engineering, and the organization of educational institutions present fundamental problems for government statistical agencies charged with measuring innovation activities. Although certain inputs into the innovation process can be counted using traditional methods,6 continued rapid change makes it difficult to capture well the nature of innovation outcomes, as well as many specific characteristics of the nation’s innovation ecosystem (or ecosystems, because innovation in particular industries often tends to cluster in certain geographic regions). Particularly challenging as well is to use traditional methods to develop metrics that link changes in inputs to changes in outputs and societal impacts, all as institutions are evolving driven in part by the same underlying forces. Yet these are the types of questions that users are looking to answer with NCSES’s STI indicators.
At the same time, NCSES must deal with an STI system that is globalizing at breathtaking speed. Virtually all companies with major domestic R&D spending also have growing R&D operations in foreign countries, especially emerging economies such as Brazil, China, and India or oil-rich countries such as the United Arab Emirates (see, e.g., MADAR Research and Development [2006] and the chapter on “The Strategic Vision for 2030” in The Abu Dhabi Economic Vision 2030 [The Government of Abu Dhabi, 2008]). The same is increasingly true for major domestic research universities, which are reaching out to create research centers around the world.7 Research projects increasingly are the result of cross-border collaboration, accomplished either in person or by electronic connection. In addition, the delivery of education and training in science and engineering fields increasingly is distributed geographically via electronic media—as illustrated by the emergence of massive open online courses (MOOCs)—supplementing or substituting for traditional, local, bricks-and-mortar classroom facilities.
The recent economic crisis, coupled with the high cost of innovating at the technological frontier, has led to the growing adoption of “open” innovation strategies based on enhanced collaboration, sharing, and acquisition of knowledge from external sources (Chesbrough et al., 2008). The emergence of global networks of innovation, as well as global markets for knowledge as contract R&D and the buying and selling of intellectual property become more prevalent, has further fueled globalization.
The combination of rapid technological change and globalization of the innovation ecosystem is placing increased stress on traditional STI indicators, such as expenditures
____________________
6For example, R&D expenditures, patents, and broad measures of human capital (such as undergraduate and graduate degrees awarded in science and technology, as well as on-the-job training).
7Stanford, for example, has opened a new research center at Peking University; see http://news.stanford.edu/news/2011/march/scpku-chinapeking-033111.html [January 2014]. For a broad overview of the globalization of universities, see Wildavsky (2010).
on research and development without linking expenditures to innovative outputs. Continued use of the traditional STI measures will give an incomplete and possibly misleading indication of how well or poorly the U.S. economy and other economies are doing in generating the improvements in products, services, and processes that lead to improved living standards. This stress is exacerbated by the budget constraints faced by federal agencies in fiscal year (FY) 2013 and beyond. The challenges posed by NCSES’s broadening of responsibilities and constrained budget resources were reflected in the FY 2013 budget request to Congress for the agency (National Science Foundation, 2012a, p. SBE-3):
For FY 2013, NCSES will accelerate efforts to rely more heavily on data from the National Survey of College Graduates, built from the American Community Survey, which will reduce overall survey costs while still continuing to meet the needs of policy makers, researchers, and the general public for data on the overall science and engineering workforce. NCSES will develop plans for a project to utilize federal agency administrative records to measure research and development activity and to explore new methods to enhance data collection, analysis and data sharing capabilities better to serve all its customers interested in the science and engineering enterprise.
Adding to the challenges outlined above are rapid changes in the ways statistical information is obtained, data are generated, and statistics are estimated. In his July 2012 presentation to the Senate Subcommittee on Federal Financial Management, Government Information, Federal Services, and International Security,8 Robert Groves identified these challenges and suggested solutions that the U.S. Census Bureau and other U.S. statistical agencies should consider: (1) engage university researchers and technology firms in the development of more efficient processes for data extraction and manipulation; (2) use new data sources (including “organic data” and data from quick-response surveys and administrative records) to complement traditional survey-based data; and (3) link or bridge datasets across federal agencies to produce a richer set of timely, high-quality statistics at reduced cost. These solutions may apply to NCSES as it confronts the challenges it faces today.
NCSES has a global reputation for excellence in collecting and reporting STI-related information. Essential indicators are available in the National Science Board’s biennial volume Science and Engineering Indicators, in InfoBriefs on a wide variety of topics, in statistics published in the Scientists and Engineers Statistical Data System and National Patterns of R&D Resources, Business R&D and Innovation: 2008-2010 (NSF 13-332), and in statistics available on WebCASPAR and IRIS. Nonetheless, NCSES recognizes the challenges described above, and in July 2010 reached out to the National Academies to request a study that would lead to recommendations for revised, refocused, and new STI indicators reflecting the fundamental and rapid changes that have occurred in the domestic and global STI system.9 In response to that request, the Committee on National Statistics of the National Research Council, in collaboration with the Board on Science, Technology, and Economic Policy, convened the Panel on Developing Science, Technology, and Innovation Indicators for the Future. The panel’s detailed statement of task is presented in Box 1-2.
NCSES sought the panel’s assessment of the types of data, metrics, and indicators that would be particularly influential in evidentiary policy and decision making for the long term. NCSES also charged the panel with recommending indicators that would reflect the fundamental and rapid changes in the global STI system while having practical resonance with a broad base of users in the near, medium, and long terms.
Given the panel’s charge and the backdrop of a changing data environment, three principles guided this study.
First, the panel endeavored to map existing STI indicators against the known and anticipated high-level issues the indicators are used to address—a policy-driven framework. For example, the current set of indicators could be improved to better assist policy makers in making basic science and technology funding decisions, such as the mix of government support to business R&D, or in understanding the position of the United States relative to that of various other nations in the production of a STEM workforce. STI indicators can provide early warning that a critical investment or activity is waning (or succeeding) or that important advances are being made overseas. STI indicators also offer useful measures of total factor productivity, a key element of the national income and product accounts. NCSES and other international organizations10 produce a vast array of STI indicators, which
____________________
8Available: http://www.hsgac.senate.gov/subcommittees/federalfinancial-management/hearings/census-planning-ahead-for-2020 [October 2012].
9To some degree, this study can be seen as a complement to three previous studies of NCSES programs by the National Research Council’s Committee on National Statistics: Measuring Research and Development Expenditures in the U.S. Economy (National Research Council, 2005), which focuses on survey redesign to improve measurement of R&D and innovation; Data on Federal Research and Development Investments: A Pathway to Modernization (National Research Council, 2010), which addresses improvements to surveys of federal funds for R&D and federal science and engineering support for universities, colleges, and nonprofit institutions; and Communicating Science and Engineering Data in the Information Age (National Research Council, 2012), which highlights data dissemination techniques using Internet-based tools.
10Other organizations include but are not limited to: Eurostat; OECD; Statistics Canada; and United Nations Educational, Scientific and Cultural Organization (UNESCO).
can be classified into the following subtopics: human capital (including education and workforce statistics); R&D (including business, academic, and nonprofit expenditures on R&D and government intramural and extramural appropriations or outlays on R&D); outputs (including patents, articles and citations, and innovation); technology balance of payments and trade in R&D-intensive industries; venture capital in science and technology sectors; and public attitudes on science and technology. One often used indicator of a country’s preeminence in STI activities is the ratio of R&D to GDP. A full discussion of the sources and types of STI indicators is included in Chapter 3 and Appendix F of this report.
BOX 1-2
Statement of Task
An ad hoc panel, convened under the Committee on National Statistics, in collaboration with the Board on Science, Technology, and Economic Policy, proposes to conduct a study of the status of the science, technology, and innovation indicators (STI) that are currently developed and published by the National Science Foundation’s National Center for Science and Engineering Statistics (NCSES). Specifically, the panel will
- Assess and provide recommendations regarding the need for revised, refocused, and newly developed indicators designed to better reflect fundamental and rapid changes that are reshaping global science, technology and innovation systems.
- Address indicators development by NCSES in its role as a U.S. federal statistical agency charged with providing balanced, policy relevant but policy-neutral information to the President, federal executive agencies, the National Science Board, the Congress, and the public.
- Assess the utility of STI indicators currently used or under development in the United States and by other governments and international organizations.
- Develop a priority ordering for refining, making more internationally comparable, or developing a set of new STI indicators on which NCSES should focus, along with a discussion of the rationale for the assigned priorities.
- Determine the international scope of STI indicators and the need for developing new indicators that measure developments in innovative activities in the United States and abroad.
- Offer foresight on the types of data, metrics and indicators that will be particularly influential in evidentiary policy decision-making for years to come. The forward-looking aspect of this study is paramount.
- Produce an interim report at the end of the first year of the study indicating its approach to reviewing the needs and priorities for STI indicators and a final report at the end of the study with conclusions and recommendations.
The second principle guiding this study was the priority of international comparability for key STI indicators. Indeed, policy relevance and international comparability were, to a large extent, complementary elements of the panel’s focus. Discussions with U.S. policy makers and international experts on STI indicators throughout this study made clear the similarities in the types of policy questions asked worldwide and the interest in having internationally comparable data at the national and subnational scales. This principle also comports with NCSES’s mandate to produce statistics on U.S. competitiveness in science, engineering, technology, and R&D.
The third key principle was efficiency, which entailed identifying those STI indicators that are essential and those that can be eliminated. NCSES requested that the panel deliver a prioritized list of STI indicators. The panel interpreted this request as necessitating efficiency gains that would require limiting the number of measures that can be considered key national STI indicators and establishing time- and resource-saving processes for creating those measures. The panel also used this opportunity to recommend approaches that NCSES could use to develop new or reinterpret existing indicators. Moreover, because STI indicators draw on data from the R&D and human resources statistics programs at NCSES, the panel identified synergies among all three programs as prospects for efficiency gains.
The panel’s approach to this study comprised five components (see Figure 1-1).
First, the panel consulted users, experts, and written reports and peer-reviewed articles to establish current and anticipated user needs for STI indicators. Users interviewed included policy makers, government and academic administrators, researchers, and corporate decision makers in high-tech manufacturing and service industries. The panel also sought input from developers of STI indicators and from individuals who are called on by policy makers and other decision makers to conduct assessments of high-tech sectors in the United States and abroad. To this end, the panel held two workshops, one at the National Academies in Washington, DC, July 2011, and the other in Paris following the meeting of the OECD-National Experts on Science and Technology Indicators (NESTI) Working Group in June 2012. These discussions collectively yielded a wealth of information on policy questions and specific measures considered of high priority by users of STI data and indicators.11
____________________
11See Appendix B for the full list of users and providers of STI indicators who informed the panel about key measures that NCSES should develop or continue to produce. That appendix also includes an updated list of policy issues published in the panel’s interim report.
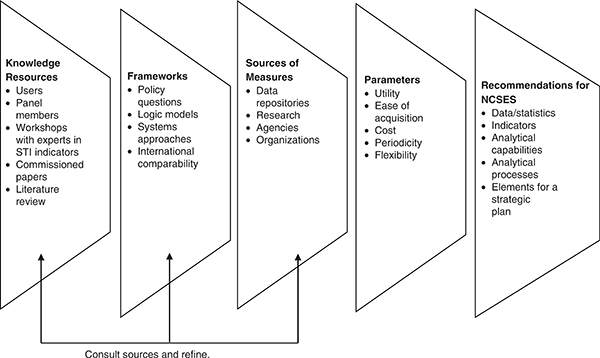
FIGURE 1-1 Panel’s organizing framework.
Second, recognizing that no one model informs the types of indicators NCSES needs to produce, the panel looked to policy questions, logic models, systems approaches, and international comparability to refine the suite of indicators it would recommend as priorities. Although policy relevance is an important principle for prioritizing STI indicators, the panel notes that an indicator rarely can answer a policy question in and of itself, given that policy issues are usually highly complex and depend on multiple, interrelated factors.12 At the same time, indicators have a major role in informing policy debates.
Third, it was important to identify data resources and tools that NCSES could use to further develop its indicators program. Understanding the network of inputs—including data from NCSES surveys, other federal agencies, international organizations, and the private sector—that currently and should in the future feed into the production of indicators was important for this study.
Fourth, the panel applied several parameters in refining its recommendations to NCSES. Primary among these was utility but also considered were ease of acquisition, cost, periodicity, and flexibility.
Fifth, the panel’s recommendations were not limited to indicators, but also encompassed processes for prioritizing data development and the production of indicators in the future, because it was clear that the changing environment in which the agency operates is a key determinant of its priorities from year to year. Internal processes that are observant, networked, and statistically and analytically balanced are important to NCSES’s indicators program. The panel also outlined elements of a prioritization strategy for producing timely, reliable STI indicators.
NCSES did not ask the panel to recommend new survey designs. It also did not request the panel’s attention to the formulation of a much-needed updated data taxonomy or to the development of theoretical foundations of measurement
____________________
12In a paper commissioned for this study, Hall and Jaffe (2012, p. 39) make this point as well: “In our view, indicators and other data will never, in and of themselves, provide answers to questions of this kind. The questions posed are, for the most part, research questions. Answering them requires not just data but modeling and analysis. Indicators and data more generally are necessary inputs to the research process that can provide answers to these questions, but they do not provide the answers without that analysis…. There is one category of normative questions that does, in principle, relate to indicators, and that is the allocation of public resources across different disciplines or areas of research.”
for indicators derived from web sources or administrative records.13 These are excellent topics for companion studies.
Chapter 2 of this report establishes the systems framework that STI indicators are designed to inform and then identifies the types of measures that users collectively indicated to the panel are essential or of high priority. Chapter 3 reviews NCSES’s current suite of indicators and those indicators the agency should improve or create to meet high-priority user needs. Chapters 4-6 are the core chapters of the report, focusing, respectively, on the panel’s recommendations for measuring innovation, knowledge capital and networks, and human capital. These chapters, therefore, cover innovation activities and related outcomes extensively. Other measures, related to actors and various linkages in the STI system, as well as to market conditions, culture, and socioeconomic impacts, span these three core areas and are taken up in Chapters 4-6 where appropriate. Chapter 7 expands on frontier methods for data extraction and manipulation that are introduced in the three core chapters. In Chapters 2-7, the panel’s recommendations on the respective topics are presented at appropriate points in the text. Finally, Chapter 8 presents the panel’s recommendations for processes NCSES could use to make strategic decisions about data acquisition for indicators and methods for indicator development, and links these processes to the recommendations in Chapters 2-7 to form a strategic program of work.
Eleven appendixes follow the main chapters of the report. In brief biographical sketches, Appendix A conveys the expertise of panel members conducting this study. Because the organizing framework for prioritizing STI indictors was informed by user needs, Appendix B goes in depth into questions posed by users and specific measures they would like to see NCSES produce in the future. Workshops were one means by which the panel gleaned information on demand for STI indicators and the types of measures that are found most useful in various countries at the national level and at smaller geographic scales. Appendixes C and D present the agendas and lists of participants for the panel’s two internationally focused workshops: the Workshop on Developing Science, Technology, and Innovation Indicators for the Future, which was held in Washington, DC, July 2011, and the OECD-NESTI Workshop, which was held in Paris, June 2012. The next five appendixes highlight the research- and data-driven functions of NCSES’s indicators program. Appendix E gives abstracts of grants funded by NCSES’s Grants and Fellowships program. Appendix F goes into depth on STI indicators produced by NCSES and other organizations around the world; this appendix includes background material for Chapter 3 of the report. Appendixes G through K show statistical measures derived from NCSES’s Business Research and Development and Innovation Survey (BRDIS), which are important for the analysis of innovation activities reported by the indicators program. Appendixes B through K are all referenced in the main text of the report where relevant.
____________________
13It should be noted that Science and Engineering Indicators 2012 has an appendix titled “Methodology and Statistics” that describes data sources and potential biases and errors inherent in the data collected (National Science Board, 2012a). OECD-Eurostat (2005, pp. 22-23), in the Oslo Manual, also has an extensive published methodology on the development of indicators. In addition, a previous study of the National Research Council (2005, pp. 144-151) has a chapter on sampling and measurement errors entailed in surveys and the use of federal administrative records. The economics literature is also replete with articles examining the existence of and correction for measurement errors that occur owing to survey methods (see, e.g., Adams and Griliches, 1996; Griliches, 1974, 1986). Further study of measurement theory as it relates to STI indicators is beyond the scope of this study. As detailed later in this report, however, the panel recommends that NCSES fund research to explore biases introduced in data that are gathered using web tools or administrative records.


