
11
Wider Consequences for U.S. Society
The effects of high rates of incarceration extend far beyond the millions of people who have served time in jail or prisons and the families and communities they have left behind. The committee found that the increase in incarceration rates has also had broader effects on U.S. society—on civic and political participation, on fundamental notions of citizenship, on the allocation of public resources, and on the functioning of the polity and government. These effects are only beginning to receive sustained scholarly and analytical attention.
More specifically, we found that the extraordinary growth of the U.S. penal system has begun to alter how major governing and public institutions operate. It also has begun to compromise the quality of important demographic, political, and socioeconomic databases, producing misleading findings about trends in economic growth, political participation, unemployment, poverty, internal migration, and public health. Furthermore, many people, including prisoners, parolees, probationers, convicted sex offenders, and others with a criminal record, are now routinely denied a range of rights as well as access to many public benefits because of previous or current involvement with the criminal justice system. The result is a growing number of people who are “partial citizens” or “internal exiles” in the United States (Manza and Uggen, 2006, p. 9; Simon, 2007, p. 164). As the number of people in the United States with a criminal record has grown, the criminal justice system is increasingly serving as a major gateway to a much larger system of stigmatization and long-term marginalization. This trend has some similarities with earlier patterns of legal discrimination and racial segregation (Alexander, 2010, p. 12). For U.S. citizens, a criminal
record, especially a felony conviction, often confers a legal, political, and social status that falls far short of full citizenship.
Another major societal consequence is that the penal system has been consuming larger portions of many government budgets. As a result, less money is available to spend on education, health care, economic development, state and local police, and other key government interventions and services to aid historically disadvantaged groups and improve the health and well-being of the population as a whole.
As this chapter demonstrates, some of the effects of high incarceration rates on U.S. society are straightforward. Others are more difficult to assess because they are subtle and because standard social, demographic, and economic databases are inadequate. Furthermore, it is difficult to separate the effects of the rise in incarceration rates from those of coinciding social, economic, and political changes. The upward turn in the incarceration rate that began in 1973 came amid a period of tumultuous changes in the United States, as discussed in Chapter 4. Those changes included large-scale social and political unrest, the migration of minority and immigrant populations into cities, white flight to suburbs, expanding civil rights, transformations in family structure, changes in welfare and other key social programs, deindustrialization, the decline of organized labor, rising income inequality, and many others. In reviewing the empirical evidence, we attempted to distinguish carefully the effects of high rates of incarceration from those of other contemporaneous changes.
In this chapter, we begin by examining the new gradations of citizenship resulting from the growing numbers of people not confined in jails or prisons but nonetheless entangled with the penal system. We then look at the political consequences of how prisoners are enumerated in the U.S. census and of the disenfranchisement, in all but two U.S. states, of prisoners and those with a criminal record. Next we turn to the effect of the exclusion of inmates from standard social surveys on estimates derived from the survey results. This is followed by a discussion of the fiscal burden imposed by high rates of incarceration.
Focused on the sharp increase in the number of people serving time in jail or prison, analysts have only just begun to pay attention to the remarkable rise in the number of people who are not confined to jail or prison but are nonetheless enmeshed in the penal system. As noted in Chapter 2, on any given day, in addition to the more than 2 million people confined in jail or prison, another 5 million are on probation or parole or under some form of community supervision—altogether about 1 of every 31 U.S. adults (Glaze et al., 2010). By age 23, at least a third of Americans have
been arrested, compared with an estimated 22 percent in the mid-1960s (Brame et al., 2012, pp. 21-27). At least 16 million people have a criminal record that includes a felony conviction. In some major cities, 80 percent of young African American men now have a criminal record (Street, 2002). This involvement with the penal system curtails the citizenship of those affected in a number of ways.
Many of the 5 million people currently serving parole and probation are subject to a matrix of controls intended to both encourage and condition their reentry to society and deter the commission of further crimes. Although some of these practices are not new, the number of people exposed to them has grown considerably as rates of crime, conviction, and incarceration have grown. Furthermore, technological, legal, and other developments have made it easier and less costly to maintain elaborate surveillance systems that extend beyond the prison. Probation and parole officers are permitted to regulate many aspects of the lives of the people they are supervising—everything from where probationers and parolees live and with whom they associate to whether they are permitted to keep beer in their refrigerator or carry a cell phone. Law enforcement officers also are permitted to conduct warrantless searches of probationers and parolees that are not subject to the standard Fourth Amendment protections, and many probationers and parolees are subject to frequent unannounced drug tests (Petersilia, 2003, pp. 81-83; Travis, 2005).
In her ethnographic study of “life on the run” in a disadvantaged neighborhood in Philadelphia, Goffman (2009) details the extensive systems of policing and supervision that have accompanied the rise of incarceration rates. She demonstrates how these developments have fostered a climate of fear and suspicion that penetrates all aspects of daily life in these neighborhoods, including intimate and family relations, labor force participation, and access to medical care. Goffman describes how men on probation or parole and those with outstanding warrants, even for trivial offenses, avoid the police and the courts at all costs—even when they are the victims of violent attacks and other serious crimes—out of a justified fear they will be sent to prison or jail (Goffman, 2009, p. 353).
As noted in Chapter 8, punishment for many does not end after they have served their prison sentence or successfully completed their probation or parole. Many ex-felons (and even some former misdemeanants) are subjected to what is commonly known as “civil death,” or the loss of certain
civil rights due to a criminal conviction. This loss of rights and privileges pushes them further to the political, social, and economic margins. Travis (2005) terms these legal extensions of incarceration “invisible punishment.” In November 2011, the American Bar Association released a database identifying 38,000 punitive provisions that apply to people convicted of crimes (American Bar Association Criminal Justice Section, 2011).
States deny those with a criminal record licenses to work in many professions, including plumbing; food catering; and even haircutting, a popular trade in many prisons (Hull, 2006, p. 33; Legal Action Center, n.d.). Numerous states suspend or revoke the driver’s licenses of people convicted of drug offenses, even when those offenses did not involve a driving-related incident. Many states provide no means for obtaining restricted driver’s licenses that would allow those convicted of drug offenses to get to work, school, or treatment. Individuals with felony convictions sometimes must forfeit all or some of their pension, disability, or veteran’s benefits. Many are ineligible for public housing, student loans, food stamps, and other forms of public assistance (Simon, 2007, pp. 194-198; Alexander, 2010, Chapter 4). Dozens of states and the federal government ban former felons from jury service for life. As a result, nearly one-third of African American men in the United States are estimated to be permanently ineligible to serve as jurors (Kalt, 2003, pp. 67, 170-171). These developments, together with the persistence of extensive racial discrimination in jury selection, compound the problem of the gross underrepresentation of African Americans on juries.1
Some jurisdictions forbid employers to discriminate against job applicants based solely on their criminal record unless their offense is directly relevant to performing the job (see, e.g., National Employment Law Project [2012]). But applicants with a criminal record are still disproportionately denied jobs (see Chapter 8), and rejected job seekers have great difficulty obtaining redress in the courts (Hull, 2006, pp. 32-34). The problem of employment discrimination against people with a criminal record has grown as the numbers arrested and convicted have escalated and as background checks have become less costly and easier for employers to conduct.2 Pager’s (2007) seminal audit study of employment, race, and criminal history, discussed in Chapter 8, reveals that the stigma of a criminal conviction
_____________________
1See Equal Justice Initiative (2010) for more on how racial discrimination remains an important factor in the operation of juries despite landmark Supreme Court decisions that supposedly curtailed the use of race in jury selection.
2More than 90 percent of employers surveyed conducted criminal background checks in 2009 (Society for Human Resource Management, 2010), up from 66 percent in 1996 (Society for Human Resource Management, 2004, p. 19). Many employers rely on unregulated private firms to conduct these checks, which often contain information that is inaccurate, incomplete, or misleading (Bushway et al., 2007).
presents an enormous barrier to employment for black applicants and a considerable barrier for white applicants (Pager, 2007).
In 2012, the Equal Employment Opportunity Commission approved a new policy making it more difficult for employers to use background checks to systematically rule out hiring anyone with a criminal record. The Commission acknowledged that employers may legally consider criminal records in their hiring decisions, but determined that across-the-board exclusion of all applicants with a conviction could violate employment discrimination law because of the potentially disparate effects on racial and ethnic minorities. “National data supports a finding that criminal record exclusions have a disparate impact based on race and national origin,” according to the agency (as quoted in Greenhouse, 2012).
As a result of the rise in the incarceration rate, a growing proportion of U.S. citizens—especially from poorer and minority communities—is now excluded from key aspects of civic and political life. The widespread practice in the United States of denying the right to vote to people with a criminal conviction raises questions about how the growth of the prison population is transforming conceptions of citizenship and affecting democratic institutions. As Chief Justice Earl Warren declared in the landmark 1964 Reynolds v. Sims decision: “The right to vote freely for the candidate of one’s choice is of the essence of a democratic society, and any restrictions on that right strike at the heart of representative government.”3
Recent presidential elections drew public attention to the plight of the millions of Americans barred from voting by a maze of state laws that deny the right to vote to people who have completed their sentence, as well as probationers, parolees, and prisoners.4 Other established democracies generally place far fewer restrictions on the right to vote for people with a criminal conviction, including those in prison. The United States not only disenfranchises most of its prisoners but also routinely disenfranchises people who have completed their sentence—an exceptional practice in most other Western democracies.5 Numerous states also disenfranchise
_____________________
3Reynolds v. Sims, 377 U.S. 533 (1964), 555. This decision declared unconstitutional legislative districts across states that were not of comparable population sizes.
4According to a 2002 public opinion poll, only about one-third of Americans endorse allowing people currently in prison to vote. However, a majority of Americans favor restoring voting rights to ex-felons—with the magnitude of the majority varying depending on the nature of the offense (Manza et al., 2004).
5At least 18 European countries place no restrictions on the right to vote for those imprisoned, while about half a dozen, including England, do not allow prisoners to vote. Some European countries restrict prisoners’ right to vote based on the crime committed or their length
nonincarcerated individuals who are serving probation or parole (Manza and Uggen, 2006, pp. 38-39).
The political impact of laws disenfranchising felons in the United States is so large because the number of people with a criminal conviction is so large and those laws also have racial origins and racial consequences. After the Civil War, public officials carefully tailored their felon disenfranchisement laws so as to circumvent the Fifteenth Amendment and thus restrict the vote of newly freed blacks (Uggen et al., 2006; Brown-Dean, 2004; Hull, 2006; Manza and Uggen, 2006, Chapter 2; Pettus, 2005, Chapters 3-5). The U.S. Supreme Court has generally upheld such laws, except in instances of clear and convincing evidence that they were enacted with a racially discriminatory intent.6
As of 2010, nearly 6 million people were disenfranchised because of a felony conviction—a 5-fold increase since 1976. This figure represents about 2.5 percent of the total U.S. voting-age population, or 1 in 40 adults. One of every 13 African Americans of voting age, or approximately 7.7 percent, is disenfranchised. This rate is about three times greater than the disenfranchisement rate for non-African Americans (Uggen et al., 2012a, p. 1).
The distribution of disenfranchised felons varies greatly by state, race, and ethnicity because of variations in state disenfranchisement statutes and state incarceration rates. In the three states with the highest rates of African American disenfranchisement—Florida, Kentucky, and Virginia—more than one in five African Americans is disenfranchised (Uggen et al., 2012a, p. 2). In Arizona and Florida, an estimated 9 to 10 percent of voting-age Latino citizens are disenfranchised because of their criminal record (Demeo and Ochoa, 2003). New research suggests that administrative practices—such as providing former felons with incomplete or inaccurate information about their voting rights—sometimes turn temporary voting bans into de facto lifelong disenfranchisement (Allen, 2011). Experts disagree about the magnitude of the impact of the disenfranchisement of those with a criminal record on the outcome of close elections.7
___________________________________________________
of sentence. For example, Germany’s ban extends only to prisoners whose crime targeted the integrity of the state or of the democratic polity. Most European countries do not restrict the right to vote of convicted individuals who are not incarcerated (White, 2013, pp. 8-9, 47-57).
6For a summary of the key felon disenfranchisement legal decisions, see Manza and Uggen (2006, pp. 28-34).
7Manza and Uggen (2006, p. 192) estimate that if Florida had not banned an estimated 800,000 former felons from voting in the 2000 election, Al Gore would likely have carried the state and won the White House. Burch (2012, p. 5) disputes this claim, arguing that Manza and Uggen’s results “are based on estimates of turnout and vote choice of the non-felon population, with no evidence based on the behavior of actual offenders.” Manza and Uggen (2006, pp. 192-196) also contend that the Democratic Party would likely have controlled the U.S. Senate for much of the 1990s, as well as several additional governorships, had former felons been permitted to vote. Hjalmarsson and Lopez (2010) agree with Manza and Uggen’s analysis
Since the mid-1990s, about two dozen states have amended their statutes and policies to expand the eligibility to vote for citizens with felony convictions. By 2010, an estimated 800,000 people had regained the right to vote thanks to the repeal of or amendments to lifetime disenfranchisement laws, the extension of voting rights to parolees and probationers, and the relaxation of restrictions on the process of restoring voting and other rights (Porter, 2010). However, some of the measures designed to ease restrictions on voting rights have since been reversed (Sample, 2011, p. 37; Porter, 2010, p. 12).
The impact of penal policies on political participation extends beyond official barriers to voting such as felon disenfranchisement statutes. Evidence shows that those who have contact with the criminal justice system are more likely than others to withdraw from political and civic life. Having a criminal conviction may be a more significant factor than formal legal barriers to voting in depressing voter turnout among those affected (Burch, 2007). After controlling for socioeconomic status, criminality, and other key variables, contact with the criminal justice system—from being stopped by the police to serving time in prison—appears to have a cumulatively negative effect not only on voter registration and turnout but also on involvement in civic groups and trust in the government (Weaver and Lerman, 2010, p. 827; see also Cohen, 2010; Bobo and Thompson, 2006). New research suggests that, all things being equal, the family and fellow community members of felons and ex-felons also are more likely to be politically disengaged and to perceive the criminal justice system as unfair and illegitimate (Sugie, 2013; Muller and Schrage, 2014; Lee et al., 2013; Burch, forthcoming; Lerman and Weaver, 2014). Because police stops, arrests, and convictions are concentrated within certain racial and ethnic groups and in certain geographic areas, growing contact with the criminal justice system and the related rise in incarceration and restrictions on citizenship appear to be creating a phenomenon that Burch calls “concentrated disenfranchisement” (Burch, 2007, Chapters 5 and 6).
THE U.S. CENSUS AND POLITICAL REPRESENTATION
The way prisoners are enumerated in the decennial census not only affects the accuracy and quality of demographic data (see the discussion of “invisible inequality” below) but also raises important political questions. In every state except Maine and Vermont, imprisoned felons are barred from voting. Yet disenfranchised prisoners are included in the census’s population tallies for the jurisdictions where prisons are located. These
___________________________________________________
that Gore would have won the 2000 election had former felons in Florida been permitted to vote but dispute some of their conclusions about control of the U.S. Senate.
tallies are used for congressional reapportionment and for redistricting of state house and senate seats, city councils, and other government bodies. Prisoners counted as part of those local populations have bolstered the electoral representation of those jurisdictions.
Enumerating prisoners in this manner dilutes the votes of urban and rural areas that do not have a prison within their jurisdiction. For example, nearly 40 percent of the inmates in Pennsylvania’s state prisons come from Philadelphia, which has no state prisons in its city limits (Elliott-Engel, 2009). For census and redistricting purposes, these Philadelphia citizens—nearly all of whom are black or Latino—are considered residents of the counties where they are imprisoned. These tend to be predominantly white, rural districts.8
The evidence of political inequities in redistricting due to the way the U.S. Census Bureau counts prisoners is “compelling” according to a report of the National Research Council (2006, p. 9). If prisoners in Texas were enumerated in their home county rather than where they are incarcerated, Houston would likely have one additional state representative in the latest round of redistricting (Houston Chronicle, 2011). Likewise, an analysis by the Prison Policy Initiative (Wagner, 2002) finds that several Republican seats in the New York State Senate would be in jeopardy if prisoners in upstate correctional institutions were counted in their home neighborhood in New York City.
Under growing political pressure to revise how it enumerates prisoners, the U.S. Census Bureau announced in early 2010 that it would begin collecting and providing to states data on the size of the population living in group quarters such as prisons. This decision has made it easier for states, should they so choose, to redraw districts based on counts that enumerate prisoners in their home neighborhood, not where they happen to be serving their prison sentence. Since 2010, several states, including New York, Maryland, California, and Delaware, have enacted laws that call for counting prisoners at their last address for purposes of redistricting rather than as “residents” of the jurisdiction in which they are incarcerated (Clark, 2012).
The contribution of higher rates of incarceration to the growth in political, social, and economic inequality in the United States can be difficult to discern because of the way standard social surveys account for
_____________________
8Nearly 200 counties nationwide now have at least 5 percent of their “residents” in prison, and about 20 counties have more than 20 percent of their “residents” incarcerated in prison (Lotke and Wagner, 2004). In one city council district in Anamosa, Iowa, 96 percent of the inhabitants were incarcerated (Wagner, 2011).
individuals incarcerated in prison and jail. Government-collected survey data are widely used to measure such key social indicators as trends in unemployment, wage inequality, high school completion, voting participation, and mortality and morbidity. With the growth in the size of the prison population, whether and how one counts jail and prison inmates has large implications for the resulting estimates. Most general population data collections exclude current inmates by design. As a consequence, measures commonly used to assess the well-being of the U.S. population will be biased, and the time trend in these measures will generally be overly positive, especially for historically disadvantaged groups, concealing the extent of deprivation in American society.
Politicians and policy makers at all levels of government—from Washington to state capitals to city halls—routinely use the census and other federal surveys to identify problems and target resources. Since the 1930s, these federal surveys have been central to determining how federal government funds are allocated to state and local jurisdictions.9
Undercounting of historically disadvantaged groups has been a perennial problem for the decennial census. Since the mid-twentieth century, the size of the census undercount has diminished, thanks in part to improved statistical techniques; greater investments in data collection; and growing political pressure, especially from urban areas and advocacy groups, to enumerate marginalized groups fully and accurately. Nonetheless, the undercount of African Americans remains considerable, estimated to be as high as 3 percent in the 2000 census.10 Because this problem is well understood, users can apply the weights provided by the Census Bureau
_____________________
9Pettit (2012, Table 2.1) calculates that 16 percent of the federal budget—or more than 3 percent of gross domestic product (GDP)—is currently allocated to state and local governments through grants-in-aid based on formulas derived from the census and other federal surveys. Lotke and Wagner (2004, p. 602) estimate the total amount of money reallocated because of the way inmates are counted as a “consistent, low-level distortion in funding formulations” on the order of $100 per person. With the caveat that it is difficult to generalize, they also note that the money is more likely displaced from small counties without prisons than from counties with large populations.
10An estimated 5 percent of African American men were excluded from the 2000 U.S. census (Robinson et al., 2002, cited in Pettit, 2012, p. 30). Much of the undercount of African Americans and other minorities likely is due to their “higher rates of residential mobility and instability, homelessness, and residence in highly concentrated urban areas”—the same factors that are highly correlated with people who have spent time in jail or prison (Pettit, 2012, pp. 30-31). The Census Bureau itself reports an undercount of 2.1 percent of the black population in 2010, essentially unchanged from the 1.8 percent it estimated for 2000 (U.S. Census Bureau, 2012).
to compensate for the undercount. More troubling is that the census also appears to be doing a worsening job of enumerating how many people are inmates. From 1980 to 2000, census estimates of the size of the jail and prison population reasonably matched Bureau of Justice Statistics (BJS) figures, but since then, the census and BJS data have been diverging dramatically (Pettit, 2012, p. 31).
For certain purposes, the decennial census has been severely compromised by the growth in numbers of people incarcerated. Distortions resulting from the way the census enumerates prisoners have led to misleading conclusions on such matters as economic growth, migration, household income, and racial composition. For the 2010 census, the Census Bureau chose to continue the practice of enumerating prisoners as residents of the towns and counties where they are incarcerated. But most inmates have no personal or civic ties to these communities and almost always return to their home neighborhood upon release. In the 2000 census, 56 counties nationwide—or 1 in 50—with declining populations were reported to be growing because of the inclusion of their incarcerated populations in census counts (Heyer and Wagner, 2004). As former U.S. Census Bureau Director Kenneth Prewitt (quoted in Wagner, 2012) explains, “Current census residency rules ignore the reality of prison life…. Counting people in prison as residents of their home communities offers a more accurate picture of the size, demographics and needs of our nation’s communities.”
Other major social surveys, such as the Current Population Survey (CPS), do an even worse job than the decennial census of incorporating marginalized populations, especially young black men, in their data collection. The CPS and many other leading federal surveys are based on periodic statistical sampling of people living in households. This practice omits the growing population of people confined to jails and prisons. Furthermore, these household-based surveys tend to undercount young black men who are not in prison or jail because many of these men maintain a loose connection (at best) to a household. Pettit (2012, p. 32) estimates that 16 percent or more of black men are rendered invisible in standard household surveys because of these two factors. Users of these databases could adjust for the jail and prison population, but often do not.
The leading surveys used to assess health outcomes, notably the National Health Interview Survey, the National Health and Nutrition Examination Survey, and the National Survey of Family Growth, are modeled on the CPS and therefore also undercount marginalized populations not attached to households. They also do not statistically sample inmates, even though it is well established that imprisonment exacerbates many public
health problems—notably the rates of transmission of communicable diseases, such as hepatitis C, HIV/AIDS, and tuberculosis—and even though prisoners and former prisoners are much more likely to test positive for these diseases than the general population (Pettit, 2012, pp. 94-96; see also Chapter 7). Although it is theoretically possible for researchers to combine information from inmate surveys and surveys of the nonincarcerated population, federal surveys specifically designed to gauge the health status of inmates “are not always comparable to those conducted with the non-institutionalized population” (Pettit, 2012, p. 96).
When researchers incorporate the impact of the growth of the incarcerated population into their analyses of trends in leading measures of inequality, the picture of widening inequalities is at odds with conventional narratives that stress a narrowing of the black-white gap in such critical areas as wages, employment, education, and political participation. Research accounting for the incarcerated population challenges claims about the achievements of the economic expansion of the 1990s, widely regarded as the largest peacetime economic expansion in U.S. history. With the incarcerated population factored in, the unemployment rate for males would have been at least 2 percentage points higher by the mid-1990s (Western and Beckett, 1999, p. 1052). Furthermore, the jobless rate for young black males in 2000 would have been 32 percent, not the official 24 percent (Western, 2006, p. 90). Although researchers disagree about the assumptions underlying these estimates and the actual magnitude of the distortion in the unemployment rate, these “thought experiments” are at least “worthwhile reminders that when we use labor force statistics to assess how we are doing, we are omitting a large segment of the population” (Useem and Piehl, 2008, p. 152).
As another example, including inmates in analyses of high school dropout rates increases the dropout rate for young black men by about 40 percent over conventional estimates. This finding suggests that the black-white gap in high school graduation rates has not narrowed since the early 1990s (Pettit, 2012, pp. 50-64). Analyses of wage trends that incorporate inmates also suggest that the relative wages of young black men have not improved over the past two decades and that claims about the recent shrinking of the black-white wage gap are overstated (Pettit, 2012, pp. 64-67).
For more than half a century, the country’s plummeting voter turnout rate has been a cause of national concern and been vigorously debated. But most analyses of voter turnout fail to consider the large and growing number of noncitizens, prisoners, people on parole or probation, and ex-felons who have been disenfranchised by electoral laws. By not doing so, they tend
to misestimate the extent and sources of the overall decline in voter turnout in the United States (Manza and Uggen, 2006, pp. 176-177).11
Conventional accounts of growing political participation among African Americans based on national surveys, such as the CPS and the National Election Study, also appear to be off the mark. The much heralded narrowing of the black-white gap in voter turnout in recent years likely is due not to rising voter turnout among blacks but to the exclusionary effects of high rates of incarceration and to declines in turnout among whites. Claims that voter turnout among young black men reached record levels in the 2008 election and exceeded that of young white men for the first time do not hold up once the incarcerated population is factored in (Rosenfeld et al., 2011; Pettit, 2012, Chapter 5).
The U.S. Census Bureau (2013, p. 3) recently reported that African Americans voted at a higher rate than whites in the 2012 presidential election. This was the first time blacks outvoted whites since the Census Bureau started publishing voting rates by eligible citizenship population in 1996. However, the Census Bureau analysis did not consider the institutionalized population, which is composed primarily of people residing in correctional institutions and nursing homes. If the hundreds of thousands of African Americans who are incarcerated and therefore ineligible to vote were factored in, the turnout figures for blacks in the 2012 presidential election would have been substantially reduced, perhaps below the turnout rate for whites.
PUBLIC COSTS AND FISCAL PRESSURES
The corrections system and the public safety system more broadly (that is, police, prosecutors, and the courts) command a larger share of government budgets than was the case 30 years ago. Budgetary allocations for corrections have outpaced budget increases for nearly all other key government services (often by wide margins), including education, transportation, and public assistance (Pew Center on the States, 2009, p. 11). Today, state spending on corrections is the third highest category of general fund expenditures in most states, ranked behind Medicaid and education.12 Corrections budgets have skyrocketed at a time when spending for other key social services and government programs has slowed or contracted. As a result, the criminal justice system increasingly is the main provider of health care,
_____________________
11Manza and Uggen (2006) build on earlier work by McDonald and Popkin (2001).
12The actual fiscal burden of the corrections system is probably much higher. A Vera Institute of Justice survey of 40 states added 13.9 percent to those states’ 2010 corrections spending totals for other corrections-related expenditures recorded elsewhere, including current and accruing contributions to employee health care and pensions, some capital costs, and some hospital and health care for prisoners (Henrichson and Delaney, 2012, p. 2).
substance abuse treatment, mental health services, job training, education, and other critical social and economic supports for the most disadvantaged groups in U.S. society.
Between 1972 and 2010, public expenditures for building and operating the country’s prisons and jails increased sharply, keeping pace with the increase in the number of people held in those facilities. From fiscal year 1985 to 2012, corrections spending increased from 1.9 percent to 3.3 percent of state budgets, or from $6.7 to $53.2 billion (U.S. Census Bureau, n.d.-a; Census of Government Finances historical tables; National Association of State Budget Officers, 2013). State corrections spending accounted for 7 percent or more of combined states’ general fund expenditures from fiscal year 2008 through fiscal year 2012 (National Association of State Budget Officers, 2013, p. 1). Over 20 years beginning with fiscal year 1980, only Medicaid grew more rapidly as a proportion of state budgets.
At the local level, government spending for jails totaled $26.8 billion in fiscal year 2010. Corrections spending rose from 1.2 percent of all local spending in 1985 to 1.6 percent in 2010 (U.S. Census Bureau, n.d.-a; Census of Government Finances historical tables). At the federal level, spending for the Bureau of Prisons—both operations and capital—totaled $6.5 billion in fiscal year 2011. As a percentage of the federal budget, spending by the Bureau of Prisons has risen from 0.05 to 0.2 percent of total outlays since 1985. Still, spending on incarceration remains a tiny fraction of the federal budget (James, 2013a, 2013b).13
Adjusted for inflation, states’ combined corrections spending from 1980 to 2009 increased by just over 400 percent, while the number of prisoners increased by 475 percent. Local spending for jails and federal spending for prisons followed similar patterns. Figure 11-1 shows inflation-adjusted trends in spending for incarceration since 1980 for all three levels of government.
The increase in government spending for corrections since 1980 has been driven almost entirely by increased numbers of prisoners.14 Adjusted for inflation, annual costs per prisoner at all three levels of government
_____________________
13The federal government and some states, mainly in the south and west, have funded private entities to administer some prisons and other detention facilities. In 2011, 7.2 percent of state prisoners were in privately run institutions, an increase from 6.4 percent in 2000 but a smaller percentage than in 2010. In 2011, 14.5 percent of federal prisoners were housed in private institutions, more than double the percentage in 2000 (Glaze and Parks, 2012, Appendix Table 1).
14As discussed in Chapter 1, the increased numbers of people incarcerated at any one time are a function of both the numbers sentenced and the average length of time they are incarcerated. A 2012 study shows that the cohort of state prisoners released in 2009 were in custody almost 3 years, 9 months—an average prison stay that was 12 months, or 36 percent, longer than the average stay of those released in 1990 (Pew Center on the States, 2012).
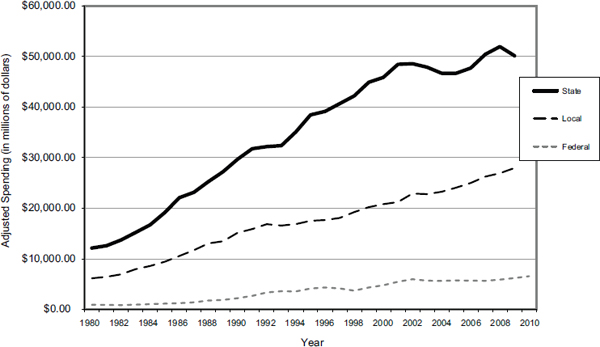
FIGURE 11-1 Trends in state, local, and federal spending for corrections, 1980-2010.
NOTE: Amounts shown are adjusted to 2011 dollars.
SOURCE: Data from U.S. Census Bureau (n.d.-a).
are about the same as they were 30 years ago and have fluctuated during this period only slightly. In 2010 dollars, federal spending per prisoner was around $30,000 per year at the beginning of the 1980s and was $31,000 in 2010. State spending per prisoner was about $37,000 per year (in 2010 dollars) in both 1980 and 2008, the last year for which these figures have been calculated.15 Similarly, local spending for jails was $33,000 per year per inmate in 2010 dollars in 1980 and almost the same in 2008.
Spending per prisoner varies greatly among the states, partly reflecting differences in facilities and services for prisoners, including rehabilitation programming and health care. In 2010, a survey of annual costs in 40 states showed a range of $14,603 per prisoner in Kentucky to $60,076 per prisoner in New York (Henrichson and Delaney, 2012, Figure 4, p. 10).16
_____________________
15This figure applies total state corrections spending to the numbers incarcerated. If this percentage is used to exclude the amounts spent on probation or parole, average state spending per prisoner is around $33,000, or comparable to the average for local governments.
16These estimates include corrections-related expenditures recorded outside the corrections budgets of those states, including current and accruing contributions to employee health care and pensions, some capital costs, and some hospital and health care for prisoners (Henrichson and Delaney, 2012).
Corrections spending can be considered part of a larger set of expenditures related to public safety that also includes police, courts, and prosecution. Combining these functions, the country was spending around $90 billion annually on state and federal public safety, including corrections, by the end of the prison boom, about 6.8 percent of all state and local spending in 2010 (U.S. Census of Governments). This represents a significant shift in public resources, particularly at the state level. While varying by state, policing is largely a local government responsibility; 87 percent of combined state and local police spending in 2010 was by local governments. In contrast, 63 percent of combined state and local corrections spending that year was by state governments. Spending for judicial and legal functions was split almost evenly between the two levels but with wide variation from state to state.
The growth of state corrections spending has slowed with the stabilization of the incarceration rate; cutbacks in staffing, correctional programs, and other services in some jails and prisons; and the levying of more fees on those convicted and their families for everything from a doctor’s visit in prison to parole supervision on the outside. But with the aging of the prison population (as discussed in Chapter 7) and mounting medical costs, correctional budgets will continue to be under substantial pressure for years to come.
Our review of the evidence demonstrates that, in this era of expanded penal control, incarceration has become a key element of the U.S. approach to dealing with marginality and social dysfunction. High levels of incarceration documented throughout this report have exacerbated social, economic, and political inequalities. Punishment has been extended beyond prison by laws and practices that restrict the rights of former felons and render them second-class citizens. The disenfranchisement of felons and ex-felons and the way in which prisoners are enumerated in the U.S. census have combined to weaken the political power of low-income and minority communities. Enumerating prisoners in the jurisdictions where they are serving their sentences—and not in the communities to which they will return—dilutes the votes of those urban and rural areas that do not contain prisons.
Standard survey tools used to measure key social, economic, and other indicators obscure the relationship between high rates of incarceration and inequality. Failure to include in these surveys the large population of people involved with the criminal justice system calls into question assessments of the well-being of the U.S. population, and especially of historically disadvantaged groups.
High rates of incarceration have had important and far-reaching collateral consequences. A growing proportion of people in the United States—especially from poorer and minority communities—has been increasingly marginalized in civic and political life. These developments are creating a distinct political and legal universe for whole categories of people. These “partial citizens” or “internal exiles” are now routinely denied a range of rights and access to many public benefits. These consequences pose a significant risk to achievement of the nation’s aspirations for democratic self-government and social and racial justice.
With the rise in the incarceration rate over the past four decades, a uniquely American form of social policy has emerged that has clear implications for the quality of American democracy. The criminal justice system has become central to how the nation deals with social dysfunction. Corrections spending has grown as a share of government budgets. This system of laws and punishments is meting out stigma and producing social stratification on a large scale and has become a key contributor to the political, social, and economic marginalization of African Americans and members of other groups that have historically been disadvantaged in the United States.
The new penal regime of tougher criminal sanctions, high rates of incarceration, and severely reduced opportunities for the millions of people with a criminal record has not yet drawn widespread public concern. That is partly because these developments have been legitimized so that they appear to be natural, inevitable, necessary, and just, despite the social and political inequalities that result. The net result is the risk that the American criminal justice system will advance social control at the expense of social justice.
The increase in incarceration rates has taken place against the backdrop of deindustrialization and the collapse of inner-city livelihoods, as discussed in Chapter 4. Those sent to prison tend to come from the poorest, most violent, and segregated communities, and imprisonment tends to leave them even more likely to remain poor, unemployed, and socially isolated (Western, 2006), as elaborated in Chapter 10. Incarceration and other kinds of contact with the criminal justice system thus both reflect and exacerbate inequality in the United States.
Race and ethnicity play a crucial role in these developments. On one level, the disproportionate number of blacks, Hispanics, and other historically disadvantaged groups among the incarcerated, though striking, is not altogether surprising. The social deprivation and spatial isolation of the poor and the less educated, many of whom are members of minority groups living in urban areas, tend to foster criminal acts that result in a prison sentence or other penal sanctions. Members of these groups also are at heightened risk of drawing severe sanctions because of intense state surveillance in their communities (see, e.g., Duneier, 1999; Anderson, 1999; Bourgois,
1995; Wilson, 1968, Chapter 2; Herbert, 1997). The limited legal, social, and other resources available to them once they have become involved in the criminal justice system compound the problem.
On another level, the fact that racial and ethnic minorities constitute a large portion of the nation’s prison population must still be questioned on grounds of social justice. Even if the American criminal justice system were entirely free of racial or ethnic discrimination and bias—a highly elusive goal—the fact that blacks, Hispanics, and members of other historically disadvantaged groups dominate the country’s prison and jail populations is deeply troubling. Incarceration ought not to be assessed only in terms of the personal culpability of those behind bars or otherwise caught up in the penal system; collective issues touching on race and citizenship must also be addressed.
Standard justifications of the present U.S. penal regime overlook the many ways in which the broader society was involved in creating and maintaining the damaged, neglected, and feared communities that today produce the country’s highest rates of serious violent crime. Urban districts of concentrated disadvantage—such as North Philadelphia, the West Side of Chicago, the East Side of Detroit, or South Central Los Angeles—have persisted as the result of complex forces and interests ranging far beyond their borders. The antisocial behavior of some people from these communities reflects personal shortcomings, but it also reflects the shortcomings of society as a whole. The overarching question for criminal justice policy is whether long and harsh prison sentences are the most appropriate and effective way of responding to the antisocial behavior of the residents of these hard-pressed communities.


