
In 1973, after 50 years of stability, the rate of incarceration in the United States began a sustained period of growth. In 1972, 161 U.S. residents were incarcerated in prisons and jails per 100,000 population; by 2007, that rate had more than quintupled to a peak of 767 per 100,000. From its high point in 2009 and 2010, the population of state and federal prisoners declined slightly in 2011 and 2012. Still, the incarceration rate, including those in jail, was 707 per 100,000 in 2012, more than four times the rate in 1972. In absolute numbers, the prison and jail population had grown to 2.23 million people, yielding a rate of incarceration that was by far the highest in the world.1
This chapter begins the committee’s exploration of this expansion of incarceration in the United States. It starts by tracing trends in American
_________________
1Small differences in incarceration rates from different sources result mainly from whether jurisdiction counts (prisoners under the jurisdiction of the state, a small number of whom may be housed in county facilities) or custody counts (the actual number housed in state facilities) are used. Only jurisdiction counts are available in a continuous series from 1925 to 2012. A total incarceration rate that includes the jail population should be based on custody counts; otherwise some double counting will occur whereby prisoners housed in county jails are also counted as being under state jurisdiction. Rates in Figure 2-1 are based on jurisdiction counts, while rates in Figure 2-2 are based on custody counts. As noted in Appendix B, the rates of state and federal imprisonment, 1925-2012 (Figure 2-1), were taken from Maguire (n.d., Table 6.28.2011) and from Glaze and Herberman (2013, Table 2). Data for jail incarceration, 1980-2012, were taken from Maguire (n.d., Table 6.1.2011) and from Glaze and Herberman (2013, Table 2). Data on jail incarceration, 1972-1979, were taken from Hindelang et al. (1977, p. 632) and Parisi et al. (1979). Missing years were interpolated. International incarceration rates (Figure 2-2) were taken from International Centre for Prison Studies (2013).
imprisonment rates through the twentieth century and by comparing rates of incarceration in the United States with those in other countries. The chapter then explores the fundamental question of the relationship of the growth in incarceration to crime. To this end, it summarizes two lines of research: the first relates trends in imprisonment to trends in rate of arrests per crime and the chances of prison admission, while the second focuses on the high rate of incarceration among African Americans, calculating how much of the racial disparity in incarceration can be explained by racial disparities in arrests and offending. The following section elaborates on the analysis of racial disparity in incarceration by reporting incarceration rates for whites and minorities, at different ages and different levels of education. That analysis reveals that incarceration rates among prime-age, minority men with very low levels of schooling are extraordinarily high.
The empirical portrait presented in this chapter points strongly to the role of changes in criminal justice policy in the emergence of historically and comparatively unprecedented levels of penal confinement. As a result of the lengthening of sentences and greatly expanded drug law enforcement and imprisonment for drug offenses, criminal defendants became more likely to be sentenced to prison and remained there significantly longer than in the past. The policy shifts that propelled the growth in incarceration had disproportionately large effects on African Americans and Latinos. Indeed, serving time in prison has become a normal life event among recent birth cohorts of African American men who have not completed high school.
U.S. INCARCERATION IN HISTORICAL AND COMPARATIVE PERSPECTIVE
The Bureau of Justice Statistics (BJS) has reported the incarceration rate for state and federal prisons from 1925 to 2012 (see Figure 2-1). Through the middle of the twentieth century, from 1925 to 1972, the combined state and federal imprisonment rate, excluding jails, fluctuated around 110 per 100,000 population, rising to a high of 137 in 1939. As noted earlier, after this period of relative stability, the imprisonment rate grew rapidly and continuously from 1972, increasing annually by 6 to 8 percent through 2000. The rate of growth slowed in the first decade of the 2000s, reaching a peak of 506 per 100,000 in 2007 and 2008. This high plateau was sustained through the end of the decade. In 2012, the imprisonment rate of 471 per 100,000 was still 4.3 times the historical average of 110 per 100,000. If the numbers in jail are added, the incarceration rate totaled 767 per 100,000 in 2007 and 707 per 100,000 in 2012 (Glaze and Herberman, 2013). When stated in absolute numbers rather than rates, the growth in the size of the penal population has been extraordinary: in 2012, the total of 2.23 million people held in U.S. prisons and jails was nearly seven times the number in
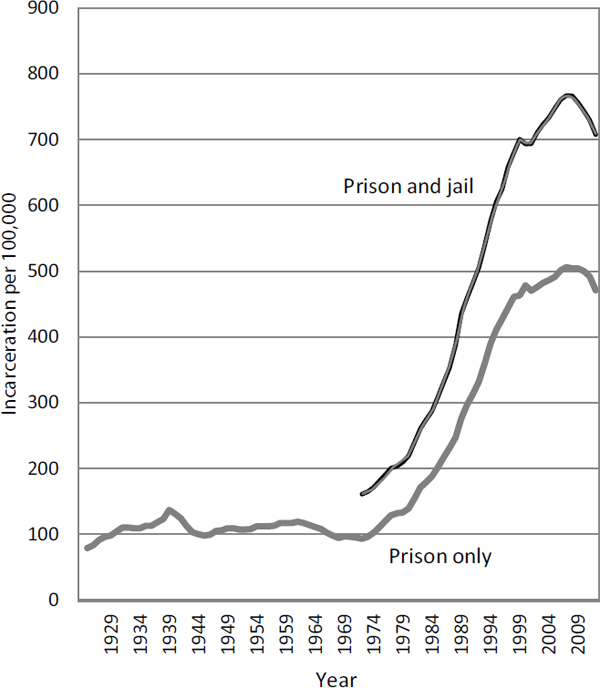
FIGURE 2-1 U.S. state and federal imprisonment rate (1925-2012) and total incarceration including prison and jail inmates (1972-2012) per 100,000 residents.
SOURCES: The 1925-2011 imprisonment series is from the Sourcebook of Criminal Justice Statistics (Maguire, n.d., Table 6.28.2012). The jail population series was constructed from various Sourcebook tables on the total adult correctional population, including Table 6.1.2011, which encompasses the period 1980-2011. (See also Appendix B.) Prison and jail population figures, 2012, are from Glaze and Herberman (2013). U.S. population estimate for 2012 is from the U.S. Census Bureau (n.d.-b).
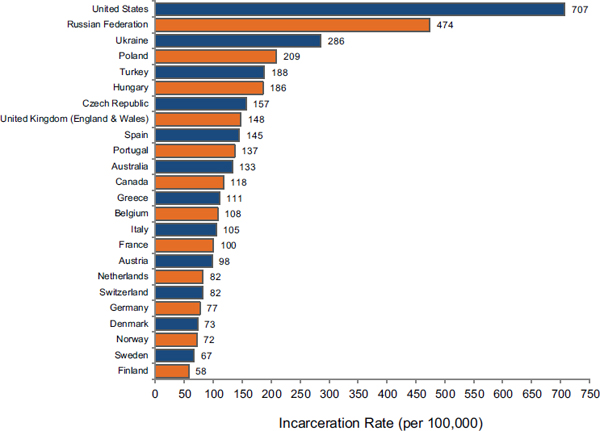
FIGURE 2-2 Incarceration rates per 100,000 population of European and selected common law countries.
NOTES: Rate estimates vary slightly from those of other sources for the United States. Year of reporting for the United States is 2012; years for other nations range from 2011 to 2013.
SOURCE: International Centre for Prison Studies (2013).
1972.2 The three levels of government together had expanded the nation’s penal population by more than 1.9 million people since 1972.
The historically high U.S. incarceration rate also is unsurpassed internationally. European statistics on incarceration are compiled by the Council of Europe, and international incarceration rates are recorded as well by the International Centre for Prison Studies (IPS) at the University of Essex in the United Kingdom. The 2011 IPS data show approximately 10.1 million people (including juveniles) incarcerated worldwide. In 2009, the United States (2.29 million) accounted for about 23 percent of the world total. In 2012, the U.S. incarceration rate per 100,000 population was again the
_________________
2Here “incarceration” is used to refer to the numbers in prison or in jail at a given time. Consistent with the committee’s charge and main focus on those sentenced to prison, generally for periods of a year or more, the term “incarceration” is used in much of the report to refer only to those in prison. However, where jails are discussed or the context does not make the usage clear, the terms “prison” and “jail” are used.
highest reported (707), significantly exceeding the next largest per capita rates of Rwanda (492) and Russia (474) (International Centre for Prison Studies, 2013). Figure 2-2 compares the U.S. adult incarceration rate with the rates of European countries, Australia, and Canada. The Western European democracies have incarceration rates that, taken together, average around 100 per 100,000, one-seventh the rate of the United States. The former state socialist countries have very high incarceration rates by European standards, two to five times higher than the rates of Western Europe. But even the imprisonment rate for the Russian Federation is only about two-thirds that of the United States.
In short, the current U.S. rate of incarceration is unprecedented by both historical and comparative standards.
Trends in Prison and Jail Populations
Discussion and analysis of the U.S. penal system generally focus on three main institutions for adult penal confinement: state prisons, federal prisons, and local jails. State prisons are run by state departments of correction, holding sentenced inmates serving time for felony offenses, usually longer than a year. Federal prisons are run by the U.S. Bureau of Prisons and hold prisoners who have been convicted of federal crimes and pretrial detainees. Local jails usually are county or municipal facilities that incarcerate defendants prior to trial, and also hold those serving short sentences, typically under a year.
This sketch captures only the broad outlines of a penal system with enormous heterogeneity. For example, several small states (Alaska, Connecticut, Delaware, Hawaii, Rhode Island, Vermont) hold all inmates (including those awaiting trial and those serving both short and long sentences) under the jurisdiction of a single state correctional agency. In Massachusetts, county houses of correction incarcerate those serving up to 3 years. Many prisons have separate units for pretrial populations. But this simple description does not encompass the nation’s entire custodial population. Minors, under 18 years old, typically are held in separate facilities under the authority of juvenile justice agencies. Additional adults are held in police lockups, immigration detention facilities, and military prisons and under civil commitment to state mental hospitals.
Despite the great institutional complexity, prisons and jails account for the vast majority of penal confinement. It is here that the transformation of American criminal justice has been most striking, and it is here that the U.S. incarceration rate increased to historically and internationally unprecedented levels.
Trends in the State Prison Population
State prisons accounted for around 57 percent of the total adult incarcerated population in 2012, confining mainly those serving time for felony convictions and parolees reincarcerated for violating their parole terms. Later in the chapter, we examine trends in state prison dynamics in greater detail, by offense categories, and decompose the effect of increased admission rates and increased time served on the rise in the rate of state imprisonment. The state prison population can be broadly divided into three offense categories: violent offenses (including murder, rape, and robbery), property offenses (primarily auto vehicle theft, burglary, and larceny/theft), and drug offenses (manufacturing, possession, and sale). In 2009, about 716,000 of 1.36 million state prison inmates had been convicted of violent crimes.
The most marked change in the composition of the state prison population involves the large increase in the number of those convicted for drug offenses. At the beginning of the prison expansion, drug offenses accounted for a very small percentage of the state prison population. In 1996, 23 percent of state prisoners were convicted of drug offenses (Mumola and Beck, 1997, p. 9). By the end of 2010, 17.4 percent of state prisoners had been convicted of drug crimes (Carson and Sabol, 2012, Table 9).
Trends in the Federal Prison Population
Federal prisons incarcerate people sentenced for federal crimes, so the mix of offenses among their populations differs greatly from that of state prisons. The main categories of federal crimes involve robbery, fraud, drugs, weapons, and immigration. These five categories represented 88 percent of all sentenced federal inmates in 2010.3
Federal crimes are quite different from those discussed above for state prisons. Robbery entails primarily bank robbery involving federally insured institutions; fraud includes violations of statutes pertaining to lending/credit institutions, interstate wire/communications, forgery, embezzlement, and counterfeiting; drug offenses typically involve manufacturing, importation, export, distribution, or dispensing of controlled substances; weapons offenses concern the manufacturing, importation, possession, receipt, and licensing of firearms and cases involving a crime of violence or drug trafficking when committed with a deadly weapon; and immigration offenses include primarily unlawful entry and reentry, with a smaller fraction involving misuse of visas and transporting or harboring of illegal entrants (Bureau of Justice Statistics, 2012a).
_________________
3At least one-half of the remainder comprised those sentenced for possession/trafficking in obscene materials (3.7 percent) or for racketeering/extortion (2.7 percent) (Bureau of Justice Statistics, n.d.-b).
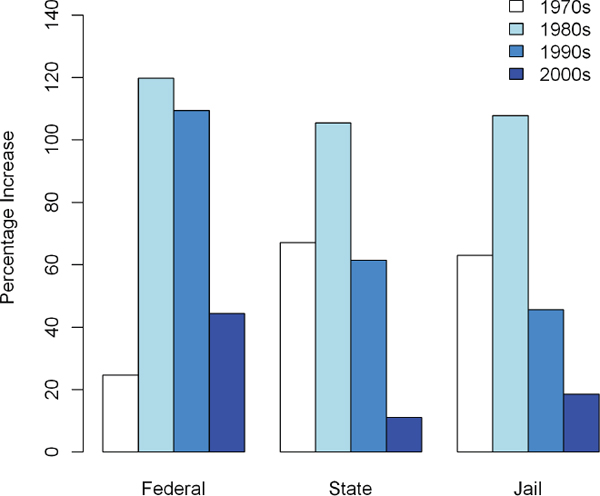
FIGURE 2-3 Percentage growth in federal and state prison populations and the local jail population by decade, 1972 to 2010.
NOTE: Growth is measured as the percentage change from 1972 to 1980, from 1981 to 1990, from 1991 to 2000, and from 2001 to 2010.
SOURCE: See Appendix B.
Figure 2-3 shows the percentage growth in federal and state prison populations and the local jail population over the period of the incarceration boom. In the first decade, 1972 to 1980, the state prison and jail populations each grew by about 60 percent. In the 1980s, the incarcerated population more than doubled in size across all three levels. By 1990, the incarcerated population had increased to more than four times its 1972 level. By 2000, state prison and jail populations were about six times higher than in 1972, and their growth through the 2000s slowed significantly. Beginning from a much smaller base, the federal prison population grew at a much faster rate than the state prison and local jail populations in the 1980s and 1990s. Even in the 2000s, when penal populations in state and local institutions had almost ceased to grow, the population of the federal system increased in size by more than 40 percent from 2001 to 2010.
Trends in the Jail Population
In 2012, one-third of the adult incarcerated population was housed in local jails. Jail is often the gateway to imprisonment. Jails serve local communities and hold those who have been arrested, have refused or been unable to pay bail, and are awaiting trial. They also hold those accused of misdemeanor offenses—often arrested for drug-related offenses or public disorder—and those sentenced to less than a year. John Irwin’s (1970) study of jail describes its occupants as poor, undereducated, unemployed, socially detached, and disreputable. Because of their very low socioeconomic status, jail inhabitants, in Irwin’s language, are “the rabble,” and others have similarly described them as “social trash,” “dregs,” and “riff raff” (Irwin, 1970, pp. 2-3; see also Cornelius, 2012).
The jail population is about one-half the size of the combined state and federal prison population and since the early 1970s has grown about as rapidly as the state prison population. It is concentrated in a relatively small number of large urban counties. The short sentences and pretrial detention of the jail population create a high turnover and vast numbers of admissions. BJS estimates that in 2012, the jail population totaled around 745,000, with about 60 percent of that population turning over each week (Minton, 2013, Table 7; Glaze and Herberman, 2013). In 2010, the nation’s jails admitted around 13 million inmates (Minton, 2011). With such high turnover, the growth of the jail population has greatly expanded the footprint of penal confinement.
The Increasing Scope of Correctional Supervision
The significant increase in the number of people behind bars since 1972 occurred in parallel with the expansion of community corrections. Figure 2-4 shows the scale of the entire adult correctional system. Correctional supervision encompasses prisons and jails and also the community supervision of those on probation and parole. Probation usually supervises people in the community who can, following revocation for breach of conditions, be resentenced to prison or jail. Like the incarcerated population, the probation population increased greatly in absolute terms, from 923,000 in 1976 to 4.06 million in 2010, declining slightly to 3.94 million in 2012. Parole agencies typically supervise people who have served part of their sentence in prison and have been released back to the community, subject to such conditions as reporting to a parole officer, staying drug-free, and maintaining employment. Therefore, parole supervision can be expected to increase as its source, the numbers in prison, grows. From 1975 (the earliest year for which data are available) to 2010, the population under parole
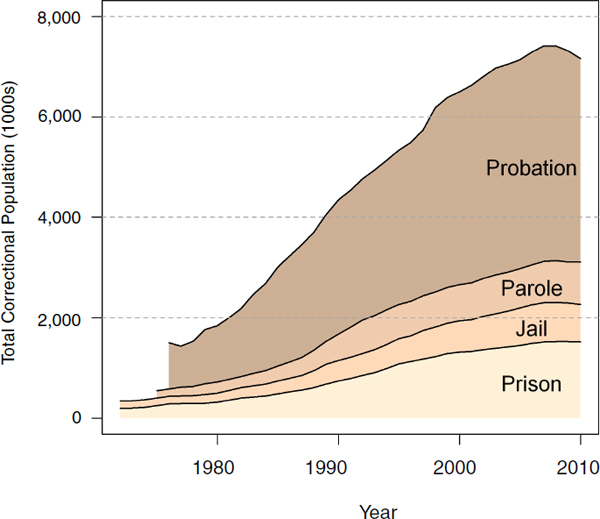
FIGURE 2-4 Total adult correctional population, including state and federal prison, local jail, and probation and parole populations, 1972 to 2010.
SOURCE: See Appendix B.
supervision grew by a factor of six, from 143,000 to 841,000. In 2012, it stood at 851,000.
The large probation and parole populations also expand a significant point of entry into incarceration. If probationers or parolees violate the conditions of their supervision, they risk revocation and subsequent incarceration. In recent decades, an increasing proportion of all state prison admissions have been due to parole violations (Petersilia, 2003, pp. 148ff). As a proportion of all state prison admissions, returning parolees made up about 20 percent in 1980, rising to 30 percent by 1991 and remaining between 30 and 40 percent until 2010. This represents a significant shift in the way the criminal justice system handled criminal offenses, increasing reliance on imprisonment rather than other forms of punishment, supervision, or reintegration. Parole may be revoked for committing a new crime or for violating the conditions of supervision without any new criminal conduct (“technical violators”), or someone on parole may be charged with a new crime and receive a new sentence.
The rising numbers of parole violations contributed to the increase in incarceration rates. The number of parole violators admitted to state prison following new convictions and sentences has remained relatively constant since the early 1990s. The number of technical violators more than doubled from 1990 to 2000. In 2010, the approximately 130,000 people reincarcerated after parole had been revoked for technical violations accounted for about 20 percent of state admissions (Carson and Sabol, 2012, Table 12; Glaze and Bonczar, 2011, Table 7). These returns accounted for 23 percent of all exits from parole that year (Glaze and Bonczar, 2011, Table 7).
The overall correctional population—including probationers and parolees—has grown substantially since 1972. By 2010, slightly more than 7 million U.S. residents, 1 of every 33 adults, were incarcerated in prison or jail or were being supervised on parole or probation. At the end of 2012, the total was 6.94 million, or 1 of every 35 adults. The rise in incarceration rates should thus be understood as just part of a broad expansion of the criminal justice system into the lives of the U.S. population.
Variation in Incarceration Rates Among States
Trends in incarceration rates vary greatly among states. While the national imprisonment rate increased nearly 5-fold from 1972 to 2010, state incarceration rates in Maine and Massachusetts slightly more than doubled. At the other end of the spectrum, the rates in Louisiana and Mississippi increased more than 6-fold.
To see the change in trends, it is useful to divide the period since 1972 into two parts: from 1972 to 2000 and from 2000 to 2010 (see Figure 2-5). As discussed above, the period from 1972 to 2000 was a time of rapid growth for state prison populations; the change in incarceration rates in this period is indicated for each state in blue. The largest increases in this period generally occurred in southern and western states. From 1972 to 2000, incarceration rates grew most in Louisiana, Mississippi, Oklahoma, and Texas. In Louisiana, the rate grew by 700 per 100,000 population—more than 10-fold—rising to 801 per 100,000 by 2000, then climbing further to 867 by 2010. Growth in state incarceration rates was much slower in the northeast and midwest. In Maine and Minnesota, the rates grew by only around 100 per 100,000. These two states had the lowest incarceration rates by 2010—148 for Maine and 185 for Minnesota. In the period since 2000, incarceration rates have grown more slowly across the country. As shown by the red circles in Figure 2-5, a few states have registered very large declines, including Delaware, Georgia, and Texas in the south and New Jersey and New York in the northeast.
The growth in the incarcerated population represents a broad transformation of penal institutions extending across the federal, state, and local
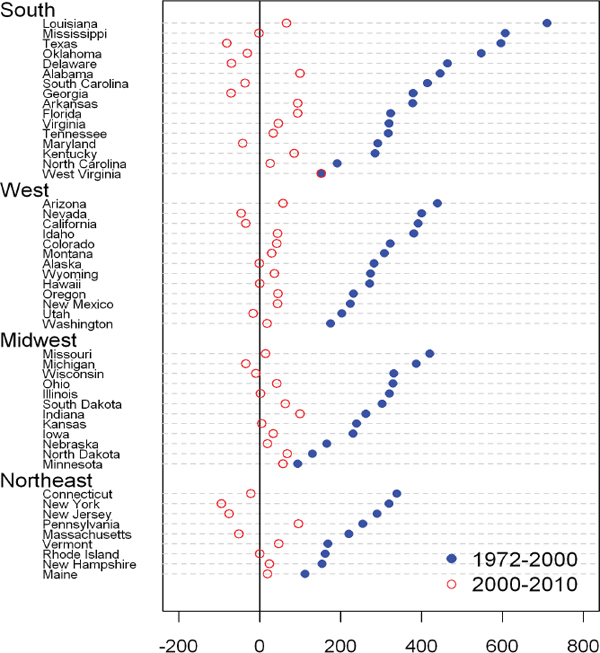
FIGURE 2-5 Change in state imprisonment rates per 100,000 population, 50 states, 1972-2000 and 2000-2010.
SOURCE: See Appendix B.
levels and all regions of the country. Incarceration rates grew most from 1972 to 2000 and in the south and the west. Some evidence indicates a new dynamic emerging over the last decade, as growth in state incarceration rates has slowed significantly across the nation.
CRIME AND THE DYNAMICS OF THE GROWTH OF THE PENAL POPULATION
The link between crime and the growth of the penal population is neither immediate nor direct. Incarceration trends do not simply track trends in crime, although trends in crime have clearly been an important part of the context in which incarceration rates have grown.
Research on the population dynamics of incarceration illuminates the link between incarceration and crime and provides a description of how the system has grown. Analysis of population dynamics offers a simple model in which the growth of incarceration has two main causes: the level of crime in society and the policy response to crime (Raphael and Stoll, 2013). Criminal offending determines the number of people who might be arrested and then serve time in prison, while criminal justice policy determines the likelihood and duration of incarceration for those arrested. As detailed in the following chapter, spreading across the United States and the federal government, the approach to sentencing quickly shifted over the four decades of the incarceration rise. The diffusion of new sentencing policies focused at first on the development of sentencing guidelines and determinate sentencing policies, and more recently included initiatives designed to increase the certainty and severity of prison sentences. In the first phase, primarily from the mid-1970s to the mid-1980s, a wave of reforms aimed to make sentencing procedures fairer and outcomes more predictable and consistent. In the second phase, from the mid-1980s through 1996, changes in sentencing policy were aimed primarily at making sentences for drug and violent crimes harsher and their imposition more certain. The principal mechanisms to these ends were mandatory minimum sentences, “three strikes” laws, laws labeled “truth-in-sentencing,” and laws mandating life without possibility of parole for certain offenses. Since the mid-1990s, no states have created new comprehensive sentencing systems, none has enacted new truth-in-sentencing laws, and only one has enacted a three strikes law. New mandatory minimum sentence laws have been narrowly targeted at such crimes as carjacking, human smuggling, and child pornography.
In the sections that follow, the way these policy changes affected incarceration levels for more than three decades after 1980 is decomposed by stages of the criminal justice process in an effort to quantify, to the extent possible, how the changes in sentencing policy cumulatively contributed to higher levels of incarceration at both the state and federal levels. The analysis, which draws extensively on work by Alfred Blumstein and Allen Beck conducted at the committee’s request, also provides a rough estimate of the extent to which the incarceration increase over the period is attributable to changes in sentencing policy rather than other factors, including changes in crime rates. The following sections decompose the growth in the penal population from 1980 to 2010 into components related to crime, the rate
of arrests per crime, the chances of prison admission per arrest, and the length of time served. Trends in incarceration can be decomposed for specific crime categories and for state and federal prisons separately. (The jail population, about a third of all those incarcerated, has not been analyzed in this way because detailed data on jail admissions are lacking.) Slightly different decompositions have been reported by others (Blumstein and Beck, 1999; Beck and Blumstein, 2012; Raphael and Stoll, 2013; Neal and Armin, 2013). The analyses differ in their details but yield similar results for the three decades since 1980.
In the context of the U.S. prison boom, the main limitation of the decomposition analysis concerns the treatment of drug crimes. Drug crimes (incidents of possession, sale, and manufacture) are not recorded in crime statistics. In any case, the level of drug arrests depends significantly on the level of enforcement efforts. For drug offenses, then, one can see how penal policy has changed, but analysis cannot specify the contribution of drug crime to the drug-related incarceration rate, only to drug arrests. Below we summarize Beck and Blumstein’s (2012) analysis of trends in the state prison population. Their analysis examines trends in crime, arrests admissions, and time served for drug offenses, burglary, aggravated assault, robbery, rape, and murder.
Changes in crime rates affect the numbers of people subject to arrest, conviction, and sentencing and are thus a key source of changes in incarceration rates. A large research literature and several National Research Council reports have investigated crime trends and their measurement (e.g., Lynch and Addington, 2006; National Research Council, 2008). Research has been based largely on the Uniform Crime Reports (UCR) and the National Crime Victimization Survey (NCVS). The UCR, based on police reports and compiled by the Federal Bureau of Investigation (FBI), provide long time series and an accurate count of homicide rates, while the NCVS provides a count of crime victims, measurement of the circumstances of victimization, and a detailed demographic portrait of crime victims. The analysis below is based on the UCR crime rates that can be associated with a parallel series of arrest statistics.4
_________________
4Care must be taken in interpreting historical trends in crime rates; for example, homicide rates are affected by improvements over time in emergency medical treatment that have reduced deaths from violence; and changing treatment of domestic violence affects counting of simple versus aggravated assault. Various so-called “white collar” offenses contribute in small numbers to the prison population. Exact, consistent counts of such crimes, and therefore of their impact on incarceration levels, are hampered by difficulties of definition and measurement (Barnett, 2000; Hagan, 2010; Simpson, 2011).
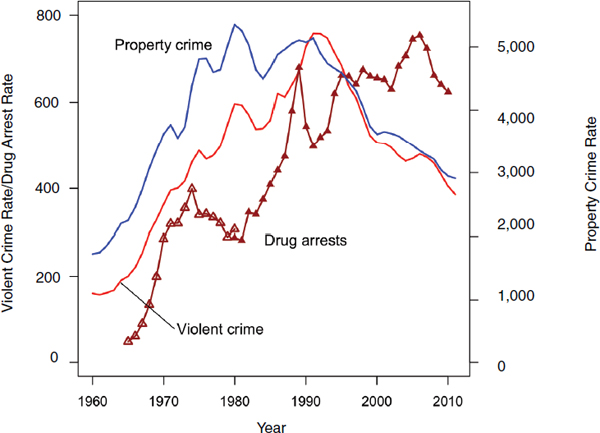
FIGURE 2-6 Violent and property crime rates per 100,000 population, 1960 to 2011, and the drug arrest rate per 100,000, 1980 to 2010.
SOURCES: Uniform Crime Reports. Drug crime rate, 1965-1980; Federal Bureau of Investigation (1993); Maguire (n.d., Table 3.1062.2011, property and violent crime rates); Uniform Crime Reports (drug arrest rates).
Trends in crime measured by the UCR are reported in Figure 2-6. The figure shows trends for three series: for the overall violent crime rate (including assault, murder, rape, and robbery) for 1960 to 2011, the overall property crime rate (including burglary, larceny/theft, and motor vehicle theft) for 1960 to 2011, and the drug arrest rate for 1965 to 2010.
The country experienced a large increase in crime from the early 1960s until the 1980s. From the early 1990s, crime rates began to fall broadly for the following two decades. Property and violent crime show roughly similar trends, although the property crime rate peaked in 1979, while violence continued to rise through the mid-1980s after falling in the first half of the decade. Following the broad trends in crime, the homicide rate—widely thought to be the most accurately measured—began to increase from the 1960s, peaking in 1981. Similar to the property crime rate, the homicide rate fluctuated through the 1980s until peaking again in 1991, just below the 1981 level.
Trends in drug arrests followed a different pattern. The drug arrest rate grew very sharply in the 1980s, more than doubling from 1980 to 1989. After a 2-year decline, the drug arrest rate again increased over the next decade, and by 2010 was more than double its level in 1980.
In summary, the growth in incarceration rates beginning in 1973 was preceded for about a decade by a very large increase in crime rates. Incarceration rates showed their strongest period of growth in the 1980s, as violent crime fell through the first half of the decade and then increased in the second. Incarceration rates continued to climb through the 1990s as the violent crime rate began to fall. Finally, in the 2000s, crime rates have remained stable at a low level, while the incarceration rate peaked in 2007, and the incarcerated population peaked in 2010. Thus the very high rates of incarceration that emerged over the past decades cannot simply be ascribed to a higher level of crime today compared with the early 1970s, when the prison boom began.
Linking Crime to the Trend in Imprisonment
One can think of the size of the prison population as depending on the level of crime, the probability of arrest given a crime, the probability of a prison admission given an arrest, and the time served in prison. If crime increases but all else is unchanged, then the prison population will increase because a larger number of individuals with a fixed probability of apprehension will yield more arrests. Similarly, if the probability of arrest given a crime goes up, then the prison population also will increase, all else being equal. Increases in the chances of prison admission and time served in prison also increase the prison population when all else is unchanged. Each step in the process of incarceration influences the overall trend, which in turn can be decomposed into the contribution of crime, arrest, prison admission, and time served. Here we summarize the analysis of Blumstein and Beck (1999, 2005) and Beck and Blumstein (2012) for state prison populations, looking separately at trends for drug offenses, burglary, aggravated assault, robbery, and murder for the period 1980 to 2010.
The analysis aims to account for the changes in incarceration rates across the different crime categories. The states’ combined incarceration rates increased across all crime categories (see Figure 2-7). Most striking, however, is the dramatic increase in the incarceration rate for drug-related crimes. In 1980, imprisonment for drug offenses was rare, with a combined state incarceration rate of 15 per 100,000 population. By 2010, the drug incarceration rate had increased nearly 10-fold to 143 per 100,000. Indeed, the rate of incarceration for the single category of drug-related offenses, excluding local jails and federal prisons, by itself exceeds by 50 percent
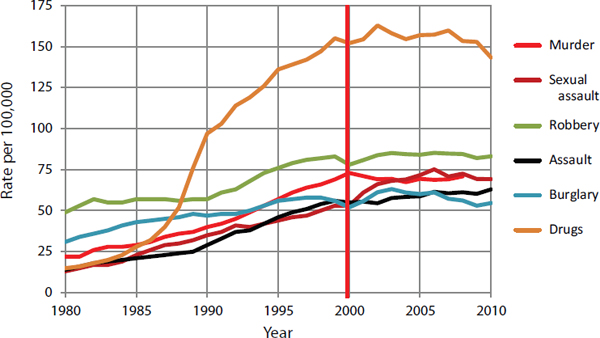
FIGURE 2-7 Combined state incarceration rate by crime type, 1980 to 2010.
SOURCE: Beck and Blumstein (2012).
the average incarceration rate for all crimes of Western European countries and is twice the average incarceration rate for all crimes, including pretrial detainees, of a significant number of European countries.
Trends in Arrests per Crime
The first point at which the criminal justice system can affect the incarceration rate is through the likelihood of arrest of someone who has committed a crime. The ratio of arrests to crimes is sometimes interpreted as a measure of policing effectiveness or efficiency. Despite significant changes in police technology and management from 1980 to 2010, the ratio of arrests to crimes for the major crime types handled by states and localities has shown little change (see Figure 2-8). For example, the arrest rate for burglaries remained at about 14 arrests per 100 adult offenses. Arrest rates for rape declined rather steadily after 1984 (dropping from a peak of 44 arrests per 100 adult offenses to 24 per 100 by 2010). Robbery arrest rates were steady until 2000 and then increased slightly from 26 to 31 arrests per 100 reported offenses by 2010. In contrast, the arrest rate for aggravated assault grew until 2000 and then remained flat (around 52 arrests per 100 offenses). Murder is the exception, showing a decline in the arrest rate per crime after 2000: arrests for murder were close to 100 per 100 adult offenses until 1998 and then declined to 80 per 100 after 2000. Overall,
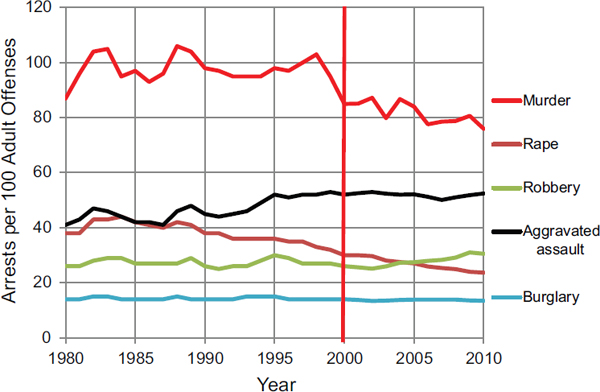
FIGURE 2-8 Arrests per 100 adult offenses by crime type, 1980 to 2010.
SOURCE: Blumstein and Beck (2012).
by the measure of the ratio of arrests to crimes, no increase in policing effectiveness occurred from 1980 to 2010 that might explain higher rates of incarceration.5
A significant shortcoming of the accounting framework applied here is that the analysis cannot describe the probability that drug crimes—chiefly for possession, sale, and manufacture—are converted into arrests. Although data are available on self-reported drug use, there are no national trend data describing the level of felony possession, sale, and manufacture offenses. This absence of data also reflects a conceptual limitation in that drug crimes typically are not discrete events like most other crimes but part of a continuous pattern of drug use and dealing. The underlying level of crime that provides the basis for arrest is not only difficult to measure but also difficult to define.
Despite these conceptual difficulties, it is clear that drug law enforcement efforts escalated substantially over the period of the prison boom. From 1980 to 1989, the arrest rate for possession and use offenses increased by 89 percent. After a 2-year period of decline, the drug arrest rate
_________________
5At the federal level, the increase in incarceration has been closely correlated with the increase in numbers of convictions.
climbed again to peak in 2006, 162 percent above the 1980 level. The arrest rate fell slightly from this peak, but in 2009 was still more than double the rate in 1980. In 2009, 1.3 million arrests were reported to the UCR for drug use and possession, and another 310,000 arrests were made for the manufacture and sale of drugs (Snyder, 2011).
To foreshadow our later discussion of racial disparity, drug arrest rates, at least since the early 1970s, have always been higher for African Americans than for whites. In the early 1970s, when drug arrest rates were low, blacks were about twice as likely as whites to be arrested for drug crimes. The great growth in drug arrests through the 1980s had a large and disproportionate effect on African Americans. By 1989, arrest rates for blacks had climbed to 1,460 per 100,000, compared with 365 for whites (Western, 2006). Throughout the 1990s, drug arrest rates remained at historically high levels. It might be hypothesized that blacks may be arrested at higher rates for drug crimes because they use drugs at higher rates, but the best available evidence refutes that hypothesis. A long historical trend, dating back to the 1970s, is available from the Monitoring the Future survey of high school seniors. Self-reported drug use among blacks is consistently lower than among whites, a pattern replicated among adults in the National Survey on Drug Abuse. Fewer data are available on drug selling, but self-reports in the National Longitudinal Survey of Youth, 1979 and 1997, show a higher level of sales among poor white than poor black youth. In short, the great escalation in drug enforcement that dates from the late 1970s is associated with an increase in the relative arrest rate among African Americans that is unrelated to relative rates of drug use and the limited available evidence on drug dealing.
Prison Admissions per Arrest
A second point of criminal justice intervention is the sentencing of those who have been arrested, charged, and convicted. Because national trend data are not readily available for charging and conviction, analysis of imprisonment population dynamics has examined the probability of prison admission given an arrest (Blumstein and Beck, 1999, 2005; Beck and Blumstein, 2012; Raphael and Stoll, 2013). For the major crime types handled at the state level, the probability that arrest would lead to prison rose over the three decades from 1980 to 2010. The number of prison commitments per 100 adult arrests showed a significant and nearly steady increase (see Figure 2-9). For example, the rate of commitment to state prison for murder rose from 41 to 92 per 100 arrests, an increase of more than 120 percent. The percentage changes for three other categories of
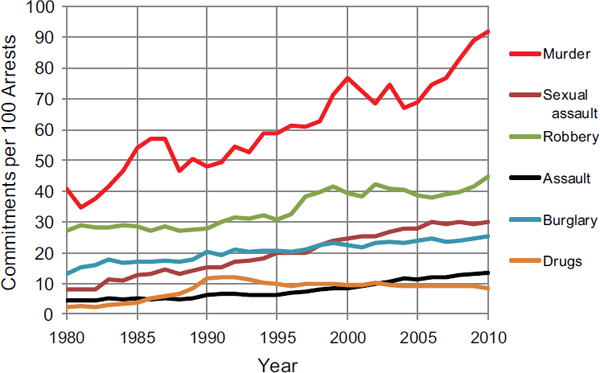
FIGURE 2-9 State prison admissions per 100 adult arrests, 1980-2010.
NOTE: Commitments include only new court commitments (which include new offenders and parole violators with new sentences only).
SOURCE: Beck and Blumstein (2012).
offenses—sexual assault,6 aggravated assault, and drug crimes—were well over 200 percent; however, those changes were less dramatic because the rates for these offenses started from such low levels. Between 1980 and 2010, prison commitments for drug offenses rose 350 percent (from 2 to 9 per 100 arrests); commitments for sexual assault rose 275 percent (from 8 to 30 per 100 arrests); and commitments for aggravated assault rose 250 percent (from 4 to 14 per 100 arrests). State prison commitment rates for burglary and robbery also increased, but these increases were below 100 percent. These figures indicate that an increased probability that arrest would lead to prison commitment contributed greatly to the rise in incarceration rates between 1980 and 2010.
_________________
6Estimates for rape and other sexual assaults were combined because of difficulties in distinguishing rape from other sexual assaults in administrative data collected in BJS’s National Corrections Program.
Time Served
The final component of assessing the contribution of changes in criminal justice policy to the rise in incarceration rates is the duration of incarceration for those given prison sentences. Time served must be estimated because it is not completely observed: the duration of incarceration is not known for those who have not been released. One could calculate time served from a cohort of releases, but this method would overrepresent those serving short sentences and underrepresent those serving long sentences. At the limit, those serving life without parole will never be released, and time served will be known only at their death. Calculating time served from release cohorts will thus underestimate the average. Blumstein and Beck (1999; Beck and Blumstein, 2012) base estimates of time served on the ratio of the stock population—the number of people in prison on the day of the annual population count—to new court commitments in that year. If commitment rates were reasonably constant over time, that estimate of time served would be reasonably accurate. But admission rates, of course, have not been stationary and were increasing, especially during the 1980s and 1990s, which introduces error in the time-served estimates. To reduce that error, the admission process is smoothed by being approximated in each year as the 3-year average of the number of new court commitments in that year and the 2 adjoining years.7
Given that sentence lengths for serious crimes have increased greatly since 1980, the full impact of lengthy sentences on the level of incarceration has yet to be felt. The contribution of long sentences to rising incarceration rates can be fully observed only over a very long period. Without a sufficient observation period for lengthy sentences, average sentence lengths will also be underestimated. Very long sentences have increased in number since the proliferation of enhancements for those convicted of second and third felonies, the institution of truth-in-sentencing requirements, and other shifts in sentencing policy discussed in greater detail in Chapter 3. BJS’s analysis of recent trends in the state prison population reveals the growing population serving life and other long sentences. As of the end of 2000, BJS estimated that about 54,000 state prison inmates were serving life sentences, with a median age of under 30. Using a different methodology, a 2013
_________________
7Estimates for 1980 and 2010 are omitted because one of their adjoining years is not available for the three-point smoothing. This estimation model (the ratio of stock population to new court commitments) is based on all new court commitments, including those parole violators arriving with a new sentence, but not counting technical parole violators. This approach contrasts with other measures based on using the number of exits in each year rather than new court commitments. (See Patterson and Preston, 2008.) Counting exit flow would count parolees only on the most recent increment of their total time served and would not take account of the earlier time served, prior to readmission on a parole violation. Thus, it would underestimate the total time served on the original sentence.
survey report by the Sentencing Project estimates that more than 150,000 people were serving life sentences in state prison in 2012 (Nellis, 2013).8 Because of nonstationarity in admission rates and the growing prevalence of very long sentences, the estimates of time served presented below should be viewed as a lower bound on the increase in time served. The downward bias is likely to be largest for violent crimes, for which the growth in very long sentences has been greatest.
The most dramatic change in average time served was for murder, which climbed from 5.0 years in 1981 to 16.9 years in 2000, an increase of 238 percent. The second largest growth was in time served for sexual assault, which increased 94 percent, from 3.4 years in 1981 to 6.6 years in 2009; the rate of increase for this crime type was the largest observed during the 2000-2010 decade, adding about 2.5 months each year. The slowest rate of increase in time served was for drug offenses, increasing from 1.6 years in 1981 to 1.9 years in 2000 and then remaining nearly steady through 2009. The stability of time served by those committing drug offenses contrasts with the significant growth in rates of arrest and commitment for drug offenses discussed earlier. Time served may have changed little because short prison sentences were imposed on those committing drug offenses who may previously have served probation or time in jail. Trends in time served for the other three crime types—aggravated assault, burglary, and robbery—showed somewhat similar growth patterns. Averaging 4.0, 2.8, and 2.0 years, respectively, over the entire 1980-2010 period, all had some growth from 1980 to 2000 (83, 41, and 79 percent, respectively), and all remained nearly stable after 2000 (see Figure 2-10).
The decomposition of the growth in incarceration rates is summarized in Table 2-1. From 1980 to 2010, the state imprisonment rate for six main crime types grew by 222 percent. Setting aside drug-related incarceration, for which offending rates are difficult to define and measure, changes in crime trends or in police effectiveness as measured by arrests per crime contributed virtually nothing to the increase in incarceration rates over the 30-year period. Rather, the growth can be attributed about equally to the two policy factors of prison commitments per arrest and increases in time served. These results are based on consideration of changes in all six crime types. Because the response to drug-related crimes is so distinctive and significant, Beck and Blumstein (2012) examined the other five crime
_________________
8This number should be viewed as an approximation. The estimate was obtained by surveying state and federal prison authorities. It is unclear whether the count of prisoners serving life sentences includes those in custody or under jurisdiction. Custody and jurisdiction definitions typically yield slightly different counts of prison populations. In 2012, the same survey estimated that another 5,420 people were serving life sentences in federal prisons.
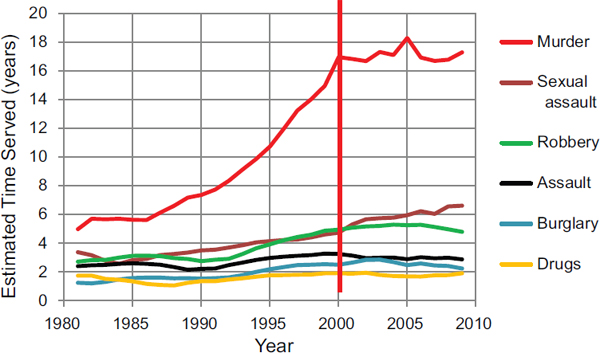
FIGURE 2-10 Estimated time served in state prison, 1980 to 2010.
NOTE: See text for a discussion of calculations of time served.
SOURCE: Beck and Blumstein (2012).
types omitting drug offenses and found similar results, albeit with a slightly greater contribution from time served.
When each decade is examined separately, different factors are found to contribute to the growth in incarceration rates. The first decade, 1980-1990, saw the largest increase in the state incarceration rate (107 percent). The largest share of this growth is attributable to changes in commitments per arrest, which accounted for 79 percent of the growth in the six-offense analysis and 50 percent when drug offenses were excluded. The time-served effect was fairly small (14 percent) when drug crimes were included but more than doubled (38 percent) when they were omitted. The significant growth in enforcement for drug-related offenses in the 1980s thus is associated with a large increase in prison admissions, but those convicted of drug offenses were serving relatively short sentences.
During the second decade, the 1990s, when the state incarceration rate grew by 55 percent (from a much-enlarged base compared with 1980), considerable attention was paid to increasing sentences, and especially time served, through various legislative actions, such as truth-in-sentencing. This is shown by the fact that in the 1990s, time served replaced imprisonments per arrest as the leading factor in growth in incarceration rates, accounting for 74 percent of the growth for all six crimes and 62 percent when drug crimes are excluded. The final decade, 2000-2010, was a period of
TABLE 2-1 Decomposing the Growth in State Imprisonment Rates, 1980-2010
| Three Decades | ||||
| Entire Period 1980-2010 (%) | 1980-1990 | 1990-2000 | 2000-2010 | |
| Change to Be Explained (%) | 222 | 107 | 55 | 1 |
| All Six Offenses | ||||
| Crime trends | — | — | — | — |
| Arrests per crime | — | 7 | — | — |
| Imprisonments per arrest | 49 | 79 | 27 | 100 |
| Time served | 51 | 14 | 73 | — |
| Five Offenses, Excluding Drug Crimes | ||||
| Crime trends | — | 3 | — | — |
| Arrests per crime | — | 10 | <1 | — |
| Imprisonments per arrest | 44 | 50 | 38 | 96 |
| Time served | 56 | 38 | 62 | 4 |
SOURCE: Beck and Blumstein (2012).
negligible growth (0.65 percent) in the overall incarceration rate in state prisons, and whatever growth occurred is attributable almost entirely to increases in imprisonments per arrest.
Trends in the Federal System
Growth in the incarceration rate has been larger and more sustained in the federal system than in the states. Between 1980 and 2000, the federal prison population increased by nearly 500 percent, from 24,363 to 145,416, surpassing the growth in state prison systems. By 2000, the federal system was the third largest prison system in the nation, behind those of Texas and California. Moreover, while the rapid growth of the states’ prison populations tapered off after 2000, the federal system continued to see a steady increase, becoming the largest system by midyear 2002. By 2010, the federal system, with a population of 209,771 inmates, had grown to be larger than the next largest system, the Texas Department of Criminal Justice, by more than 36,000 inmates (Guerino et al., 2011). The federal system thus accounts for roughly 10 percent of the total prison population, but its share has been growing during the prison boom.
Nearly all incarceration in federal prisons is due to federal convictions for robbery; fraud; and drug, weapon, and immigration offenses.9 During 1980-2000, as with the states, the most dramatic change was in drug-related offending, for which the incarceration rate increased more than 10-fold, from 3 per 100,000 in 1980 to 35 in 2000. The other two crime types that saw comparably large growth are weapon and immigration offenses, which also increased more than 1,000 percent; that growth is less apparent because incarceration rates for these offenses started at such low levels in 1980. The incarceration rate for fraud grew considerably (about 227 percent) over this period, but still much less than the rates for the other three crime types. The incarceration rate for robbery rose steadily from 2.9 per 100,000 adults and then peaked at 4.6 per 100,000 in 2000.
Since 2000, the patterns of growth in incarceration rates have changed.10 With an already high rate of incarceration for drug offenses (35 per 100,000 adults), the increase for these offenses was more modest, up 16 percent (to 41 per 100,000 adults). At the same time, the dominant source of growth was weapon offenses, up 135 percent (from 5.2 to 12.2 per 100,000 adults) and immigration offenses, up 40 percent (from 6.5 to 9.1 per 100,000 adults). Fraud showed little change (up 5.5 percent), while robbery declined (from 4.6 to 3.2 per 100,000).
RACIAL DISPARITY IN IMPRISONMENT
The discussion thus far has examined the growth in incarceration rates, linking it to trends in crime, arrests, prison admissions, and time served. The data point clearly to the increased rate of prison admission (particularly marked for drug crimes) and the increase in time served (especially for violent offenses) as sources of increased incarceration rates.
A parallel set of questions about the relative contributions of crime and the criminal justice system has been raised in the analysis of racial disparities in incarceration. As noted earlier, the rise in incarceration rates has had a disproportionately large effect on African Americans and Latinos. Having higher rates of poverty and urbanization and a younger age distribution, minority populations—at least for some categories of offenses—also show higher rates of offending and victimization. As incarceration rates were increasing, how much of the evolving racial and ethnic disparity in those
_________________
9Note that BJS’s federal justice statistics program includes all sentenced federal prisoners, regardless of sentence length; moreover, all counts are based on fiscal years, ending September 30 of each reference year.
10The Urban Institute recently completed a report examining growth in incarceration rates from 1998 to 2010, using a similar approach but applying it to estimates of growth in numbers of inmates by crime type rather than growth in incarceration rates by crime type (see Mallik-Kane et al., 2012).
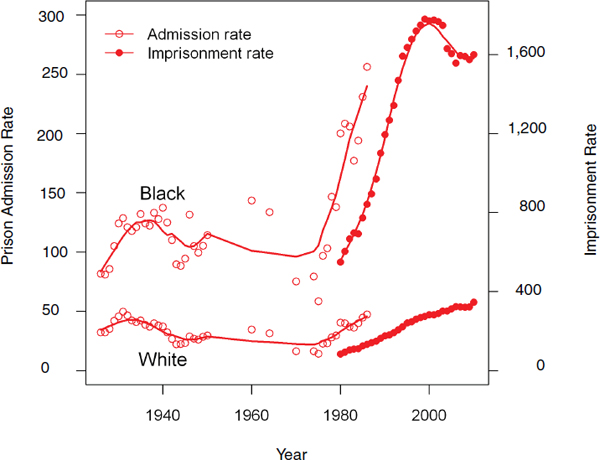
FIGURE 2-11 State and federal prison admission rates, 1926 to 1986, and state and federal imprisonment rates, 1980 to 2010, for blacks and whites.
NOTES: A smooth line indicates the trend. Hispanics are included among both racial groups.
SOURCES: Admissions rates are from Langan (1991b). Black and white imprisonment rates are from Beck and Blumstein (2012).
rates can be explained by racial and ethnic differences in offending? This question, of course, is not just of descriptive interest; it is central to understanding the social significance of the emergence of high incarceration rates. The sources of racial and ethnic disparities in incarceration are discussed in Chapter 3.
Trends in black and white imprisonment are shown in Figure 2-11.11 BJS compiled state and federal prison admission rates for blacks and whites separately in a historical series extending from 1926 to 1986 (Langan, 1991b). The data are available annually from 1926 to 1946 and then intermittently for the post-World War II period until 1986. They show an
_________________
11Trends in imprisonment for Hispanics are discussed in a later section of this chapter. Note that Hispanics are not counted separately and are therefore included in the numbers for blacks and whites presented here.
increase in African American imprisonment from 1926 to 1940, while imprisonment rates were declining for whites. Prison admission rates climbed steeply in the mid-1970s but much more in absolute terms for African Americans than for whites.
The disparity in incarceration can be measured in both absolute and relative terms. The absolute disparity is measured by the difference between black and white incarceration rates, while the relative disparity is measured by the black-white ratio in incarceration rates. Table 2-2 shows the trend in absolute and relative disparity for imprisonment and admission rates for selected years from 1970 to 2010. Through the 1970s and 1980s, racial disparities increased in both absolute and relative terms. The increase in absolute disparities is especially striking, growing more than 3-fold from 1970 to 1986 for prison admission rates and more than doubling from 1980 to 1990 for imprisonment rates. The large increase in absolute disparities reflects the extraordinarily high rates of incarceration among African Americans that emerged with the overall growth of the incarceration rate. From 1990 onward, the white incarceration rate increased more rapidly than the incarceration rate for blacks, and the relative disparity declined. Still, the absolute disparity increased significantly in the 1990s as black incarceration rates continued to grow, and serving time in state or federal prison became commonplace for young African American men in poor communities.
Because of the large disparity—which was already high in 1972—the steep increase in incarceration rates produced extremely high rates of incarceration for blacks but not whites. In 2010, the imprisonment rate for blacks was 4.6 times that for whites—the lowest disparity in imprisonment
TABLE 2-2 Absolute and Relative Racial Disparities in Rates of Prison Admission and Imprisonment, 1970 to 2010
| Disparity | ||
| Absolute | Relative | |
| Prison Admission Rates | ||
| 1970 | 58.7 | 4.6 |
| 1986 | 208.9 | 5.4 |
| 1970 | 58.7 | 4.6 |
|
Imprisonment Rates |
||
| 1980 | 465 | 6.5 |
| 1990 | 1,018 | 6.8 |
| 2000 | 1,487 | 6.3 |
| 2010 | 1,252 | 4.6 |
SOURCES: Admission rates are from Langan (1991b). Black and white imprisonment rates are from Beck and Blumstein (2012).
over the entire period for which race-specific incarceration rates are available. Although the disparity had declined from its peak in the early 1990s, it was still very large—of a magnitude that exceeds racial differences for many other common social indicators. For example, black-white ratios for indicators as varied as wealth, employment, poverty, and infant mortality are significantly smaller than the 4.6 to 1 ratio in imprisonment (Beck and Blumstein, 2012; Western, 2006).
The relative involvement of blacks in violent crimes has declined significantly since the late 1980s (see Figure 2-12). From 1972 to 1980, the relative share of blacks in arrests for rape and aggravated assault fell by around one-fourth; more modest declines in their share of arrests were recorded for murder and robbery from the 1970s to the 2000s. In the 1970s, blacks
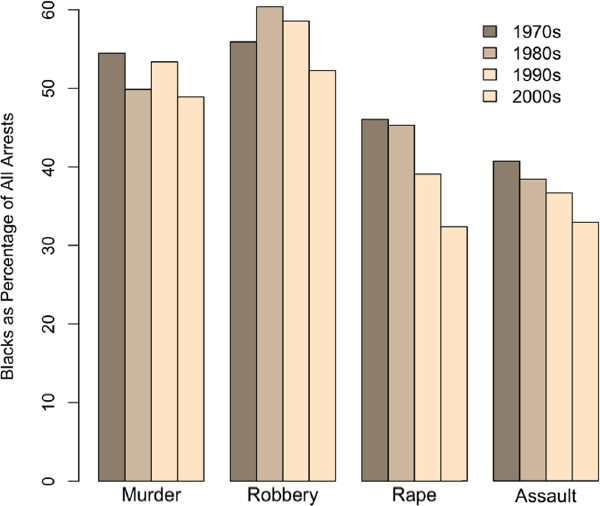
FIGURE 2-12 Average percentage of blacks among total arrests for murder and non-negligent manslaughter, robbery, forcible rape, and aggravated assault, by decade, 1972 to 2011.
SOURCE: Uniform Crime Reports race-specific arrest rates, 1972 to 2011.
accounted for about 54 percent of all homicide arrests; by the 2000s, that share had fallen below half. For robbery, blacks accounted for 55 percent of arrests in the 1970s, falling to 52 percent by the 2000s. For rape, blacks accounted for about 46 percent of all arrests in the 1970s, declining by 14 percentage points to 32 percent by the 2000s. The declining share of blacks in violent arrests also is marked for aggravated assaults, which constitute a large majority of violent serious crimes: 41 percent in the 1970s and just 33 percent in the 2000s.
These figures show that arrests of blacks for violent crimes constitute smaller percentages of absolute national numbers that are less than half what they were 20 or 30 years ago (Tonry and Melewski, 2008). Violent crime has been falling in the United States since 1991. In absolute terms, involvement of blacks in violent crime has followed the general pattern; in relative terms, it has fallen substantially more than the overall averages. Yet even though participation of blacks in serious violent crimes has declined significantly, disparities in imprisonment between blacks and whites have not fallen by much; as noted earlier, the incarceration rate for non-Hispanic black males remains seven times that of non-Hispanic whites.
The situation for drug offenses is similar to that for violent crime in some respects, but there is a critical difference. Although, according to both arrest and victimization data, blacks have higher rates of involvement than whites in violent crimes, the prevalence of drug use is only slightly higher among blacks than whites for some illicit drugs and slightly lower for others; the difference is not substantial. There is also little evidence, when all drug types are considered, that blacks sell drugs more often than whites (Tonry, 2011a, Chapter 3).
In recent years, drug-related arrest rates for blacks have been three to four times higher than those for whites (see Figure 2-13). In the late 1980s, the rates were six times higher for blacks than for whites (Blumstein and Wallman, 2006). The recent relative decrease in racial disparity in drug arrests did not result from reduced police emphasis on black sellers but from increases in total drug arrests and greater emphasis on crimes related to marijuana. Marijuana arrestees are preponderantly white and are much less likely than heroin and cocaine arrestees to wind up in prison (Room et al., 2013). Absolute numbers of blacks arrested for trafficking in cocaine and heroin have not fallen significantly; they simply make up a smaller percentage of overall arrest numbers that are rising.
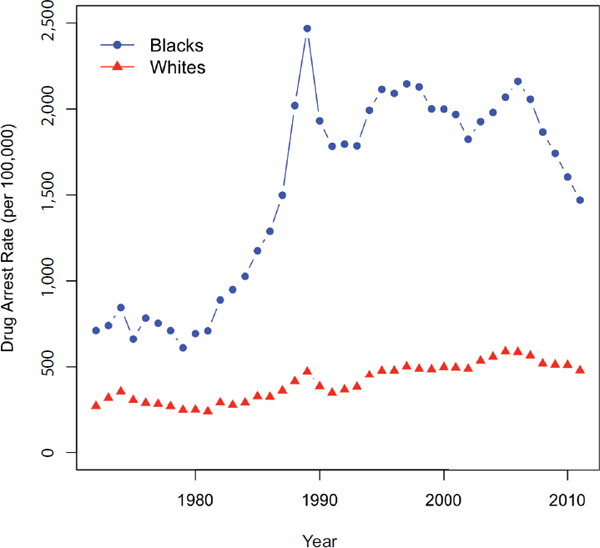
FIGURE 2-13 Drug arrest rates for blacks and whites per 100,000 population, 1972 to 2011.
SOURCES: Uniform Crime Reports race-specific arrest rates, 1980 to 2011 (accessed from BJS). 1972 to 1979 is taken from Federal Bureau of Investigation (1990).
In the discussion of black and white incarceration rates thus far, Hispanics have been included in those two racial groups. Distinguishing incarceration rates for Hispanics helps underline ethnicity as another source of disparity. Separating Hispanics from non-Hispanics also modifies understanding of the racial disparity in incarceration rates between non-Hispanic blacks and whites. In 1974, only 12 percent of the white state prison population and a negligible proportion of blacks reported being of Hispanic origin. By 2004, 24 percent of the white prison population and around 3 percent of blacks reported being Hispanic.
As the white prison population has come to include more Hispanics, the raw black-white disparity in incarceration has tended to shrink because of the relatively high incarceration rate among Hispanics. An alternative approach that separates race and ethnicity entails studying incarceration among Hispanics and non-Hispanic blacks and whites. Most published data on incarceration trends distinguish racial groups but not ethnicities. The data reviewed earlier on prison admission and imprisonment rates by race were taken from the National Prisoner Statistics (NPS) Series, an annual survey of state and federal departments of correction conducted by BJS. The NPS survey was first administered in 1926 and has gathered counts of the prison populations by race and sex. Data on Hispanics have been collected since 1974 in the BJS Survey of Inmates of State Correctional Facilities and since 1972 in the Survey of Inmates in Local Jails. Data also are available from the decennial census, which collects information on the entire U.S. population, including information on national origins and, for immigrants, country of birth. By combining NPS counts with survey data, BJS has constructed state and federal imprisonment rates for Hispanics since 2000, and rates can be constructed back to 1990 using the BJS methods (Guerino et al., 2011; Beck and Blumstein, 2012). With additional assumptions about the Hispanic fraction of the federal prison population (which is never more than about 10 percent of the total prison population), estimates of the prison and jail incarceration rates for Hispanics, non-Hispanic whites, and non-Hispanic blacks can be constructed for the entire period of the growth in incarceration from 1972 to 2010 (see Appendix B).
Figure 2-14 reports incarceration rates separately for Hispanics, non-Hispanic whites, and non-Hispanic blacks aged 18 to 64. These age-specific incarceration rates account usefully for differences in the age distribution among the three race-ethnicity groups, adjusting for the relative youth of the black and Hispanic populations. The series before 1990 are represented by dashed lines indicating estimates based on 1991 surveys of federal prisoners.
Hispanic incarceration rates fall between the rates for non-Hispanic blacks and whites. Over the period of the growth in incarceration rates, the rate has been two to three times higher for Hispanics than for non-Hispanic whites. From 1972 to 1990, the Hispanic rate grew strongly along with incarceration in the rest of the population. Through the 1990s, the Hispanic rate remained roughly flat at around 1,800 per 100,000 of the population aged 18 to 64. Since 2000, the incarceration rate for Hispanics has fallen from 1,820 to just under 1,500.
The Hispanic population itself is heterogeneous, including U.S. citizens and noncitizens and a large number of different national origins. Ruben Rumbaut has explored variation in incarceration within the Hispanic population, relying mainly on census data and survey data on the immigrant
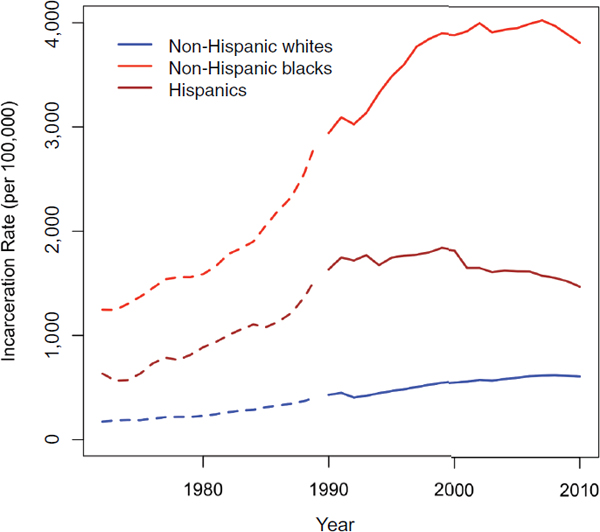
FIGURE 2-14 Prison and jail incarceration rates per 100,000 population for non-Hispanic whites, non-Hispanic blacks, and Hispanics, aged 18 to 64, 1972 to 2010.
SOURCE: See Appendix B in this report.
population (Rumbaut and Ewing, 2007; Rumbaut, 2009). Rumbaut finds that incarceration rates (and arrest rates) for the immigrant population are relatively low given their poverty rates and education. The highest incarceration rates are found among long-standing national groups—Puerto Ricans and Cubans. For national groups with large shares of recent immigrants—Guatemalans and Salvadorans for example—incarceration rates are very low. The largest national group, Mexicans, includes significant native-born and foreign-born populations. The incarceration rate indicated in the 2000 census is more than five times higher for native-born U.S. citizens of Mexican descent than for U.S. immigrants born in Mexico. In fact, U.S.-born Mexicans have higher incarceration rates than any other U.S.-born Hispanic group (Rumbaut, 2009). Overall, the incarceration rate for those of Mexican origin is lower than that for either Puerto Ricans or Cubans.
This discussion of incarceration of Hispanics has been limited to those in prisons or local jails, and does not encompass immigrant detention outside of those institutions. There is evidence that the latter form of detention has increased significantly in the past decade in specialized immigrant detention facilities (Dingeman and Rumbaut, 2010; Meissner et al., 2013; National Research Council, 2011, Chapter 4), but this type of incarceration lies beyond the committee’s charge.
CONCENTRATION OF INCARCERATION BY AGE, SEX, RACE/ETHNICITY, AND EDUCATION
Although racial and ethnic disparities in incarceration are very large, differences by age, sex, and education are even larger. The combined effects of racial and education disparities have produced extraordinarily high incarceration rates among young minority men with little schooling. The age and gender composition of the incarcerated population has changed since the early 1970s, but the broader demographic significance of the penal system lies in the very high rate of incarceration among prime-age men. The prison population also has aged as time served in prison has increased, but 60 percent of all prisoners still were under age 40 in 2011 (Sykes, 2013).
Incarceration rates have increased more rapidly for females than for males since the early 1970s. In 1972, the prison and jail incarceration rate for men was estimated to be 24 times higher than that for women. By 2010, men’s incarceration rate was about 11 times higher. Women’s incarceration rate had thus risen twice as rapidly as men’s in the period of growing incarceration rates. Yet despite the rapid growth in women’s incarceration, only 7 percent of all sentenced state and federal prisoners were female by 2011 (Carson and Sabol, 2012, Table 5). In comparison, 13 percent of local jail populations were women by that year (Maguire, n.d., Table 7.17.2011). The racial disparity in incarceration for women is similar to that seen for men. As with the trends for men, the very high rate of incarceration for African American women fell relative to the rate for white women, although the 3 to 1 black-white disparity in women’s imprisonment in 2009 was still substantial (Mauer, 2013).
Figure 2-15 shows estimates of prison and jail incarceration rates for male non-Hispanic whites, non-Hispanic blacks, and Hispanics aged 20 to 39 in 1972 and in 2010. For these series, we used survey data to calculate incarceration by different levels of schooling; we also used information on self-reported ethnicity in surveys dating from the early 1970s to separate Hispanics from non-Hispanic blacks and whites (see Appendix B). For each racial and ethnic group, the incarceration rate is shown for those with at least some college education, for those with no college education (including high school graduates and high school dropouts), and for those who had not
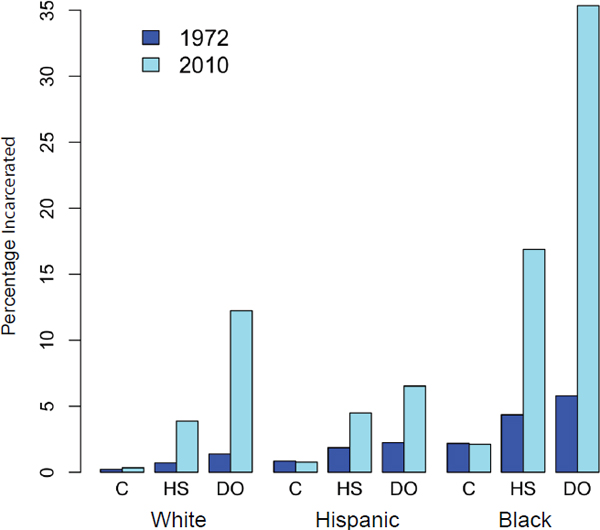
FIGURE 2-15 Prison and jail incarceration rates for men aged 20-39 by education and race/ethnicity, 1972 and 2010.
NOTES: C = at least some college; HS = all noncollege men; DO = less than 12 years of completed schooling.
SOURCE: See Appendix B in this report.
completed high school or received a general equivalency diploma (GED). From 1972 to 2010, the U.S. population’s educational attainment, including levels of college attendance, increased. In particular, high school dropout rates declined substantially over this period, so the high school dropouts of 2010 are likely to be a narrower and certainly more educationally disadvantaged population than those who dropped out in 1972. Still, the proportions of college attendees and those with no college education in the population remained more stable than the proportion of high school dropouts over this period.
Extremely high incarceration rates had emerged among prime-age noncollege men by 2010 (see Figure 2-15). Around 4 percent of noncollege white men and a similar proportion of noncollege Hispanic men in this age group were incarcerated in 2010. The education gradient is especially
significant for African Americans. Among prime-age black men, around 15 percent of those with no college and fully a third of high school dropouts were incarcerated on an average day in 2010. Thus at the height of the prison boom in 2010, the incarceration rate for all African Americans is estimated to be 1,300 per 100,000. For black men under age 40 who had dropped out of high school, the incarceration rate is estimated to be more than 25 times higher, at 35,000 per 100,000.
Educational inequalities in incarceration rates have increased since 1972 (see Figure 2-15). Incarceration rates have barely increased among those who have attended college; nearly all the growth in incarceration is concentrated among those with no college education. Some may argue that the rise in incarceration rates is related to increased selectivity, as the noncollege group shrank as a fraction of the population. The noncollege group may have been less able to work and more prone to crime in 2010 compared with 1972. Still, any such selection effect may have been somewhat offset by rising educational attainment in the noncollege population. Higher rates of high school graduation increased the schooling of those without college, perhaps negating the criminal propensity of the low-educated population. Although it is difficult to say precisely how much of the rising educational inequality in incarceration is due to shifts in selectivity, the statistics clearly show that prison time has become common for men with little schooling.
Educational disparities also shed light on the relatively high level of incarceration among Hispanics. Hispanics are incarcerated at a lower rate than non-Hispanic whites at every level of education. Because Hispanics—and new immigrants in particular—tend to have very low levels of education, there are relatively more Hispanics than whites in the high incarceration group of those with less than a high school education.
The statistics discussed above are for incarceration rates at a single point in time. BJS developed estimates of the lifetime probabilities of imprisonment for men and women in different racial and ethnic groups (Bonczar and Beck, 1997; Bonczar, 2003). Those estimates assume a stable underlying rate of prison admission for all the birth cohorts in prison at a given time. Pettit and Western (2004; Western, 2006; Western and Wildeman, 2009; Pettit, 2012) developed this work further, estimating cumulative risks of imprisonment for men and women in different birth cohorts and at different levels of education. These estimates show how the experience of imprisonment has become more prevalent for successive cohorts as the incarceration rate has risen.
It is instructive to compare the risks of imprisonment by age 30-35 for men in two birth cohorts: the first born in 1945-1949, just before the great increase in incarceration rates, and the second born in the late 1970s, growing up through the period of high incarceration rates (see Figure 2-16). Because most of those who go to prison do so for the first time before
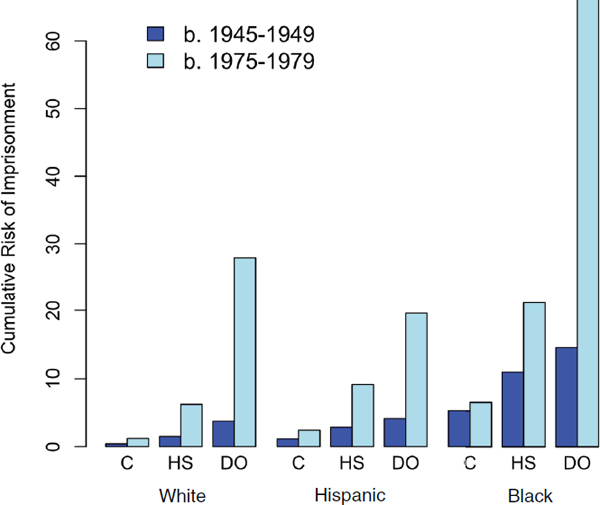
FIGURE 2-16 Cumulative risks of imprisonment by 1979 for men born in 1945-1949 and by 2009 for men born in 1975-1979, by race and education.
NOTES: C = at least some college; HS = completed high school or general equivalency diploma (GED); DO = no high school diploma or GED.
SOURCE: Data from Pettit et al. (2009, Table 37).
age 30 to 35, these cumulative proportions can be interpreted roughly as lifetime risks of going to prison. Education, for these cumulative risks, is recorded in three categories: for those who attended at least some college, for high school graduates or GED earners, and for those who did not complete high school.
Similar to the increases in incarceration rates, cumulative risks of imprisonment have increased substantially for all men with no college education and to extraordinary absolute levels for men who did not complete high school. The prison system was not a prominent presence in the lives of white men born just after World War II. Among high school dropouts, only 4 percent had been to prison by their mid-30s. The lifetime risk of imprisonment was about the same for Hispanic high school dropouts at that time. For African American men who dropped out of high school and reached their mid-30s at the end of the 1970s, the lifetime risk of imprisonment was about 3 times higher, at 15 percent.
The younger cohort growing up through the prison boom and reaching their mid-30s in 2009 faced a significantly elevated risk of imprisonment. Similar to the rise in incarceration rates, most of the growth in lifetime risk of imprisonment was concentrated among men who had not been to college. Imprisonment risk reached extraordinary levels among high school dropouts. Among recent cohorts of African American men, 68 percent of those who dropped out of school served time in state or federal prison. For these men with very little schooling, serving time in state or federal prison had become a normal life event. Although imprisonment was less pervasive among low-educated whites and Hispanic men, the figures are still striking. Among recent cohorts of male dropouts, 28 percent of whites and 20 percent of Hispanics had a prison record by the peak of the prison boom.
In sum, trends in these disaggregated rates of incarceration show that not only did incarceration climb to historically high levels, but also its growth was concentrated among prime-age men with little schooling, particularly low-educated black and Hispanic men. For this segment of the population, acutely disadvantaged to begin with, serving time in prison had become commonplace.
This chapter has painted a broad statistical portrait of the trends in incarceration since 1972, the beginning of the U.S. prison boom. After a lengthy period of stability in incarceration rates, the penal system began a sustained period of growth beginning in 1973 and continuing for the next 40 years. U.S. incarceration rates are historically high, and currently are the highest in the world. Clues to the causes and consequences of these high rates lie in their community and demographic distribution. The characteristics of the penal population—age, schooling, race/ethnicity—indicate a disadvantaged population that not only is involved in crime but also has few economic opportunities and faces significant obstacles to social mobility. Through its secondary contact with families and poor communities, the penal system has effects that extend far beyond those who are incarcerated (as discussed in Chapters 9 and 10).
The review of the evidence in this chapter points to four key findings:
1. Current incarceration rates are historically and comparatively unprecedented. The United States has the highest incarceration rates in the world, reaching extraordinary absolute levels in the most recent two decades.
2. The growth in imprisonment—most rapid in the 1980s, then slower in the 1990s and 2000s—is attributable largely to increases in prison admission rates and time served. Increased admission rates
are closely associated with increased incarceration for drug crimes and explain much of the growth of incarceration in the 1980s, while increased time served is closely associated with incarceration for violent crimes and explains much of the growth since the 1980s. These trends are, in turn, attributable largely to changes in sentencing policy over the period, as detailed in Chapter 3. Rising rates of incarceration for major offenses are not associated with trends in crime.
3. The growth in incarceration rates in the 1970s and 1980s was associated with high and increasing black-white disparities that subsequently declined in the 1990s and 2000s. Yet despite the decline in racial disparity, the black-white ratio of incarceration rates remained very high (greater than 4 to 1) by 2010.
4. Racial and ethnic disparities have combined with sex, age, and education stratification to produce extremely high rates of incarceration among recent cohorts of young African American men with no college education. Among recent cohorts of black men, about one in five who have never been to college and well over half of all high school dropouts have served time in state or federal prison at some point in their lives.
The following chapters explore in greater detail the causes and consequences of high rates of incarceration, but these chapters should be read against the backdrop of the following facts thus far established. First, the recent period of high incarceration rates is historically unprecedented and unmatched abroad. Second, incarceration is now pervasive among young men who are both acutely disadvantaged socially and economically and involved in crime. Third, today’s penal system, by virtue of its size and demographic concentration, has a broad social significance, reshaping the institutional landscape of poverty in America. We next begin to explore the causes of the growth in incarceration rates by studying the most proximate changes in criminal processing and sentencing that precipitated and drove 40 years of prison growth.


