
A
ADDITIONAL INFORMATION ABOUT FACTOR ANALYSIS AND CLUSTER ANALYSIS
This appendix describes factor analysis (FA) and cluster analysis in greater depth than was presented in Chapter 4. Many studies have conducted statistical analysis, predominantly factor analyses but also cluster analysis, to determine whether veterans’ symptoms might constitute a new syndrome. By comparing patterns of symptoms and severity between groups of veterans (typically deployed vs nondeployed), some researchers have sought to detect differences that would indicate a deployment-related change. Although many of the statistical analyses have been conducted to inform development of a case definition, they alone do not create a definition. The following pages explain latent variables, FA and related methods, cluster analysis, and structural equation modeling.
LATENT VARIABLES
Latent variables are variables that are not measured directly but are measured indirectly by using observed variables. A latent variable and its observed indicator variables make up a measurement model. There are four basic types of latent variable measurement models: FA, latent class analysis (LCA), latent trait analysis, and latent profile analysis. They can be organized on the basis of whether the observed variables are categorical or continuous and whether the latent variable is categorical or continuous. LCA models are composed of a categorical latent variable and observed variable whereas FA models are composed of continuous latent and observed variables (Bartholomew and Knott, 1999). There are other types of latent variable models, but for simplicity they are not discussed here. In medicine, syndromes (sets of symptoms that occur together more often than expected by chance alone) can be modeled as latent variables. In those cases, the observed indicator variables are the reported symptoms, and the latent variable is the hypothesized, but unknown, underlying disorder. The two types of latent variable models used most commonly in medicine are FA and LCA.
FACTOR ANALYSIS
FA is a statistical technique developed for data reduction and for developing scales and identifying latent relations among variables. More specifically, a FA evaluates the intercorrelation among variables within a dataset. FA can be conceptualized as a set of linear regressions solved simultaneously, in which each observed variable is a dependent variable in a linear regression, each latent factor is an independent variable, and the loadings are regression coefficients. It is assumed that the relationships between the factors and the observed variables are linear, and that there are no interactions among the observed variables.
FA cannot be used for “identifying” or “discovering” factors. Similarly, it would be inappropriate (and misleading) to refer to factors as “emerging” from a factor analysis. Such terminology inaccurately implies that there is a “true” set of factors underlying the data and that this factor set need only be unearthed. In fact, factor-analytic results are seldom unequivocal and are influenced by a series of analytic decisions. It should be noted that the editor’s comment in a 2009 paper on FA of symptoms in Gulf War veterans (Kang et al., 2009) points out that “factor analysis is not completely objective; for example, there are no definite rules for selecting the appropriate number of factors … or rules for selecting from among the many possible methods of rotation. It is an empirical method.”
Another misunderstanding of FA is the confusion of its goal with the goal of cluster analysis (Stewart, 1981). The goal of factor analysis is to suggest a structure that explains the relationships among variables in a dataset, not to identify item clusters or posit groups of people. Because the hypothesized structure typically includes substantially fewer factors than items, FA is considered a data-reduction technique. Instead of explaining the data on the basis of responses to each individual item or symptom, a data structure is posited that is more parsimonious.
Variables for Factor-Analytic Studies
The data for FA studies may be people’s responses to a set of items from a questionnaire or list of symptoms. They may include dichotomous items (such as yes–no questions) or items with more than two response options (such as never–sometimes–always). In the case of chronic multisymptom illness (CMI), responses to both kinds of items have been factor-analyzed. For example, Hom et al. (1997) asked participants to indicate the presence or absence of 50 physical and psychologic symptoms, and Forbes et al. (2004) asked respondents to rate the intensity of 63 symptoms as “mild”, “moderate”, or “severe”.
When using a FA software program, the analyst typically enters individual responses to each item (for example, one row for every respondent and as many columns as there are items). The software compares each item with other items one at a time and calculates the correlation of responses on every pair of items. Rather than entering individual response data, the analyst may enter the intercorrelation matrix itself. Table A.1 shows a hypothetical intercorrelation matrix for a dataset that included responses to six items. Typically, one would not conduct a FA on the basis of such a small number of variables, but it is presented for discussion purposes. In viewing the matrix in Table A.1, one will note that it is symmetrical: the numbers above the diagonal are mirror images of those below it. In addition, the numbers in the diagonal are all 1.000, representing the correlation between an item and itself. That is pointed out because, as will be explained later, in some FA approaches, the 1.000 is replaced with a different number. In the FA studies on CMI, many more items were used. Knoke et al. (2000), for example, conducted FA of responses to 98 items. The intercorrelation matrix for such an analysis would have contained 98 rows and 98 columns.
TABLE A.1 Hypothetical Intercorrelation Matrix for a Six-Item Dataset
| Item 1 | Item 2 | Item 3 | Item 4 | Item 5 | Item 6 | |
| Item 1 | 1.000 | 0.362 | 0.313 | 0.208 | 0.299 | 0.445 |
| Item 2 | 0.362 | 1.000 | 0.671 | 0.208 | 0.550 | 0.432 |
| Item 3 | 0.313 | 0.671 | 1.000 | 0.346 | 0.587 | 0.706 |
| Item 4 | 0.208 | 0.208 | 0.346 | 1.000 | 0.681 | 0.606 |
| Item 5 | 0.299 | 0.550 | 0.587 | 0.681 | 1.000 | 0.347 |
| Item 6 | 0.445 | 0.432 | 0.706 | 0.606 | 0.347 | 1.000 |
The Factor-Analysis Family of Methods
FA is not a single method but a family of analytic strategies that includes, for example, exploratory factor analysis (EFA) and confirmatory factor analysis (CFA). EFA is used to identify the underlying relationships among a large number of variables when there is no a priori hypothesis. CFA is a hypothesis-driven approach.
As explained below, an investigator conducting an FA faces a number of decision points and must decide among several options at each. They include decisions about factor extraction, rotation, the number of factors to retain, and whether to drop items. With the availability of user-friendly software and its generous use of default values, it is possible to complete an FA and not be aware of the need to make such decisions. But default decisions are decisions, nonetheless, and it is important to understand their ramifications.
Factor Extraction
One distinction among FA methods is the statistical approach used in “factor extraction”. Two of the available choices are reviewed, common FA and principal component analysis (PCA). To date, all published FA studies of CMI have used one of those two methods.
In FA, the variance in individual responses to items is assumed to be one of three types: common variance (shared variance), the portion of variance in a variable (for example, survey item) that is shared with one or more other variables; unique variance, the portion of variance that is specific to a single variable; and error variance, the variance not explained in the FA model. Both common FA and PCA are methods for analyzing the variance within a dataset. In FA, however, only the shared or “common” variance is targeted; in a PCA, all the variance in scores is analyzed. That difference in strategy reflects the differing purposes of FA and PCA. FA attempts to identify the structure of the common variance within a dataset. It is the method often (not always) chosen for scale development when the interest is in identifying the scalable, latent domains that best explain the variance in scores (Worthington and Whittaker, 2006). PCA, in contrast, targets the total variance in scores and attempts to represent all the variance, not just the common variance, in scores. There is no consensus as to which approach is “better”; in fact, FA and PCA often yield similar results (Velicer and Jackson, 1990). Complicating the choice is that there are variations even within methods. FA methods include, for example, image, principle-axis, and maximum-likelihood factoring (Tabachnick and Fidell, 2001).
The differences among the submethods of FA and PCA are beyond the scope of this report, but it is important to document the choices when publishing FA results. That applies to all the decision points in an FA.
In the course of an FA study, investigators may conduct multiple FA (for example, comparing a three-factor and a two-factor solution) and compare the resulting hypothesized structures. The choice of the optimal number of factors to extract is based on a number of considerations. Historically, “scree” plots, the amount of variance explained by the factors, and
eigenvalues were used. More recently, parallel analysis has been recognized as a superior method (Hayton et al., 2004). It operates by generating a user-specified number of simulated datasets that have the same number of variables as the observed dataset; each variable has the same mean and standard deviation as its analogous variable in the observed dataset. The difference is that in the simulated datasets the variables are uncorrelated. PCA is conducted on each of the simulated datasets, and a component (factor) is retained only if the eigenvalue for the component exceeds the mean of the eigenvalues for the component from the simulated datasets.
After the number of factors to extract is chosen, typically the solution is rotated to produce solutions that are more easily interpreted (for example, when items load more strongly on one factor and weakly or not at all on all other factors). A number of different rotations are possible, and they affect the interpretation, but not the fit, of the model. The rotation methods produce factors that are either orthogonal (factors are forced to be uncorrelated with each other) or oblique (factors are allowed to be correlated with each other). The decision as to whether to allow the factors to be correlated should be based on substantive theory: Are the latent variables correlated with each other in the conceptual model? Many of the published FA of CMI used orthogonal rotations (such as varimax), and this forced an assumption of unrelatedness of the factors.
So far, the models that have been described have been types of EFA; in these models, each variable is allowed to load on each latent factor. To simplify the model, researchers often follow their EFA models with CFA models in which each item is allowed to load on only one factor. Fitting such a model is mathematically equivalent to imposing an assumption that each observed variable has only one nonzero factor loading.
Confirmation of Model Structure
Because the summary variables resulting from FA are latent (unobserved) and the product of a number of (often subjective) decisions, it is important that an FA be replicated. When sample size permits, that can be done by splitting the dataset in two before any analysis and retaining half for confirmation. It is also helpful to replicate a factor solution in an independent sample. In those cases, the goal is to demonstrate “measurement invariance”; this means that the observed variables in the model can be used to measure the latent constructs of interest in the same way in different samples.
There are a number of levels of measurement invariance to indicate whether factor loadings are the same. The first is configural invariance. If, in two samples analyzed independently, the same number of factors is chosen as optimal, and each observed variable loads on the same factors in both samples, then configural invariance has been achieved. Second, One would then determine whether the loadings of each item on each factor are the same in the two samples. That is done by fitting two models: in the first, the loadings are allowed to be estimated freely; in the second, the loadings are forced to be identical in the two samples. The two models will be nested, and their fit can be compared via a likelihood ratio test or chi-squared difference test to determine whether the constrained model fits significantly worse. If so, measurement invariance cannot be claimed.
Occasionally, researchers will fit a CFA model derived from a previous sample in a new sample and assess its fit by using common metrics, such as the Tucker-Lewis Index and comparative fit index (Hu and Bentler, 1999). It is important to note that demonstrating
acceptable fit in the new sample is not sufficient to demonstrate measurement invariance. One must first demonstrate configural invariance by replicating the EFA.
In some cases, further levels of measurement invariance are explored, including ones that require that not only the loadings but the residual variance be identical among samples. Such a level of measurement invariance is seldom achieved, however, and it is not typically considered necessary.
LATENT CLASS ANALYSIS
In LCA measurement models, a number of latent groups (classes) are proposed. People are assumed to be a member of one and only one class, in such a way that the probabilities of membership in all of the classes sum to 1. For example, if there are two latent classes, and the probability of being in the first class is 0.75, the probability of being in the second class must be 0.25. Those probabilities are referred to as latent class probabilities. Each of the latent classes is characterized by different probabilities of having each of the symptoms related to the condition of interest. For example, if CMI is a homogenous condition with less symptom variability and a LCA model were fitted to data from every service member deployed during the Gulf War, one would expect a two-class model. The first class would be relatively asymptomatic, with low or nearly zero probabilities of each of the symptoms associated with CMI. The second class would have higher rates of each of those symptoms. These probabilities are referred to as conditional probabilities because they vary as a function of class membership. Since CMI is not homogenous and symptoms are highly variable, one would expect to use a model with three or more classes. For example, if there were both neurologic and respiratory variants of CMI, one would expect a three-class model with one class of relatively asymptomatic people, a second class with high conditional probabilities of the neurologic symptoms but low probabilities of other symptoms, and a third class with high conditional probabilities of the respiratory symptoms but low probabilities of other symptoms.
Like FA, LCA entails assumptions of independent people and local independence. In the present context, the assumption of independent people implies that there is no clustering of people and that one person’s pattern of symptoms is not related to another’s. Gulf War veterans were clustered within units and may have shared exposures. Furthermore, people in a given unit may have discussed their symptoms with their fellows. For example, a soldier might be more likely to report a symptom that he would otherwise have dismissed if he knew that a number of other soldiers in his unit also experienced that symptom. For that reason, the assumption of independent people may be problematic. Hierarchic modeling techniques, which account for such clustering, have been developed for both FA and LCA.
In the context of the Gulf War symptom literature, the assumption of local independence implies that when a person’s latent class membership is accounted for, the probability of having a given symptom is not affected by whatever other symptoms the person has. For example, in the sample as a whole, two respiratory symptoms, coughing and shortness of breath, will certainly correlate; that is, people who cough are more likely to have shortness of breath than the sample as a whole. If there were a respiratory class, local independence would imply that among people who are members of the respiratory class, a person’s probability of having shortness of breath would be the same regardless of whether he or she experienced coughing.
FA requires a decision on the part of the analyst regarding the number of latent factors to extract. Analogously, LCA requires a decision regarding the number of latent classes to fit. Typically, models with successively larger numbers of classes are fitted, and the model that has the fewest classes while still accounting for associations among the observed indicator variables (symptoms) is chosen (Nylund et al., 2007). As in FA, the decision has a subjective element, and the model and its results can vary dramatically on the basis of the decision.
Unlike FA, which groups symptoms along a number of axes, LCA groups people into latent classes. After a model is fitted, the estimated latent class probabilities, conditional probabilities, and each person’s pattern of symptoms can be used to calculate each person’s probability of being in each class. It is important to note that class membership is latent, so it is possible to say only that on the basis of this person’s pattern of symptoms, he or she is most likely to be a member of class x.
FA has both exploratory and confirmatory variants; LCA has no such analogue. Confirmation of the latent class model would entail replicating both the number of classes and the conditional probability estimates for each class. A formal test of measurement invariance would entail fitting the latent class model in two separate samples. If the same number of latent classes appeared optimal in both samples, one would then compare two models: a model in which the conditional probabilities for each symptom for each class were allowed to be different between the two samples and a model in which they were forced to be the same. The first model will always fit better because it is specifically tailored for each sample. The question is, How much better? That can be tested mathematically by using a likelihood ratio test because the two models are nested (the second, constrained model can be represented as a special case of the first model). If the test is statistically significant, one rejects the constrained model and concludes that the two samples differ in their underlying latent class structure. In lay terms, one can think of a model fitting data in the way that a set of clothes fits a person. One way to determine whether you have the same body shape and size as another person would be to ask how you look in your own clothes and compare it with how you look when you try on that person’s clothes. If you look significantly worse, you will reject the hypothesis that you have the same body shape.
LCA has not been used to model CMI. That may be because LCA is newer; computer programs capable of estimating such models were not available until the late 1980s and have become widely available only in the last 10–15 years. Some of the commonly used software programs—including SPSS, SAS, and STATA—still do not have this capability as part of their base packages, unlike MPLUS and R. FA, in contrast, has been available for some time in all these packages. Another barrier to the use of LCA is the relatively large samples required (Muthén and Muthén, 2002). That is due partly to the nature of the data on which the analyses operate. The input for FA is a triangular matrix of correlations between indicator variables. In the case of 50 indicator variables, that would mean 1,225 separate values in the triangular matrix. In contrast, the input for LCA is the numbers of people who have each possible pattern of symptoms. An analysis that includes 50 dichotomous symptoms results in over a quadrillion (250) possible symptom patterns. For that reason, LCA typically use fewer than 15 indicator variables.
LCA is potentially useful in the study of CMI because its goal is to group people, and it is preferable to post hoc processes of grouping people on the basis of their unvalidated factor score cutoffs. However, researchers using LCA to model CMI would have to make potentially difficult decisions about which symptoms to include in the model.
CLUSTER ANALYSIS
There are several methods of cluster analysis; however because all cluster analysis studies included in this report use k-means methodology the discussion below is limited k-means cluster analysis. K-means cluster analysis is a method of grouping people that has been used to model CMI data. Cluster analysis is not a latent-variable method; it does not assume that an underlying latent variable accounts for any associations between observed variables. Instead, cluster analysis is a type of computational learning method that aims to find clusters that are not known in advance. The “K” in the name denotes the number of clusters to be estimated, and this quantity is supplied by the analyst. Given a fixed number of clusters, the algorithm finds the points in p-dimensional space for each of the K clusters that minimizes the sum of the distances from each point to the nearest centroid (the center of each cluster). Figure A.1 shows an example in which two clusters are estimated by using people’s values for each of three observed symptoms. In contrast with LCA, in which class membership is latent, in cluster analysis people are placed into clusters as part of the estimation process, and cluster membership can be treated as an observed variable. Although the process is computationally intensive, it is capable of handling larger numbers of symptoms than LCA. Until recently, a major drawback of cluster analysis was that the choice of number of clusters to estimate could be quite subjective. However, the recently developed gap statistic has been shown to perform well in choosing the number of clusters (Tibshirani et al., 2001). In Addition, variable selection in cluster analysis can be determined in a variety of ways (Steinly, 2006). A remaining drawback is that methods of replication and validation of cluster structures are still an open field of methodologic research. Furthermore, because cluster analysis is not a latent-variable method, it is not possible to incorporate cluster membership within a larger structural equation framework, as one could with either FA or LCA.
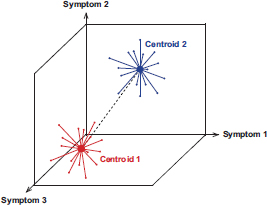
FIGURE A.1 Example of two clusters based on three symptoms.
STRUCTURAL-EQUATION MODELING
Once a latent-variable measurement model is estimated, the next step is to attempt to validate the measurement. In this context, validity implies that the measurement of the variable is equal to the true value of the variable on the average. For example, to validate your bathroom scale as a measurement of your weight, you would compare it with your true weight as measured with a gold standard. That process is relatively straightforward for two reasons: first, there is a
gold standard for weight, and second, the definition of weight is well understood and agreed-on. Validating measures of latent variables is considerably less straightforward because there are generally no gold standards, and the nature of a latent variable itself is often in question. In such cases, the best option is to assess whether the measurement of the latent variable is consistent with current theory regarding the latent variable and its relationships with other variables (Cronbach and Meehl, 1955).
In the context of developing a case definition of CMI, the case definition itself can be thought of as an instrument for determining whether a person has CMI. If there were a gold standard for CMI, it would be possible to assess the sensitivity (the probability that a person who has CMI meets the case definition), specificity (the probability that a person who does not have CMI does not meet the case definition), positive predictive value (the probability that a person who meets the case definition has CMI), and negative predictive value (the probability that a person who does not meet the case definition does not have CMI). All four of those values could be used to judge the performance of the case definition as a measure of CMI. Today, there is no gold standard, and such calculations are not possible. The next best option is to develop a theory-based network of observed variables that should be related to CMI. The most obvious variable is patient history of deployment and history of exposures; additional variables might include patient characteristics and results of diagnostic tests. It is assumed that if the case definition is a valid measure of CMI, “caseness” will be associated with those variables, and that such associations can be taken as evidence in support of the validity of the case definition.
Structural-equation models can be used to model associations with latent variables. In those models, associations are estimated jointly with the measurement model (such as the factor analysis or latent class analysis). Because they are modeled jointly, it is possible for the associated variables to influence the formation of the measurement model. That can be helpful in that it means that all available data are used to model the latent variable. However, if the goal is confirmation of the measurement model, it may be preferable to “fix” the measurement model and then to assess the relationships between the measurement model and the validating variable. In such cases, it is inappropriate to treat the latent variable as though it had been directly observed; special procedures are necessary to ensure an unbiased estimate between the latent variable and the validating variable (Nyland et al., 2007). Failure to correct for such biases can result in a missed association; it may appear that a validating variable is not associated with a latent variable even though it actually is.
LOOKING FORWARD
FA, LCA, and cluster analysis may be useful methods for making sense of the large number of symptoms potentially associated with CMI. However, the findings from these models must be validated against other observed variables. The process may involve multiple iterations in which observed validating variables are used to refine a measurement model and make possible more accurate assessment of the associations between the measurement model and the observed variables; that in turn further refines the measurement model. Such an iterative process could lead to identification of biomarkers of CMI, which in turn would inform research on mechanisms and treatment. The process could also be used to identify or rule out putative causes. Given that there are a variety of potential causes, which may have acted in concert, it will be important to explore relationships among risk factors and to incorporate the findings into the models.
Latent-variables models, like any other models, are only as good as the data that are used to fit them. The choice of variables to include in a measurement model is critical, and omission of key symptoms will result in models that do not capture the most salient features of CMI. Data on exposures, risk factors, and symptoms have been collected almost solely on the basis of self-reports. Verification of exposures after the fact may not be possible, but it is possible to assess the test–retest reliability of exposure self-reports. For example, did people who reported taking pyridistigmine bromide tablets 5 years after deployment also report having taken them 10 years after deployment? If reports have not been consistent, care should be taken in interpreting findings based on such data.
REFERENCES
Bartholomew, D. J., and M. Knott. 1999. Latent Variable Models and Factor Analysis. Vol. 7. New York: Arnold.
Cronbach, L. J., and P. E. Meehl. 1955. Construct validity in psychological tests. Psychological Buletin 52(4):281-302.
Forbes, A. B., D. P. McKenzie, A. J. Mackinnon, H. L. Kelsall, A. C. McFarlane, J. F. Ikin, D. C. Glass, and M. R. Sim. 2004. The health of Australian veterans of the 1991 Gulf War: Factor analysis of self-reported symptoms. Occupational and Environmental Medicine 61(12):1014-1020.
Hayton, J., D. G. Allen, and V. Scarpello. 2004. Factor retention decisions in exploratory factor analysis: A tutorial on parallel analysis. Organizational Research Methods 7(2):191-205.
Hom, J., R. W. Haley, and T. L. Kurt. 1997. Neuropsychological correlates of Gulf War syndrome. Archives of Clinical Neuropsychology 12(6):531-544.
Hu, L., and P. M. Bentler. 1999. Cutoff criteria for fit indicies in co variance structure analysis: Conventional criteria versus new alternatives. Structural Equation Modeling 6(1):1-55.
Kang, H. K., B. Li, C. M. Mahan, S. A. Eisen, and C. C. Engel. 2009. Health of US veterans of 1991 Gulf War: A follow-up survey in 10 years. Journal of Occupational & Environmental Medicine 51(4):401-410.
Knoke, J. D., T. C. Smith, G. C. Gray, K. S. Kaiser, and A. W. Hawksworth. 2000. Factor analysis of self-reported symptoms: Does it identify a Gulf War syndrome? American Journal of Epidemiology 152(4):379-388.
Muthén, L. K., and B. Muthén. 2002. How to use a monte carlo study to decide on sample size and determine power. Structural Equation Modeling 9(4):599-620.
Nyland, K. L., T. Asparouhov, and B. O. Muthén. 2007. Deciding on the number of classes in latent class analysis and growth mixture modeling: A monte carlo simulation study. Structural Equation Modeling 14(4):535-569.
Steinley, D. 2006. K-means clustering: A half-century synthesis. British Journal of Mathematical and Statistical Psychology 59(1):1-34.
Stewart, D. W. 1981. The application and misapplication of factor analysis in marketing research. Journal of Marketing Research 18:51-62.
Tabachnick, B. G., and L. S. Fidell. 2001. Using Multivariate Statistics, Fourth Edition. Boston, MA: Allyn and Bacon.
Tibshirani, R., G. Walther, and T. Hastie. 2001. Estimating the number of clusters in a data set via the gap statistic. Journal of the Royal Statistical Society: Series B 63, part 2:411-423.
Velicer, W. F., and D. N. Jackson. 1990. Component analysis versus common factor analysis: Some issues in selecting appropriate procedures. Multivariate Behavioral Research 25(1):1-28.
Worthington, R. L., and T. A. Whittaker. 2006. Scale development research: A content analysis and recommendations for best practices. The Counseling Psychologist 34:806-838.


