


Below is the uncorrected machine-read text of this chapter, intended to provide our own search engines and external engines with highly rich, chapter-representative searchable text of each book. Because it is UNCORRECTED material, please consider the following text as a useful but insufficient proxy for the authoritative book pages.
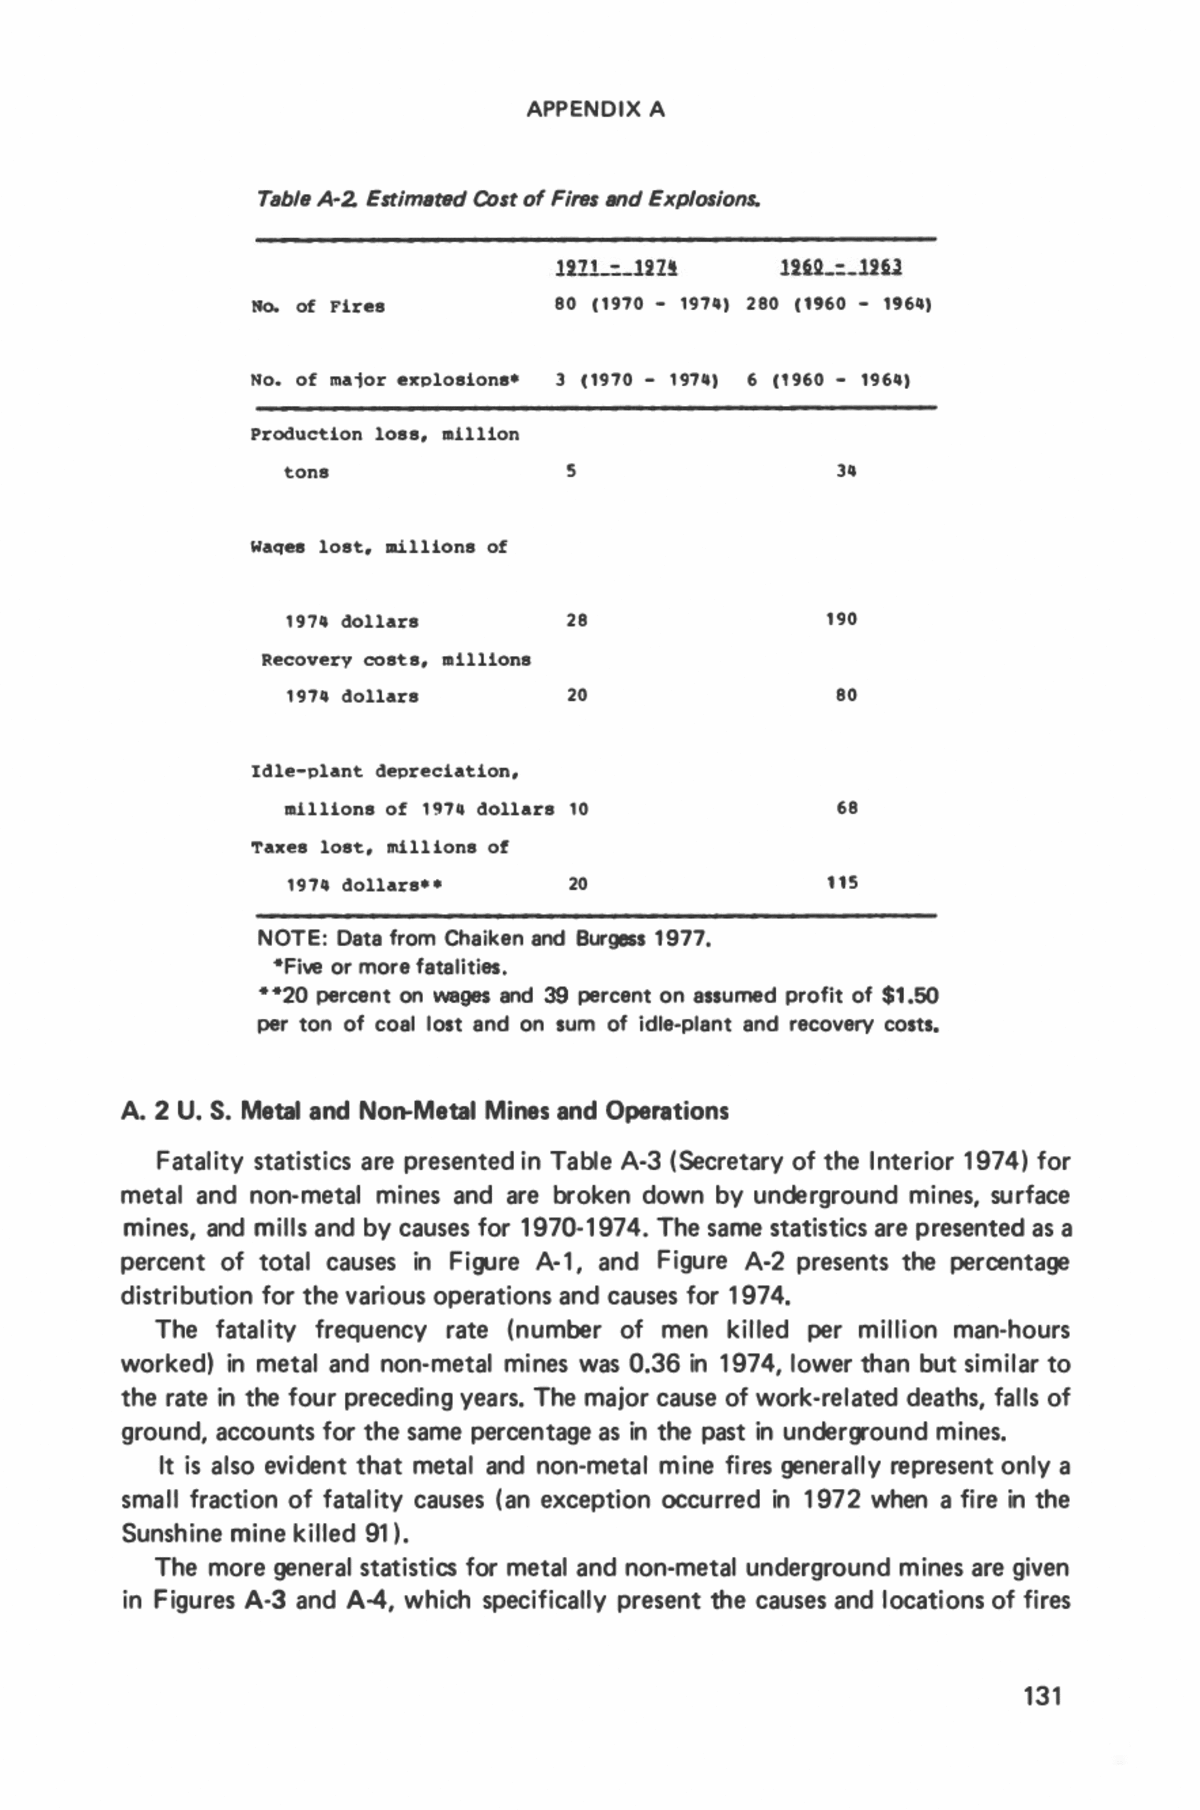
APPE N D I X A MINE ACCIDE NT STATISTICS A. 1 All U.S. Underground Mines Underground meta l and non-metal m i nes i n the United States outn u m ber u nder ground coal mines by m ore than six to one ; yet, the reported fata l ities resu lting from all accidents, the fi re i ncidence, and the fatalities resul ting from fi re are of th e same order o f magnitude for metal a n d non-metal m i nes a n d coal m i nes a s sh own i n Table A- 1 . The fi gures indicate that underground coal m i nes are su bstantial l y m ore hazardous than underground metal and non- metal m i nes but that the numbe r of fata l ities resu lting from fire is rel ative l y small compared to those resu l ti n g from other causes. A su bstantial reduction i n fi re incidence after 1 970 is also i ndicated and can be attri buted to regu l ations resulti ng fro m Acts of Congress passed i n 1 966 and 1 969. Tsble A· t, Ststistics of Reported Fstelities end Fires in Underground Mines â¢. Type o f 'line Fata l i ti e s Mi ne F i r e s , Annual Averaqe (number of Mines ) All accidents Incidence Fatalities 1 9 7 0 - 1 9H 1 9 70 - 1 9 50 1 9 70- 1 9 50 1 9 76 1 9 70 Metal a n d non 895 10 50 2â¢â¢ me1:al ( 1 5 , oOn) ( C oa l ( 2 , 300) 857 10 50 2 3 NOT E : Data from Chai ken and Burgess, 1 977. *A reported mi ne fire is one of longer than 30 min u tes duratio n . ⢠⢠e xcl u ded 9 1 fatal ities in t h e 1 972 Sunshine Mi ne F i re . The U. S. mining industry uses the term "meta l and non- meta l " m i nes to refe r to a l l m i nes other than coal . This terminology origi n ated in Acts of Congress passed i n 1 966 and 1 969 and i s mai ntai ned throughout thi s vol u me. The seriousness of the fire hazards in coa l m ines and their economic i mpact is further i l l u m i nated by the statistics presented in Table A-2. 1 30
APP EN D I X A Table A·2. EstimtJtlld Cost of Fires 1111d Exp/osion1. Ito. of Fires 80 ( 1 97 0 - 1 9 7 11 ) 2 80 ( 1960 - 1 9 611) No. of ma i o r eXPlo sions⢠3 ( 1970 - 1 97 4 ) 6 ( 1 960 - 1 9 611 ) Production los s , mi l l ion tons 5 3 11 Waqes lost, Mi l l ions of 1 9 7 11 dol l ars 28 1 90 Recovery co st s , m i l l ions 1 9 7 11 dollars 20 80 I d le-plant depreciation , mi l l ions o f 1 97 11 dollars 10 68 Taxes lost , mi l l ions of 1 9 7 11 dollars⢠⢠20 1 15 N OT E : Data from Chaiken and Burgess 1 977. â¢fiw or more fatalities ⢠. . 20 percent on wages and 39 percent on assumed profit of $1 .50 per ton of coal l ost and on sum of i dle-plant and recovery costs, A. 2 U. S. Metal and Non-Metal Mines and Operations F atal ity stati stics are presented i n Ta bl e A-3 ( Secretary of the I nte rior 1 974 ) for metal and non- metal mi nes and are broken down by unde rground mi nes, su rface m i nes, and m i l l s a nd by causes for 1 970· 1 974 . The same statistics are p resented as a percent of total causes in F i gu re A- 1 , and F igu re A·2 presents the percentage distri bution for the vari ous operations and causes for 1 974. The fata l ity frequ ency rate ( n u mber of men k i l led per m i l l i on man-hours worked) in metal and non- metal mi nes was 0.36 in 1 974, l ower than but si m i l ar to the rate in the fou r precedi ng yea rs. The major cause of work-re l ated deaths, fal ls of grou nd, accounts for the same percentage as in the past in underground m i nes. It is also evi dent that meta l and non-meta l m ine fi res genera l l y represent only a sma l l fracti on of fatal ity causes ( an exception occu rred in 1 97 2 when a fi re in the Sunsh ine mine k i l led 91 ) . The more general statisti cs for metal and non-metal underground m ines are given in F igu res A·3 and A-4, which specifically present the causes and l ocati ons of fi res 131
M I NES AND BUNKERS Table A-3. Fetaliti⢠e t Mlltel llfl d Non-Metal (stone, send, end grBI!fl/) DPBrations b y Causll$, 197(). 1 974. Yea r Ca u se 1 970 1 97 1 1 97 2 1 97 3 1 974* Umlergrou nd m i n e s : F a l l nf roof, fa ce or back 2\1 20 20 14 18 Slips o r fa l l s o f per s o n s 5 5 I! 5 8 l la u bl(e 16 3 4 10 4 Sliding or fa l l i ng ma teria l s 2 4 2 2 M a c h i nery 7 3 3 6 I! E x p losives 2 5 4 3 2 Flcc t ri d t y 2 I I 3 I l la n d l i ng m a t e r i a l s I 2 I 3 3 S u ff1K a l i o n 3 10 3 Mine f i r e� 2 91 2 I nr u sh of ma l e r i ;l l s or w a t e r 2 H a n d t o oh l l r l i c op t e r c r a sh U n k nown To t a l s 60 56 1 34 49 50 S u r face m i n e s : M a c h i n e ry 22 27 21 34 30 H a u lage 14 21 25 23 21 hi l l s <> f perso n s 8 10 6 9 6 l l a n d l i ng of nw t e r i a l s 4 4 3 6 6 F a l l � nf gro u n d 9 2 5 8 7 Flet· t r i c i t y 10 2 3 R 5 S l i d i ng , fa l l i ng m a t e r ia l s I 2 3 5 E x p l o si ve s 2 3 I 4 M i n e fi re 1 M i sc e l l a n e o u s 2 To t a l s 73 69 65 93 85 Mills: Machinery 12 14 19 9 9 H a u lage 6 I! 4 9 2 H a n d l i ng m a t e r ia l s 7 2 3 2 3 S l id i ng . fa l l i ng m a t e r i a l s 3 4 3 2 1-'a l l s of per�o n s 3 5 5 7 3 Flcc t r k i t y I I I 5 I E x p l o s i o n of gas Expl<lsives I S u f fot·a l i o n 3 M i sc el l a ne o u s 2 To t <t l s 32 39 35 33 22 <; R A N D T OT !I L S 1 65 1 64 234 1 75 1 57 NOT E : Data from Secretary of the Interio r, 1 974. * Prel iminary data. 1 32
APP E N D I X A All Mines and Mills 1 97 1 1 972 1 973 1 974 Machi nery Mach i nery Machi nery Fire 1- Haulage Haulage Hau lage z w (J Haulage a: w Fall of ground Fa l l of ground Fall of ground A. Fall of grou nd Fal l of person Fall of person Fall of person E lectricity t:l actn citv t:XPIOSIV8S Other Other Other Other N u mber = 1 63 234 1 75 1 57 Figure A- 1. FllttJ/lties in mettJI IInd non·metlll operetlons, percent of totlll by m11jor cauâ¢s, 1971· 1974 (SecrettJry of the Interior, 1974J. 1 974 U ndergrou nd Su rface Mills Fall of ground Machinery Machinery 1- z w Fall of person Haulage Fall of persons (J a: w A. Machinery Fall of ground Handling material Fall of persons Haulage Haulage Electricity Explosives Other .6'ectricity Other Other N u mber = 50 85 22 Figure A-2. F11tlllitit11 in metlll 11nd non-met11l oper11tions, percent of totlll by type of operetion 11nd m11jor ctJuses, 1974 (Secretllry of the Interior, 1974).
M I N E S A N D B U N K ER S E lectrica l LOCATI ON: Welding/Cutti ng 0 I n or N ⢠r Shaft or Station Spontaneous 0 Draft or Entry Combustion 0 Unknown Other* 0 10 20 30 40 50 ⢠I ncludes friction, combustible -ste ignition, smoking, combustible ges accum ulation, blasting, end unknown. Figure A·.l Cause and Location of Fires and Explosions in Underground Meta/ and Non Metal Mines, 1945- 1974 (Johnson, 1976). Contami nation F i re or LOCATI ON : Explosion D In or Nâ¢r Shaft or Station Hot G as D Draft or E ntry D U n k nown Other 0 20 40 60 80 1 00 1 20 1 40 Figure A-4. Cause and Location of Fatalities and Injuries from Fires and Explosions in Under ground Meta/ and Non-Metal Mines, 1945-1974 (Johnson, 1976). 1 34
APP E N D I X A and ex plosions and the causes and locations of fatal iti es and injuries between 1 94 5 a n d 1 974 period. These statistics indicate th at m os t fi res occu r in shafts a n d drifts because of electrica l defects, waste ignition, and friction causes and th at most fata l ities also occu r in shafts and d ri fts because of conta m ination sou rces. A. 3 U.S. Coal Mines Coal mine fata l ities, as a rough indication of the seriousness of coal m ine d is aste rs, are broken down by cause or source for 1 970 in Ta ble A-4 to indicate the relative i m po rta nce of these causes. The nu mber of coal m i ne fires are presented in F i gu re A-5 fo r 1 954-1 974. A more i l l u minati ng set of statistics is presented in F i gu re A-6, which presents data on the nu mber of i nju ries and deaths and the number of u ndergrou nd fires for 1 954- 1 973. These fi gures seem to indicate that safety i n th is particu l a r area, con tra ry to some argu me nts, has been i mproved by regu l ation . The dramatic effect of applying legislated standards and procedu res is even more apparent when Tables A-5 and A-6 are consi dered. These ta bles present figu res for fires and explosions and their esti mated cost for ti me periods coinci di ng with sign ificant legisl ative acti ons. F or the l ay reader all the above figu res may be i mpressive but without mean ing ful significance. Mitchel l and Verakis ( 1 97 5) hel p to clarify the situation by noti ng that recovery of a mine fol l owing a major fire or ex plosi on dive rts fu nds and people from ex pansion to nonproductive activities. Sel dom will a m ine be reopened in less than 1 00 days fol lowi ng a major fire or ex plosion, and then it often takes years before pre-disaster producti on and cost-effectiveness can be regai ned. I n one m ine, a fi re fol l owed by a series of explos i ons destroyed the retreat workings so com pletely that ei ght years of redevel opment were needed to retum the mine to a profitable status. To provide the reader with a clea rer understand i ng of coa l m i ne fi res, a study of U.S. coal m i ne fi res conducted by the U.S. Bureau of M i n es ( 1 973 ) is su m mari zed bel ow. Th is stu dy was initiated in recognition of the fact that several areas of underground coal mines have obvious fire potenti al. Some of these, l i ke belt heads, have been i m proved recentl y by the provision of standby devices. Others have not bee n studied systematical l y and im provements have not been incorporated even though fi re su ppression systems are ava i l a ble. Face mach i nery, particu larly without a water suppl y, fa lls i n this l atter category. In the Bureau of Mi nes stu dy ( 1 973 ) , mine i nspector reports for 1 952 t o 1 970 were used t o review the fi re h istories of electric face machi nery. D u ring th is peri od there were 386 fire incidents ; these fi res are broken down by machi ne i n Table A-7 and their ch ronology is shown in F igu re A-7. Tabl e A-8 indicates the number of electrical fire inci dents per state for 1 952- 1 970. E ighty pe rcent occurred in West Virgin ia, Kentu cky, and Pennsylvania. West Vi rgi n i a accounted for the most fires until 1 968 when Kentucky h ad the 135
M I N ES AND BUNKERS Table A ..C. Fatlllities a t Colli Miflfls, by C.uw, 197a Fa l l s of roo f and face ( i ncludes 11 f a t a l i ties from f a l l o f hiqh val l at surface opera t i ons) 93 36 Haulaqe 18 Machinery 17 Explosion s , qa s or d ust 16 Electrical 17 7 Ul other u 6 255 100 NOTE: Data from Secretary o f t he I nterior 1 970. tl) w a: LL LL 0 a: w a:l � :J z o �L-L-�L-L-L-�L-����-J 1 954 1 964 1 974 YEAR Figure A-ti Fires in Underground Coal Mines 19� 1974 (Mitchell and Verakis, 1975). 1 36
A PP E N D I X A ! I ! ' I '"' ;lt 0) - � -· 1 I ""' R 0) - � - .,.. .� � I � � I :§ § l! c! ld � e i> ..... . 1 37
MINES AND BUNKERS Tabla A·5 FiiW and ExpiOiiom in Underground Ooal Min-. - - -- - - --- EIBl�----------- - - - - 1 97 0 -711 1 9 60-64 1 9 6 5- 6 9 Production , mi l l ion tone 1 11 40 1 119 8 1 12 3 Number of man-hours , mi l lions 8 2 11 823 768 Tone per man-hour 1.8 1.8 2. 2 NUmber o f fires 80 280 2115 Number o f u io r explosions ⢠3 6 5 Number of in j uri e s f rom f i re a nd explosion Fatal 63 137 2 3 11 Non fata l 1 0 11 189 141 N OT E : Data from Mitchell and Verakis 1 975. * Major explosions are those i n which fiw o r more lives a re lost. Table A-& Estimated Cost of FIIW and Explosion1. 1 960-63 1 97 1 - 7 11 Production lost , mil l ion tone 3 11 5 Waqee lost , mi l l ions o f 1 9 74 dol lars 190 28 Recovery coa t s , mi l l i ons o f 19711 dol l a rs 80 20 I d le-plant depre c i ation, mi l l ions of 1 97 4 dol l ars 68 10 Ta xe s lo s t , mi l l ions o f 1 9 7 11 dol l a rs 115 20 N OT E : Data from Mitchell and Verakis 1 975. * The year 1 970 is not incl u ded because during that transitional period i mplementation of the Act is not cons idered to haw been as effectiw as i n subsequent years and thus its i nclusion would bias the analysis. To compensate for that, the year 1 964 is not included i n the pre-Act period; however, its i nclusion woul d not have reduced l osses. 1 38
APP E N D I X A Table A-7. Number of Fires per Mechine Type, 1952- 1 970. Machine N u m ber of Fires Cuttinq Machine 169 Shut t l e c a r Cont inuou s Miner 30 Loadinq "'achine 30 Roof Bolt e r 21 Roof Dri l l Face D r i l l 3 Locomotives & Trucks 36 Non-face Machines 19 N OT E : Data from U.S. Bureau of Mines 1 973. Figure A-7. Chronology of Mine Electrice/ Mechinery Fires, 1952- 1970 (U. S. Bureau of Mines, 1973). 1 39
M I N E S AND B U N K E R S Table A-& Geographic Location and Number of Electricsl Fire1, ( 1952-70). State No. of Fires west Virqi nia 167 Jtentuc: Icy 69 Pennavlvania 71 Virqinia 25 Ohio 22 Alabama 8 Tennessee 6 I nd iana 5 Colorado 5 I l l i no i s 7 Utah N OT E : Data from U.S. Bu reau of Mines, 1 973. most. Between 1 966 and 1 970, the nu mber of fi res per year rose i n Kentu cky and decreased in Pennsylvan i a. The reasons for these trends are not clear but the Ken tucky situation pro ba bly reflects a number of new m i ne open ings. Beyond data on the type of machine and the physical location of the m ine, the i nspector reports do not necessarily provi de a l l of the data that might be needed to assess the facts su rrounding the fi re . In many cases, the reports contain the su � jective opinions of the inspectors. I n more recent years the com pleteness of the reports i mproved markedly ; therefore, fu rther discussion of the data wi l l concen trate on the 1 96(}. 1 970 period even though these data are not always complete and the nu mber of data poi nts in each ta bu lati on vary. One fact, however, is clearly esta bl ished : of the 386 machine fi res, all but two were electrica l l y i nitiated . A . 3. 1 Seam Height Versus Fire F requency Usi ng the 1 96(}. 1 970 data, a nu mber of observations can be m ade. The coal seam hei g ht and fi re incident data show that fires are more preval ent in coal seams 30 to 80 i nches in height. These data, however, most l i kely reflect the concentration of m i n i ng activity i n the "l ow" coa l seams rather than characteristics associated with these seams. Ta ble A-9 rel ates fire incidents with coal seam hei ght. A. 3.2 Mine Production Versus Fire Frequency Those mines from wh ich 500 to 2,000 tons of coal per sh ift are mi ned show the 1 40
APP E N D I X A Table A·9. Coel Seam Height end Num ber of Electrical Fires *. Coa l Seam No. of Height (in.l Fires 0-30 7 3 0- 5 0 96 50-80 88 8 0- 1 2 0 23 1 2 0- 2 0 0 s 2 00 - 4 0 0 N OT E : Data from U.S. Bu reau of Mines 1 973. *Only 220 out of 262 reports stated the height of the seam. Table A· tO. Mine Production end Num ber of Electrical Fires. Production No. of (tons/shift) Fires * o - 1 00 9 1 0 0- 5 0 0 56 5 00- 1 0 0 0 11 3 1 0 0 0 - 20 0 0 11 8 2 0 0 0 - 3 0 00 19 3 0 0 0 - 11 0 0 0 13 11 0 00- 7 0 0 0 2 7000⢠1 0 , 000 2 N OT E : Data from U.S. Bu reau of Mines 1 973. * On l y 1 92 out of 262 reports stated the production of the mine. g reatest number of fi res. M i nes producin g 1 00 to 500 tons of coal per shift are second in the n u m be r of fire incidents. Table A- 1 0 rel ates the number of fi res to mine production. There is nothi n g in the ava i l a ble information that sh ows th is to be more than coi ncidence; however, a possi ble factor is that conventional m inin g is the 141
M I N E S A N D B U N K ER S prevalent method i n t h e smal ler tonnage mines a n d the pri mary face type of cutti n g machi nery used with conventi onal m i n i ng is the most frequent electrical fi re sou rce. Reviewi ng the type of cutti ng mach i ne i nvolved in a sample of 49 fi res showed that 42 fi res occurred on Joy machi nes, 5 fi res on Jeffrey machines, and 2 o n Sul l ivan machines. Models 1 0, 1 1 , a n d 1 2 of t h e Joy cutti ng machi nes accou nted for 40 of the 42 fi res and Models 1 5 and 1 6 for the rem ain i ng 2. The Jeffrey and Sul l ivan machi nes are even ol der than the Joy machi nes, but the mach i ne featu res that caused the fi res have been corrected on newer model s. A. 3.3 Mine Size Venus Exti nguishment Ti me The apparent correlation between m i ne s i ze and fi re i ncidents carries over i nto exti ngu ishment. The ti me requ i red to fight and exti nguish machi n e fi res is greatest in the mi nes produci ng 1 00 to 200 tons per shift. If fi res where the m i ne had to be sealed are excl u ded, the data obtai ned from the i nspector reports for 1 960-1 970 show that the mean m i n i m u m ti me requ i red to exti ngu ish a fire i n m i nes produci ng 500 tones per shift was 9.8 hours. The exti ngu ish i ng ti me decreased to 5.3 h ou rs for mi nes produci ng 2,000 tons per shift and to 1 to 2 hours for m i nes producing more than 4,000 tons per sh ift. Even though these val ues are dependent on the number of fi res occu rri ng in the different size m i nes, which makes the ti me-lost values for the l arger produ ction mi nes less statistically accurate, the smal ler pro· duction mines do require more ti me for fire exti ngu ish ment. When fi res that re· qui red sealing the mine were i ncl uded in the exti nguishing time data, the weighted mean minimum exti n gu ishi ng ti me i ncreased markedly, reflecti ng delays of up to 1 20 days before considerati on cou l d be given to reopen i ng. During the past 1 0 years, on an average of one mach i ne fire i n every fou r has resu lted i n seal i ng. A. 3.4 Fire I n itiation The important i nformation to be derived from the fi re histories is the sou rce of ignition and those factors that propagate an electr ica l fa i l u re i nto a fire. The pre· dominant cause of el ectrical fai l u re has been the tra i l i ng cable su ppl y i ng power to the mach i ne that has caused some 70 percent of a l l fi res. ( I n the past a differenti a tion was made between fires where the cable was coi led on the reel and those where it was tra i l i ng the machi ne. After an analysis of the data, however, the U.S. Bureau of M ines concluded that there shou l d be no disti ncti on between such fi res because most fires in the cable reel were due to ca ble damage that occu rred off the ree l. I n the remai nder o f this discussion, therefore, fi res wi l l be divi ded i nto those occu rring on the mach i ne and those relati ng to the cable wh ich are grouped as off the machi ne. ) Between 1 960 and 1 970, 246 i nspector reports contai ned su fficient deta i l to permit th e source and the cause of the electrical ignition to be identified and these fires are categorized in F igu re A-8. One hundred seventy-five were caused by cable fai l u re and the remaining 71 by on-mach ine igniti ons. To fu rther assess the ign i· 1 42
APPEN D I X A F�rn occu rnng in the �= : 1 15 ott of 50 1 i No. of Firn: r- f- â¢o r ,..... r- 30 r r- 20 f- f- r- 1 0 f- Figure A-8. Fire Initiation Factors and Contri bution (U.S. Bureau of Mines, 1973). tions, three classifications of causes have been establ ishe d : normal working opera tions, mai ntenance operations, and procedural occurrences. The fi res occu rri ng off the mach ine under normal working operations include tra i l ing cabl e ru n overs, crushes, snags on the cable gu i de, and over-heats on the cable reel in wh ich the tra i l ing cable was judged to be properly spliced and in good condition. F i res included in the mai ntenance category resu lted from tra i l i n g cable that or switches or circuit protective dev ices th at were not properly m ai ntai ned. Those fi res that occu rred from i nadequate, i noperative or non-ex istent circu it pro tecti on devices, mi suse of equ i pment, or the equ i pment desi gn were placed into the procedure category. The data presented in F i gure A-8 sh ow that fi res occu rring off the mach i ne are sign ificantly associ ated with equ i pment maintenance. F i res that occur on the machi ne, however, usu a l l y are attri butable to normal working opera ti ons. These fi res ma i n l y result from sh ort circu its in the cutting moto r leads, contactor compartments, and con necti ons on cutti ng machi nes. A. 3.5 F i re Propagation Alth ough electrica l causes are the sou rce of ign ition, fi res can not resu lt or a- 1 43
M I N ES A N D B U N K ER S chieve any great magnitude without avai l a bl e fuel. Information obtained from the mine inspector reports permitted on l y a su bjective evaluation of those factors th at were pri mari ly i nvolved in the propagation of the fires, but the data are sufficient to permit defi n ition of the major factors. F i gu re A-9 i l l ustrates the re l ative i nflu ence of seven factors associated with fi re propagation. The accum u l ation of oi l, coal dust, and grease present on the machinery was judged to be the major contri butor to fi re propagation. Other factors, in decreasi ng order of importance, were the e lectrical cable insu l ation, hydraulic hoses, hydraulic fluid, tires, coal, or m ai n tenance and proced u re factors previously defi ned. The latter fou r factors were i nvolved l ess than half as often as the three major factors. The difference between the influence of hydraul ic hoses and hydrau l ic fl u i d on fi re propagation is due to the fact that hoses conta in the fl uid and prevent its i gnition even though the hoses h ave bee n ignited. The very l i mited use of flame-resistant hydraulic fl u i d did n ot a l l ow assessment of its rol e in fire propagation. D i rect coal ignition by e l ectrical fai l u re is a reasonably m i nor factor even though most fi res occur i n highly volati l e bitu mi nous seams. H owever, t h i s refers onl y to propagation on t h e mach i ne and does not refer to fire spread to roof or ri b. A comparison of electrical fire propagation factors duri ng 1 952-1 959 with those during 1 960.. 1 970 shows on l y one significant trend. In both pe riods, the major contri butors to fi re propagation were the oi l , coal dust, and grease accu m u l ation ; 10 r� r- r- "'"' r- ??:: r- r- / ?/,'; ,; r- � � r- n- .. I h � )J Figure A-9. Electrlcel Fire PrOPIIf/Btion Influ ence, 19� 1970 (U. S. Bureau of Mines, 1973). 1 44
APP E N D I X A cable insulation ; and hydraul ic hoses. The infl uence of the hydra u l ic fl uid was greater during the earlier peri od, probably reflecting the technological advances i n hose materi als and equi pment design and the more recent practice of segregati ng electrical and hydraulic l i nes. A. 4 United Kingdom Coal Mines I n order to put domestic coal m i ne fi re problems in perspective, the fol l owing statistics dea ling with coal m i ne fi res and expl osions i n the United K ingdom are presented. D ata on fires in United K i ngdom u nderground coal m ines between 1 968 and 1 972 are given in Table A- 1 1 and on explosions, in Ta ble A- 1 2 ( Her M ajesty 's Stationery Office 1 973) . F i gu re A- 1 0 ( He r M ajesty 's Stationery Office 1 975) pre sents i nju ry and fatal ity statistics for 1 94 7 through 1 97 5. Table A- 1 1. Underground Fif'ft st C011l MinBI in the Unlr.d Kingdom. 1968- 1972. Cau se o f l - i re 1 96 1! 1 96 9 1 9 7 ft I 'J 7 1 1 97 2 I . Safe t y l a m p s 2 . S h o t fi r i ng I 3 . l�lec t r i d t y 14 II t! 7 10 4 . Spo n t a neo u s combustion 7 I 7 7 I 5 . Mecha n ical fr i c t i o n (a) Bel t c o nveyors 26 24 32 16 16 (b) Fric t i o nal spa r k i ng, cu t t i ng, or p o wer l oa d i ng m a c h i nes I I (c) Others 6 4 3 5 2 6 . Co n t ra ba n d I I 2 2 7 . Locomot ives 5 2 2 4 3 8. D u r n i n g a pplia nces (e.g. , oxy- acetylene bur ners) I 9. Miscella neous or u nk nown ca u ses 4 I 3 TOTA L 65 44 54 46 35 N OT E : Data from Her Majesty's Statio nery Office, 1 973. 1 45
MINES AND BUNKERS Table A - 1 2. Underground Explosionr a t Coel Minft In th e United Kingdom, 1968- 1972. Cau se of E x plosion 1 96 8 1 96 9 1 970 1 97 1 1 97 2 I. Safe t y l a m ps ( a ) 1 : 1 a m ..: t b ) Ele w i l· 2 . Sho t fi r i ng ( a ) By e x p losive (i) U n sho.:a thcd permitted e x p l osive Iii) hj u iva l e n t shea t hed â¢Â· x p l osivc 2 3 2 2 ( iii) O t h e rs ( b) By c x p luder or cable ( c ) Unknown 3. Elcl· t ri d t y ( a ) At fa,·c wor k i ng or ro a dh ead 2 4 2 t b) Ba c k from fa ce 2 4 . U ndc rg rou nd fire� Ia) Spun t a nc o u s â¢Â· o m bu st i o n ( b ) 1\lcdta n k a l fr ict ion (c) Others 5. Co n t ra ba n d 6 . Fr i c t i o n a l s p a r k i n � b y c u t t i ng or p o w e r l o ;� d i ng m a d t i nc 21 19 I I! 14 5 7 . M i scell a ne o u s or u n k no w n cau ses 2 I I I TOTA L 29 29 24 16 9 N OT E : Data from Her Majesty's Stationary Office, 1 972. 1 46
APPEN D I X A f!? z w 0 f!? g u.. :t < (I) u.. z 0 < :E ct: w I:D :E § ;::) z 8 ..J � g YEAR Figure A- 1 0. Accldtlnt Rete from All Csu��es st Cos/ Min⢠In United Kingdom, 1947· 1975 (Her Msjtnty's Sts tionsry Office, 1975). References A. F . Chai ken and D. Burgess, "Selected Topics in Mine Fire Research," paper presented at Nationa l Symposium on Fire SefetV Aspects of Poly meric Materials, Washingto n , D .C., June 6-8, 1 977. The Secretary of the Interior, Moving Ahesd in Mete/ snd Nonmetsl Mine Heslth snd Safety, 1 974 Annual Report, Admin istration of Public Lsw 89-577, 1 974. G. A. Joh nson , Development of Mine Shsft Fire snd Smoke Protection Prototype System, Ski l lings Mining Review, Mar. 1 3, 1 976, The Secretary of the Interior, Towerd Improved Heslth snd Sefety for Americs's Cos/ Min81, 1970 Annusl Report. D. W. Mitchel l and H. C. Vera kis, An Overview of the Fire snd Explosion Hszsrds in Under ground Cos/ Mines, 1 st Symposium on Underground Coal Mining, Vol . 1 , pp, 1 4 1 -1 94, 1 975. J, Nagy and M . Hal l , Fire Detection in Cos/ Mines, Mining Enforct�ment snd Sefety Administrs tion, 1974. Mine SefetV Admin istration Fire Suppreuion Equipmen t, prepared U.S. Bu Mi nes Contract 1 1 1 386, 1 973 (NT I S PB 236592/AS) . Report H. M. Chief Inspector of Mines and Quarries, for 1972, Her Majesty 's Stationery Offictl, 1 973. 147
