
A
An Evaluation of STAR METRICS1
STAR METRICS (Science and Technology for America’s Reinvestment: Measuring the Effect of Research on Innovation, Competitiveness and Science) is a joint effort involving the National Institutes of Health (NIH), the National Science Foundation (NSF) and the White House Office of Science and Technology Policy with the objective of documenting the outcomes and public benefits of national investments in science and engineering research. Data collection is planned in two phases. The first, Level 1, is drawing a limited number of data fields from existing university administrative databases and includes no personally identifiable information. The goal of Level 1 is to streamline and standardize data for reporting on the impact of federal research and development (R&D) spending on job creation. Although the initial focus is on spending supported by the American Recovery and Reinvestment Act (ARRA) both ARRA and non-ARRA spending are reported. Data collection for the second phase, Level II, has yet to begin.
While the program is relatively new, it takes two interesting steps by (1) automating and aggregating standardized reporting of grant payment information from university administrative records, and (2) creating a dataset that can plausibly reorient the analysis of federal R&D investments away from a focus on grants and toward a focus on investigators. Programs akin to STAR METRICs are beginning to gain traction in
_____________
1The committee was assisted by Jason Owen-Smith and Alicia Carriquiry in drafting this appendix.
Australia, the European Union nations, and Japan, offering the eventual possibility of international comparisons.2
DATA STRUCTURE AND COMPONENTS
As of the committee’s last communication with George Chacko, the official from NIH’s Center for Scientific Review who oversaw the STAR METRICS Program at the time this report was drafted, 85 university campuses and one independent nonprofit laboratory had either begun to submit or committed to submitting data to the program.
Level I STAR METRICS data are divided into three files, each tracking a different flow of federal R&D expenditures by performing institutions. Each file is updated quarterly by each institution. The committee was unable to ascertain how timely and complete those updates are as access to the data remains difficult (see the discussion of access and user experience below). All three files share common information about the time period covered, the federal award ID (where appropriate), and the relevant performing institution account number for each record. The three files are as follows:
- Individual file, which tracks salary and wage payments to university employees (faculty, staff, students, and trainees). In its raw form, the individual file includes shared data fields, as well as a campus-specific, anonymized employee identifier, job classification information, an indication of whether the employee is full or part time, and a calculation of the fraction of total compensation charged to the grant account in a given time period. Information on the dollar value of individual wage payments is not included. Postprocessing by a federal subcontractor adds information on the agency where the grant originated, a standardized occupational classification, and information on whether each record derived from ARRA or non-ARRA sources. These files are used by the agencies to calculate or estimate the number of jobs created directly or indirectly by federal funding.3
- Vendor file, which tracks payments from universities to vendors for supplies and services. In addition to shared data fields, this file includes the Dun & Bradstreet (DUNS) number or zip code of each vendor and the amount charged to the account by the vendor. Postprocessing by DUNS and NIH supports the creation of
_____________
2For more background information, see the STAR METRICS Website at https://www.starmetrics.nih.gov/ [August 2014].
3See https://www.starmetrics.nih.gov/Star/Participate#calculatingjobs [August 2014].
-
campus-specific “workforce” reports that estimate the number of jobs created by grant expenditures within the institution’s home state and nationally.
- Sub-award file, which tracks subcontracts to other performers of R&D from a particular campus. In addition to the common data fields, this file includes a DUNS number for sub-award recipients and the amount of a relevant sub-award.
When combined and cleaned, these 3 files yield 14 data items for a wide variety of R&D performers. There is potential value in cross-campus comparisons of these data and in the estimates of job creation undertaken by NIH and other agencies. Nevertheless, the data are broad but relatively shallow. We thus believe that the greatest value STAR METRICs data could add to efforts to assess the value of research would come from (1) broadening coverage by enrolling additional institutions, (2) deepening coverage by expanding the data elements reported, and (3) linking STAR METRICS data to other national and international datasets. Below we address some of these possibilities. Despite the data’s potential, much work remains to be done to establish their quality and to ensure broad, easy access for researchers.
POTENTIAL VALUE OF THE DATA
While we believe that the value of these data might be increased by the addition of new data fields, we focus our attention in this section on potential uses of the Level I data alone. We first address the descriptive and comparative possibilities we see in the STAR METRICS data and then summarize possibilities for linking these data to existing sources of information that might expand their reach.
Descriptive Comparisons across Campuses
STAR METRICS is the first data source that could enable micro-level comparisons of the organization and funding of academic R&D across a wide range of performing institutions. No comparable dataset exists. There is significant descriptive value in these data, but care must be taken to acknowledge difficulties with representativeness, as well as potential variations in data quality and reporting standards across performing institutions (see the next section on data quality). STAR METRICS Level I data have the potential to provide new and useful information on the flows of federal R&D money from performing institutions into the larger economy, on the types of jobs supported by federal R&D at performing institutions, and on the collaborative organization of academic research.
Data from the vendor file for a single quarter of purchases for a mid-western public university with a medical school indicate that this institution made 14,708 purchases from 2,221 vendors totaling some $49.72 million. The largest single purchase (~$335,000) was made from a chemical supply company in San Diego, California. The vendor from which the greatest number of purchases were made (1,830 purchases totaling nearly $3.35 million) was a scientific supply company in Hampton, New Hampshire. While we had access to raw vendor file data from only a single campus, such information might provide new and useful insight into the direct local and national economic impacts of federal R&D spending on campus. With appropriate linkages to other data sources, such data might also allow fine-grained estimation of the indirect and labor market impacts of such spending.
Table A-1 reports the number of wage payments by STAR METRICS standardized occupational classification for two very different universities in a single quarter. These data indicate the dramatic difference in scale between a large public university with a medical school and a smaller private university focused more heavily on physical science and engineering research. They also suggest interesting differences in how research is conducted. Consider just one comparison. Nearly 35.7 percent of all wage payments at the public university were to faculty. In contrast, at the private university, just 18.9 percent of wage payments went to faculty. This difference is highly significant in a two-sample test of proportions. While one should not make much of this ad hoc comparison of two campuses, establishing differences in the allocation of effort to R&D across campuses holds substantial possibilities for (1) understanding the direct employ-
TABLE A-1 Comparison of Wage Payments by Job Classification in a Single Quarter*
| Standardized Job Classification | Public University (with medical school) | Private University (no medical school) |
| Faculty | 5,130 | 486 |
| Graduate Student | 2,342 | 668 |
| Postgraduate Researcher | 1,471 | 344 |
| Research Analyst/Coordinator | 1,559 | 60 |
| Technical/Staff Scientist | 2,609 | 492 |
| Clinician | 84 | 0 |
| Research Support | 1,158 | 504 |
| Undergraduate Student | 1 | 19 |
| Total | 14,354 | 2,573 |
*Unit of measure: employees paid any part of a full-time equivalent (FTE) in a given job category.
ment effects of federal R&D, and (2) identifying the effects of different organizational arrangements for R&D on the outcomes of science.
A recent report published in Science suggests some of the potential uses of aggregated and comparative data of this sort (Weinberg et al., 2014). That research makes use of Level 1 STAR METRICS data from nine campuses to analyze the short-term economic effects of federal R&D spending. While the findings are descriptive and represent a downpayment on the kinds of analyses that could be developed with extended and linked STAR METRICS data, this paper demonstrates that (1) most people employed by federal grants are students and staff, (2) the composition of the academic workforce varies dramatically across funding agencies and fields of research, and (3) significant spending to purchase goods and services necessary to research is dispersed across more than 1,700 U.S. counties.
The structure of the individual data file—which associates payments to employees with particular grants and tracks cases in which individuals are paid by multiple sources—also offers new possibilities for studying the performance of R&D on campus. It is a fairly simple matter to take data in this format and render them as a social network in which nodes are individuals who receive payments, and ties indicate that two linked individuals were paid under the same grant. Figure A-1 presents graphic representations of the data for the two campuses highlighted in Table A-1. Differences in the extent and structure of collaborative networks across campuses may account for variations in levels and types of scientific productivity and thus in eventual economic, social, and public health outcomes.
Such comparative and descriptive data are potentially valuable, but both their scientific utility and usefulness for public policy are limited if they cannot be linked to other data sources to enable more rigorous analyses.
Linkages to Other Relevant Sources of Information
We briefly consider three possible means of linking STAR METRICS data to other sources of information that could prove useful in assessing the value of research for achieving national goals. Because few data fields are included in STAR METRICS Level 1 data, the possibilities for data linkages are relatively limited. The three most obvious linking strategies focus on DUNS numbers, federal grant numbers, and university/campus names.
At the organizational level, the DUNS numbers provided in the STAR METRICS vendor and sub-award files could be used to link these data to commonly used sources for the analysis of economic and labor force
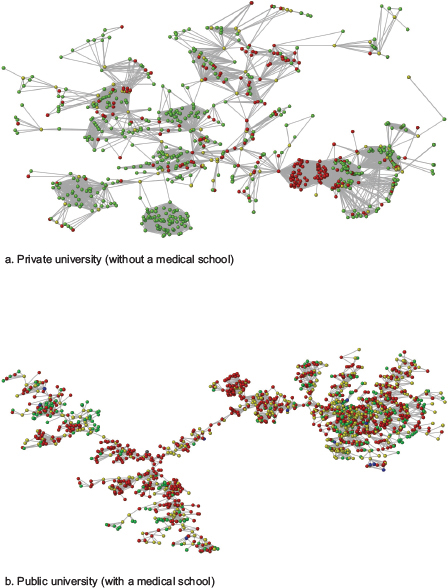
FIGURE A-1 STAR METRICS collaborative network for two universities in a single quarter.
NOTE: Red = research staff (research scientists, technicians, coordinators, etc), Yellow = faculty, Green = trainees (grad students, post-docs), Blue = clinicians.
dynamics. Data maintained by the U.S. Census Bureau, including the Longitudinal Business Database and the Longitudinal Employee Household Dynamics dataset, could potentially be matched to STAR METRICS using DUNS numbers. Such linkages might enable new and more accurate estimates of the direct and indirect economic impacts of federal R&D spending on university campuses, but substantial work would be required to match the data, and a quick examination of vendor and subcontractor files for a single university suggests that data quality issues may pose substantial obstacles to this linkage (see the next section on data quality).
At the level of federal awards, unique grant numbers included in each file could be used to connect payments to general scientific topics. A government subcontractor’s postprocessing of STAR METRICS data associated topic models derived from NSF grant abstracts with STAR METRICS records for NSF-funded research. Research.gov maintains an award-level database for all NSF awards by fiscal year that includes the institutional DUNS number and the unique NSF grant identifier. Other information included in this database is the congressional district of the awardee, the specific unit within NSF that funded the award, and the complete abstract at the time of submission. We were unable to determine how complete or effective such a linkage would be. Assuming that linkages to databases such as those found in Research.gov are sufficiently complete and accurate, postprocessing using, say, text analysis might enable understanding of the subdisciplines in science, technology, engineering and mathematics (STEM) that attract the most funding in a given year. For NIH grants, Owen-Smith undertook a pilot effort to link STAR METRICs grant numbers from a single university to publicly available data for NIH (unpublished data). This linkage allows NIH Research Condition and Disease Categorization codes to be associated with STAR METRICS records. Data quality issues discussed below may raise concerns for larger-scale matching efforts. However, Figure A-2 demonstrates some of the possibilities inherent in linking topic areas to STAR METRICS information by emphasizing the type of research being conducted for a small subset of the public university collaborative network presented in Figure A-1.
Associating topics and disease areas with STAR METRICS data could allow more fine-grained analyses of the productivity of particular areas of research, the portfolios of universities or federal agencies, and the organization of interdisciplinary R&D. In Figure A-2, red nodes represent research staff, and yellow nodes represent faculty. The research group highlighted by the blue oval at the top of the inset is pursuing work related to behavioral correlates of disease and death, while the group highlighted by the blue oval at the bottom works on HIV/AIDS vaccines. They are bridged by a team (highlighted by the red square) with grants for studies of liver cancer and organ transplants. The connection
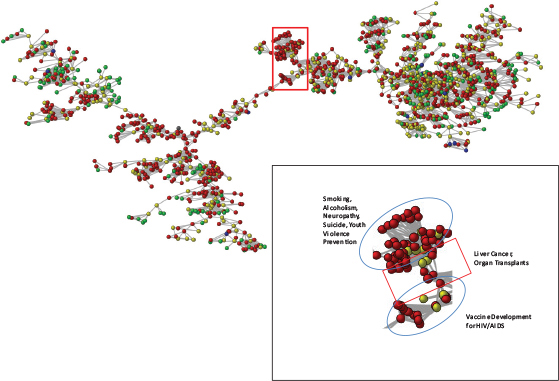
FIGURE A-2 Public university STAR METRICS network with National Institutes of Health Research Condition and Disease Categorization topic inset.
NOTE: Red = research staff (research scientists, technicians, coordinators, etc); Yellow = faculty; Green = trainees (grad students, post-docs); Blue = clinicians.
makes scientific sense as both alcoholism and hepatitis (common among at-risk youth) and HIV/AIDs are associated with liver cancers. Mapping the collaborative space of universities in such a fashion might provide new insights into different interdisciplinary research arrangements and thus offer improved possibilities for evaluating or seeding research projects with particular goals and targets. Cleaned grant numbers could in principle be linked (through for instance, acknowledgments of funding in publications or declarations of government interest in patents) to downstream scientific outputs and potentially to products or treatments. However, the process of that linkage would not be straightforward and could raise confidentiality issues.
Finally, university names could be used to link to existing federal R&D databases such as the NSF surveys of research expenditures or information on STEM degree completions. These linkages could, in principle, make it possible to ask and answer interesting questions about the effects of differently structured collaboration networks on the broad education and research functions of universities. A pilot effort to accomplish these very linkages supports discussion below of the extent to which current STAR METRICs data cover federal R&D expenditures and STEM degree completions.
While there are other sources of funding information, including, for example, National Patterns of R&D Resources, maintained and collected by NSF’s National Center for Science and Engineering Statistics (NCSES), we do not discuss these in any detail. National Patterns has the advantage of relying on nationally representative samples and even censuses of institutions that receive funding from federal sources. Because this and other databases are designed with different goals in mind, however, R&D expenditure information is reported in formats that may not be compatible with STAR METRICS formats. For example, National Patterns focuses on institutions rather than disciplines, and funding information is aggregated accordingly. The timeliness of the reports is another challenge for these large national databases.
QUALITY OF THE DATA
Data Coverage of R&D Expenditures and STEM Workforce
To provide a preliminary assessment of the coverage of the STAR METRICS Level 1 data, we have attempted to determine roughly how representative STAR METRICS universities are of federal R&D performed by universities and of all (2-year, 4-year, and graduate-level) STEM degrees. We take the former to be suggestive of the extent to which STAR METRICS as it currently stands provides good coverage of R&D efforts on campus,
while the latter offers some insights into the extent to which these data might be useful for addressing broad questions related to the scientific workforce and its training.
The NSF Survey of Research and Development at Universities and Colleges reports data on 893 campuses that spent federal R&D money in 2011. Of those campuses, 65 (7.27 percent) are currently enrolled in STAR METRICS. In total, NSF data report that $40.764 billion was spent. Of that amount, $15.712 billion (38.54 percent) was spent on campuses that are enrolled in STAR METRICS. Expenditure data are highly skewed. Table A-2 shows the top 25 campuses by federal R&D expenditures in 2011. These institutions accounted for 38.7 percent of all federal R&D expenditures. Fourteen of the institutions in Table A-2 are enrolled in
TABLE A-2 Top Twenty-Five Universities by Federal R&D Expenditures, 2011
| University (NSF Standardized) | Federal Expenditures | |
| Johns Hopkins University | 1,884,025 | |
| University of Washington, Seattle | 950,293 | |
| University of Michigan All Campuses | 824,752 | |
| University of Pennsylvania | 707,051 | |
| University of Pittsburgh All Campuses | 662,471 | |
| Stanford University | 656,114 | |
| Columbia University in the City of New York | 645,233 | |
| University of California, San Diego | 636,879 | |
| University of Colorado All Campuses | 636,278 | |
| University of Wisconsin–Madison | 593,633 | |
| Duke University | 585,262 | |
| University of California, San Francisco | 570,116 | |
| University of California, Los Angeles | 563,560 | |
| University of North Carolina at Chapel Hill | 561,708 | |
| Harvard University | 543,097 | |
| Yale University | 519,844 | |
| University of Minnesota All Campuses | 498,488 | |
| Ohio State University All Campuses | 493,130 | |
| Massachusetts Institute of Technology | 489,080 | |
| Cornell University All Campuses | 476,583 | |
| Pennsylvania State University All Campuses | 472,693 | |
| Washington University | 469,490 | |
| Vanderbilt University | 458,173 | |
| University of Southern California | 453,283 | |
| Georgia Institute of Technology All Campuses | 427,867 | |
| Total | 15,779,103 | |
NOTES: Expenditure data in thousands of constant 2000 dollars; STAR METRICS campuses in italics; R&D = Research and Development
SOURCE: National Science Foundation (2009).
TABLE A-3 Top Twenty-Five Campuses by Total (2-year, 4-year, and graduate) STEM Graduates
| University (NSF Standardized) | Number of Graduates | |
| University of Phoenix | 21,050 | |
| Community College of the Air Force | 7,223 | |
| University of Florida | 6,348 | |
| Ivy Tech State College Central Office | 5,801 | |
| Pennsylvania State University Main Campus | 5,728 | |
| Ohio State University Main Campus | 5,370 | |
| University of Michigan, Ann Arbor | 5,310 | |
| Purdue University Main Campus | 5,241 | |
| Texas A&M University Main Campus | 5,053 | |
| University of Washington-Seattle | 4,965 | |
| University of Minnesota-Twin Cities | 4,956 | |
| University of Illinois at Urbana–Champaign | 4,594 | |
| University of Wisconsin–Madison | 4,412 | |
| ECPI College of Technology | 4,403 | |
| University of California, Berkeley | 4,329 | |
| University of Southern California | 4,262 | |
| University of California, Los Angeles | 4,209 | |
| University of California, San Diego | 4,195 | |
| University of Texas at Austin | 4,165 | |
| University of Central Florida | 4,091 | |
| Michigan State University | 3,974 | |
| North Carolina State University at Raleigh | 3,918 | |
| Georgia Institute of Technology Main Campus | 3,888 | |
| Arizona State University Main Campus | 3,747 | |
| University of California, Davis | 3,696 | |
| Total | 134,928 | |
NOTES: STAR METRICS campuses in italics; STEM = Science, Technology, Engineering, and Mathematics.
Source: National Center for Education Statistics (2014).
STAR METRICS. Those 14 account for 61.1 percent of all federal expenditures by STAR METRICS campuses. They are highlighted in italics.
A similar examination of STEM degree completions suggests that STAR METRICS may be less effective for the analysis of broad scientific workforce questions. This, however, is to be expected given the dataset’s overt focus on federally funded R&D expenditures. NCSES reports that 2,747 U.S. institutions issued at least one 2-year, 4-year, or graduate degree in a STEM field in 2011; in total, 1,156,521 such degrees were issued. Fifty six STAR METRICS campuses were among those that issued STEM degrees, producing some 80,501 STEM graduates, or 6.96 percent of the total. Table A-3 presents a list of the top 25 campuses by STEM completions in 2011. Once again, STAR METRICS campuses are italicized. Eleven
of the top 25 campuses are enrolled in STAR METRICS. However, our choice to focus on the broadest possible definition of the STEM workforce makes this a conservative test as the list includes both community colleges and large for-profit universities. The 11 STAR METRICS campuses that were among the top 25 in 2011 produced 56,561 STEM graduates.
Data Quality
In a conversation with George Chacko, we learned that validating the quality of STAR METRICS data is a key concern for NIH and other federal agencies. Data quality concerns include not only evaluation of the data’s completeness and accuracy, but also assessment of the methodology used to construct some of the variables in the database. One important goal of STAR METRICS is to estimate the impact on employment that can be attributed to federal spending on the sciences. To calculate employment, NIH makes choices about inputs and assumptions. Are those choices the most appropriate, or can they be improved? While a lack of access to STAR METRICS data and a lack of resources precluded our conducting a thorough analysis of data quality, our preliminary work provides some useful hints. We focus here on key variables for data linkage in the files of a single public university. As of this writing, we were unable to determine how representative these patterns are of other campuses.
Some potentially serious challenges posed by the STAR METRICS data include the following:
- Individual identifiers are university specific and constructed using local rules, so it is impossible to track faculty or students as they move across campuses or from universities to other research institutions. Also impossible is linking individuals to external sources of information on, for example, business initiations (unless they can be linked to university-based incubators using institutional DUNS numbers). This limitation in following individual professional paths is also noted below in the section on user experience.
- The STAR METRICS data provided by universities do not indicate disciplines, departments, or schools associated with the awards. It might be possible to address this limitation in postprocessing if DUNS numbers and unique grant identifiers could be used to link the data to more detailed award information, such as that available in Research.gov for NSF funding and in NIH’s RePORTER for NIH and other funding agencies. If these linkages could be carried out effectively and accurately, detailed discipline and sub-discipline information associated with awards could be used to complement the STAR METRICS data.
-
Data quality problems in files for a single university campus suggest that such linkages could prove challenging, however. For instance, of the 14,907 transactions listed in one quarter’s vendor file for a public university, 146 records lack any identifiers, and 10,021 replace DUNS numbers with U.S. or foreign zip codes. Thus only 4,740 records (31.8 percent) have potentially viable DUNS numbers. While there is no way to establish how much error occurs in reporting these numbers, better-quality data are necessary to support systematic matching using DUNS numbers at the organizational level.
Similarly, Owen-Smith’s pilot effort to link STAR METRICS data for a single campus to NIH RePORTER information using NIH grant numbers suggests that accomplishing similar linkages at scale would be challenging but possible. Of 2,270 records of NIH grants that paid wages, 383 (16.8 percent) report NIH grant numbers that are unusable. Because of duplicate entries, the remaining 1,887 records resolve to 1,832 unique and potentially usable grant numbers. Of those, 1,172 (63.9 percent) match grant numbers listed in the NIH RePORTER system. If the university whose data we were able to access is characteristic, systematic linkages through grant numbers is likely to be an easier task than organization-level matching using DUNS numbers. - Quarterly panels may be inappropriate for many types of analyses, so an important question is what kind of protocol might be used to aggregate quarterly information into annual panels. Transitioning from quarterly to annual panels might appear to be straightforward, but there are different approaches to doing so that have different advantages and limitations. The selected protocol would have to consider such issues as adjustment for missing quarterly data (or even imputation of missing information) and attenuate the potential impact of such factors as different starting and ending dates for fiscal years both for research institutions and funding agencies.
ACCESS AND USER EXPERIENCE
We had a productive conversation with Jim Onken from NIH’s Office of Extramural Research and George Chacko. While STAR METRICS is up and running, and more institutions are being recruited all the time, the two main concerns at present are (1) the development of protocols for data access and (2) the data quality issue discussed above.
The STAR METRICS team is committed to developing data access protocols that allow as much access as possible while not violating data
privacy or the confidentiality of information provided by reporting institutions. This is currently the subject of much discussion at NIH and NSF (and other participating agencies), but a policy is not expected to be in place any time soon. Thus at the moment, data access is limited, and the shape of an eventual data sharing policy is not clear. It may be that access to information that can be linked to specific institutions will require individual memorandums of understanding between data users and data providers. The use of deidentifiers and other masking techniques is probably not a viable alternative in that many data users would need to know enough institutional characteristics as to render almost all such techniques useless. Requiring researchers to negotiate access to data on a university-by-university basis would create significant, perhaps insurmountable barriers to the sorts of systematic comparative research that we propose above.
Data quality and validation of the methods used to calculate new variables are another critical concern. The STAR METRICS team would welcome ideas on how to establish an independent steering committee that would operate externally to STAR METRICS and would offer critical guidance on how to address the issue of the quality of data and methods. At present, no such body exists. This fact, coupled with a lack of access to data by almost everyone, has seriously impacted any efforts to evaluate the quality of the data contained in STAR METRICS.
A committee member spoke with potential users of STAR METRICS at a large federally funded research and development center (FFRDC) to understand the user perspective with regard to the utility and usability of the data. At present, this particular set of users believes that the first phase of STAR METRICS is focused too narrowly on the impact of grant funding on direct employment. They suggest that difficulties with data access and the need to reach agreements with individual reporting units, together with the narrow impact focus, greatly limit the usefulness of the database. More generally, FFRDC users often need to think of the impact of research funding from different perspectives, something that is difficult to do with the STAR METRICS database at this time. Improvements these users would like to see in STAR METRICS are the capability to link to other data sources (e.g., award-level information) and to carry out text analyses on the “broader impact” sections of funded proposals.
To better understand the point of view of the FFRDC users, it may be useful to think about the ways in which STAR METRICS might help answer such questions as those listed below, which are given as examples of the types of investigation that are often carried out at nonuniversity, not-for-profit institutions such as an FFRDC:
- Innovation-centered analysis—How has federal funding contributed to innovation? Consider an area such as cardiology, and identify the most important innovations in that area over the past 20 years. How were those innovations funded? What was the role of the federal funding agencies? What were critical steps in the development of the innovation, and would some of those intermediate products/ideas not have occurred except for the funding that was available at the right time? These are difficult questions because none of the existing databases (including STAR METRICS) are organized in a way that permits product- or innovation-centered focus.
- Researcher-centered analysis—How and in what form have federal investments in research impacted the professional path of researchers and their students? As discussed earlier, this type of analysis is currently impossible, mainly because researchers do not have unique identifiers that can be used to trace them during their professional lifetime. For example, it is impossible to gather information about a person’s history of awards and other accomplishments (except by hand) or to understand that person’s downstream impact in the form of his or her students’ own accomplishments.
- Agency-centered analysis—What is NSF’s contribution to the development of the 3D printer? To attempt to answer this type of question, one can look at patents and publications that are related to the 3D printer. Even if this information were easily accessible, however, it would not enable linking specific grants or even specific agencies causally to a discovery. Yet these questions of causal involvement arise often.
The FFRDC users we consulted are not naïve and fully understand that the questions they ask are complex and perhaps even ill posed. But some of the points they raised—such as the lack of unique identifiers for researchers—appear to be broadly applicable. The other issue that arose repeatedly is the need for STAR METRICS to be readily linkable to other databases so users can carry out analyses that may not have been contemplated by the STAR METRICS developers.
REFERENCES
National Center for Education Statistics. (2014). Integrated Post-Secondary Education Data System, 2013-2014. Available: https://surveys.nces.ed.gov/ipeds/ [May 2014].
National Science Foundation. (2009). Survey of Research and Development Expenditures at Universities and Colleges. Available: http://www.nsf.gov/statistics/srvyrdexpenditures/ [May 2014].
Weinberg B., Owen-Smith, J., Rosen, R.F., Schwarz, L., McFadden Allen, B., Weiss, R.E., and Lane, J. (2014). Science funding and short-term economic activity. Science, 344(6179), 41-43.


