
with airports that would not otherwise receive ATC at their towers, and six were used by the Air National Guard (see OIG 2012) under a special agreement with the Department of Defense. These towers are distributed throughout the United States; about one-fourth are located in three states (California, Florida, and Texas). Contract towers have attracted interest in the context of ATC staffing discussions because they cost significantly less to operate than low-activity FAA towers (see, for example, OIG 2012). Later chapters of this report provide comparisons between low-activity FAA towers and contract towers in terms of safety (Chapter 2) and cost (Chapter 6).
Evolving Demands of Industry Sectors
Different industry sectors require different services within the NAS. Air carriers operating under Federal Aviation Regulations (FAR) Part 121 and air taxis and commuters operating under FAR Part 135 dominate operations at large airports and their TRACONs and through en route centers. In contrast, small “general aviation” aircraft subject to FAR Part 91 often operate out of smaller towers, and many of their flights do not interact substantially with the TRACON and en route center facilities. However, many general aviation operations involve aircraft without ground-based corporate dispatch services or onboard weather detection systems and thus depend heavily on the various support functions a controller can provide, workload and resources permitting. There may also be differences in the levels of ATC support needed within the air carrier and the air taxi and commuter categories. Under normal circumstances, for example, an experienced air transport pilot is likely to require less support than an inexperienced pilot of a smaller aircraft.
The demand for air traffic services is evolving. The total number of ATC operations4 declined by 21 percent from its high in 2000 to 2012 in response to a number of events. However, this aggregate number masks differences between industry segments (see Figure 1-4). The decline in general aviation operations has been particularly marked, while air carrier and air taxi and commuter operations have experienced more modest declines.
The decline in ATC operations has not been the same across all facility types. Figure 1-5 shows total ATC operations by facility type from 1994 to 2012. From 2000 to 2012, tower operations declined by 15.1 million (22 percent) and TRACON operations declined by 13.8 million (27 percent), whereas ARTCC operations declined by 5.4 million (12 percent). During the early part of this period, there were more operations at TRACONs than at ARTCCs; from 2005 on, there have been more operations at ARTCCs. The committee’s analysis of the change in operations at each type of facility by industry segment shows that the drop in total ATC operations has been largely the result of a drop in general aviation operations. This drop has been especially pronounced at towers and significant at TRACON facilities but has not been a major factor at ARTCC facilities. (ARTCCs have also experienced a drop in operations requested by military flights.)
____________
4 ATC operations consist of tower operations, TRACON operations, and center aircraft handled. A tower operation is a takeoff, landing, or overflight. The term includes so-called touch-and-go’s, in which a plane touches down and immediately becomes airborne again. TRACON operations consist of itinerant flights (to or from an airport under the TRACON airspace) and overflights (aircraft passing through the TRACON airspace but not landing at any airport in the TRACON’s coverage area). Center aircraft handled is the number of ARTCC en route IFR departures multiplied by two, plus the number of en route IFR overflights. An IFR departure is an en route IFR flight that originates in an ARTCC’s area and enters the center’s airspace. An IFR overflight is an en route IFR flight that originates outside the ARTCC’s area and passes through the area without landing (personal communication, Arthur Furnia, FAA, August 27, 2013).
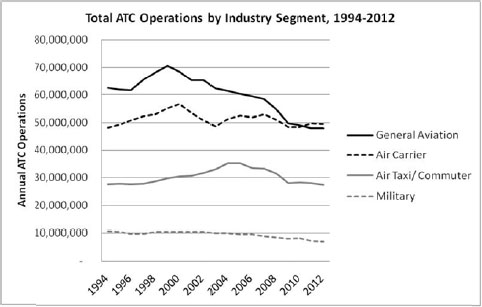
FIGURE 1-4 Total ATC operations by industry segment, 1994–2012. [SOURCE: FAA Air Traffic Activity Data System (http://aspm.faa.gov/opsnet/sys/Main.asp?force=atads).]
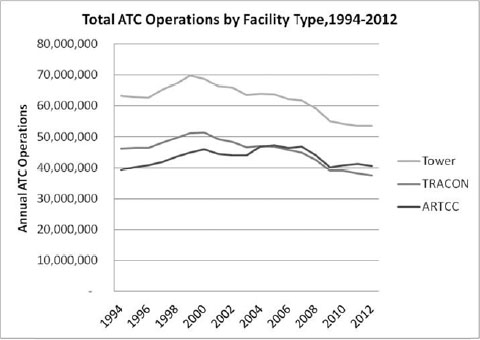
FIGURE 1-5 Total ATC operations by facility type, 1994–2012. [SOURCE: FAA Air Traffic Activity Data System (http://aspm.faa.gov/opsnet/sys/Main.asp?force=atads).]
Establishing levels of controller staffing is not an exact science. There are no explicit quantitative methods for calculating the number of controllers needed to provide safe air traffic services other than information from historical trends, and there is no developed or agreed-on measure of the true staffing requirement in the United States or in other countries. Australian Civil Aviation Safety Regulations, for example, do not provide explicit guidance on how to
determine the number of operational staff needed to provide air traffic services (Harfield 2013). Likewise, National Air Traffic Controllers Association (NATCA) representatives who attended the committee’s first meeting noted the absence of an objective, science-based method for establishing controller staffing standards independent of political and other influences.
Safety is the overarching requirement for ATC. Data from the National Transportation Safety Board show that ATC errors, including omissions, have not been a major cause of aviation accidents in the past, which indicates that current controller staffing levels are safe, at least in the aggregate. (Chapter 2 notes potential areas for safety improvements, particularly for general aviation.) However, the relationship between safety levels and controller staffing is not understood; key metrics have not been defined and appropriate data have not been collected or analyzed to identify whether staffing levels are near the limit required to maintain this safety level.
The impact of controller staffing on both safety and performance is further complicated by FAA’s ability to limit the number of operations it allows within the airspace. For example, a perceived shortfall in staffing may lead the agency to decide against opening a sector to accommodate more traffic during busy periods. Such action ensures the continued safe operation of the NAS, but at the expense of a degradation of performance in the form of flight delays and possible cancellations. As the example illustrates, the impact of controller staffing on safety is carefully managed during day-to-day operations. This operational response to staffing can affect performance of the NAS, but it is not the only driver of NAS performance. Flight delays, for example, may be attributed to inadequate controller staffing levels, but they arise regardless of staffing levels when the layout of sectors, routes, and runways prevents the airspace from handling more traffic. As discussed in the preceding section, a further complication in assessing performance is the diversity of air traffic services FAA must provide that would require both measures of airspace throughput in the broad sense and measures of benefit to each aircraft—for example, the ability to provide more fuel-efficient routings.
Thus, there are no broadly applicable criteria for the NAS that can relate staffing to safety, to performance measures of the airspace throughput, and to measures of benefit to the aviation community simultaneously. Development of such criteria would require weighting between measures of safety (or some “safety margin”) and performance and between performance measures of importance to different users of the airspace. As indicated by the committee’s discussions with various parties—FAA, NATCA, aviation industry representatives, and so forth—there is no clear consensus on what these values should be. All agree, however, that safety has priority over other goals.
All of these concerns are compounded by uncertainty with regard to the size of the controller workforce itself: while a controller may retire on short notice, a new hire can take up to 3 years to qualify into a facility. Thus, staffing levels often reflect not only the controllers required to staff positions now but also the trainees who are brought into the system in advance of expected retirements. The degree of flux in controller staffing is illustrated by the following: at the end of FY 2012 the FAA controller total workforce of 15,0635 comprised 11,753 CPCs (78 percent of the workforce, of whom just over one-fourth are eligible to retire), 1,143 CPC-ITs (8 percent of the workforce), and 2,167 developmentals in training (14 percent of the workforce). The 1981 Professional Air Traffic Controller Organization strike and subsequent firings created a situation in which retirement eligibility peaked as a large proportion of the controller workforce reached retirement age within the span of a few years. FAA data indicate that the latest
____________
5 The 148 trainee controllers at the FAA Academy are not included in this head count.
retirement wave has now passed its high-water mark, and under current hiring plans the intent is to “spread out the retirement eligibility of the current wave of new hires and reduce the magnitude of the retirement eligibility peak in future years” (FAA 2013b, 30).
Like all air navigation service providers (ANSPs), FAA faces several challenges in determining the appropriate controller staffing needs to ensure the safe operation of the NAS in a cost-effective manner. A report from the Civil Air Navigation Services Organization (CANSO) summarizes the issues as follows:
One of the unique limitations of air navigation service provision, as compared to other industries, revolves around the difficulty in staffing to demand. ANSPs cannot quickly respond to changes in traffic as the development of new [controllers] requires somewhere between two to three years of training often with high failure rates…. while traffic may suddenly dip (or drop) due to external factors—economic downturns, extreme weather conditions, a terror event—the [controller] workforce cannot be right-sized accordingly. ANSPs cannot quickly or easily reduce that workforce … [controllers] are not particularly mobile as a move requires learning new sectors or areas, another lengthy training process. (CANSO 2012, 10)
FAA’s staffing process involves several steps spanning various organizations within the agency. The first step seeks to model, as far as possible, the number of controllers required on position at each facility to handle current and forecast traffic demand and then to convert the outcome to the number of controllers needed on staff at each facility, with scheduling and other constraints being taken into account. The resulting model-based “staffing standard” is then an input into a broader process in which input from the field6 and productivity data are considered in identifying a “staffing range” for each facility. Staff planning examines transfers and hiring, and these plans are executed.
For more than 50 years, FAA has developed and applied staffing standards (models) to help establish staffing requirements for its ATC facilities. Over this period, independent groups, including the Transportation Research Board (TRB), have scrutinized the data sources and methods used by FAA. A 1997 report, for example, recommended an approach that combines formal modeled predictions with less formal methods based on expert judgment concerning staffing requirements at individual facilities (TRB 1997). That report noted that controller workforce planning is not a one-size-fits-all problem and observed that national planning needs to recognize features specific to individual ATC facilities. A more recent report reviewed the task load “complexity model” used in generating staffing standards for en route facilities and offered advice on “ways to improve the modeling process going forward” (TRB 2010, 6).
In the committee’s judgment, the efficacy of the entire process needs to be judged by the extent to which the plans result in the right staffing at all of FAA’s air traffic facilities. Thus, subsequent staffing plans governing the hiring, training, and transfer of controllers and the extent
____________
6 As used in this report, “the field” designates any facilities outside of FAA headquarters.
to which they are properly executed must be considered, not merely the specific model used in generating the staffing standards or the correctness of the staffing ranges.
As stipulated in Section 608 of the FAA Modernization and Reform Act of 2012, this project will study “the air traffic controller standards used by the [FAA] to estimate staffing needs for FAA air traffic controllers to ensure the safe operation of the national airspace system in the most cost effective manner.” The project “shall consult with the exclusive bargaining representative of employees of the FAA certified under section 7111 of title 5, United States Code, and other interested parties, including Government and industry representatives.” The study shall include
(1) An examination of representative information on productivity, human factors, traffic activity, and improved technology and equipment used in air traffic control;
(2) An examination of recent [National Research Council] reviews of the complexity model performed by MITRE Corporation that support the staffing standards models for the en route air traffic control environment; and
(3) Consideration of the Administration’s current and estimated budgets and the most cost-effective staffing model to best leverage available funding.
Conversations involving TRB staff and congressional staff provided the committee with further guidance on its task. In particular, Congress’s main interests are whether the forecasts from FAA’s staffing model (a) are reliable at the national level for the purpose of future budgeting and (b) incorporate cost-effective strategies for staffing that align future labor costs with anticipated appropriations. Consistent with this focus on budgetary concerns, congressional staff also asked the committee to investigate FAA’s controller staffing process from planning through execution, rather than focusing exclusively on the staffing standards (models).7
As discussed earlier, controller staffing affects not only safety but also the performance of the air traffic services provided in the NAS. This report focuses primarily on safety for four reasons: (a) the charge explicitly mentions safety; (b) confounding factors such as airspace structure and operational procedures complicate efforts to isolate the impacts of controller staffing on performance beyond the current state of the art in modeling airspace; (c) these confounding factors are themselves expected to change with ongoing initiatives, such as the Next Generation Air Transportation System; and (d) widely accepted performance metrics relevant to all industry segments and all types of ATC facility remain to be defined. Thus, relating performance to staffing is left as a subject for further study that will require both policy decisions to define performance metrics and clarification of how air traffic will be operated in the Next Generation Air Transportation System.
Congressional staff also expressed particular interest in comparisons between the approaches to controller staffing taken by FAA and by ANSPs in other countries. As noted in the
____________
7 As noted in the Preface, FAA’s definition of staffing standards is limited to the models relating controller workload and air traffic activity and does not include adjustments to the modeled output or implementation of the resulting staffing plan.
Preface, four ANSPs (Airservices Australia, Nav Canada, Deutsche Flugsicherung in Germany, and National Air Traffic Services in the United Kingdom) provided the committee with white papers on their staffing processes. The papers, together with discussions with representatives of these ANSPs, provided valuable insights into specific aspects of controller workforce planning and execution, such as the implementation of fatigue risk management systems and of new, more sophisticated scheduling software. The lessons learned from the interactions with ANSPs are referenced in relevant sections of this report. In identifying these lessons, the committee was mindful of differences in labor laws and in the type and volume of air traffic services provided that raise questions about the transferability of ATC staffing practices from one nation to another.
Different ANSPs operate in different settings and serve diverse constituencies, which complicates efforts to compare performance indicators, such as controller productivity (CANSO 2012). Factors affecting performance include, but are not limited to, type of ownership (government agency, state-owned agency, or private company), regulatory environment, traffic levels and complexity, and range of services provided. The committee also noted that metrics such as number of ATC operations may be counted differently in different countries, further complicating efforts to establish robust comparisons.
The committee found that highly aggregate systemwide data do not provide an accurate picture of trends in controller productivity, as discussed in Chapter 7. Thus, the comparisons of controller productivity at different ANSPs presented in a recent report from CANSO should be interpreted with caution. FAA’s controller productivity for IFR flight hours in continental operations was found to be among the highest reported by CANSO members, but the report notes that this productivity indicator can be influenced by volume of traffic and by size and complexity of airspace (CANSO 2012). It also warns of the need to “avoid taking specific metrics in isolation without considering the broader context of the environment in which an ANSP operates” (p. 9). A recent comparison of U.S. and European air navigation systems illustrates this point. It notes that, while the two systems are of similar size, “the European system handles fewer flights … and is more labor intensive than the American system” (Button and Neiva 2013, 2). The differences are attributed to a number of technical reasons but also, in particular, to the lack of coordination among European systems, with the small size of many of these systems preventing economies of scale. Thus, the differences in productivity reflect institutional constraints and airspace design issues rather than controller productivity per se.
The committee explored the possibility of comparing staffing levels at other countries’ ATC facilities similar in size and function to selected U.S. ATC facilities but was unable to obtain the necessary data from ANSPs.
In the aggregate, FAA’s staffing process spans all operational facilities and several offices creating national plans. Such a process must be complex and have the ability to account for myriad concerns. However, in the committee’s view, the inherent complexity does not relieve FAA of the responsibility of making staffing decisions that are transparent and as consistent as possible with established data, science, and documented practices. Throughout its activities, the committee recognized the value of consistent and transparent staffing decisions in FAA’s ability to engage the controller workforce effectively and to substantiate staffing decisions to the aviation industry and to taxpayers.
Chapter 2 examines the role of ATC in aviation accidents and incidents and identifies opportunities for developing a better understanding of the relationships between ATC staffing and aviation safety. It compares the safety of low-activity FAA towers and contract towers and discusses concerns about the adverse impacts of fatigue on controller performance and possible fatigue mitigation strategies. The chapter concludes by examining the implications of a robust FAA safety culture for controller staffing. In particular, the need for improved data collection and analysis for better understanding of the relationship between staffing and safety and the value of further involvement of controllers in reporting and safety improvements are noted.
Chapter 3 reviews the formal staffing models and the overall process used by FAA in estimating the number of controllers needed to staff its ATC facilities. Key features of the models used for towers, TRACONs, and en route facilities are summarized, and their strengths and weaknesses are identified. The chapter provides an overview of FAA’s traffic forecasting methods.
Chapter 4 examines staffing levels at FAA’s ATC facilities relative to FAA’s staffing ranges. It reviews the hiring and staffing plans developed to manage the staffing at each facility and how, and how well, FAA executes these plans. Several potential strategies targeting concerns with regard to getting the right staff to the right facility are suggested.
Chapter 5 considers the implications of FAA’s Next Generation Air Transportation System for controller staffing and discusses the role of the controller in the development and fielding of system technologies.
Chapter 6 presents current and estimated future budgets for ATC staffing and discusses current and anticipated revenue streams. The chapter identifies the pros and cons of policy options that might allow FAA to cut costs without commensurate reductions in ATC services.
Each of Chapters 2 through 5 concludes with findings and recommendations addressing the chapter’s content. Chapter 7 summarizes key insights from the preceding chapters and presents the committee’s major recommendations.
REFERENCES
Abbreviations
| CANSO | Civil Air Navigation Services Organization |
| FAA | Federal Aviation Administration |
| OIG | Office of Inspector General, U.S. Department of Transportation |
| TRB | Transportation Research Board |
Button, K., and R. Neiva. 2013. Single European Sky and the Functional Airspace Blocks: Will They Improve Economic Efficiency? Journal of Air Transport Management, Vol. 33, pp. 73–80.
CANSO. 2012. Global Air Navigation Services Performance Report 2012 (2007–2011 ANSP Performance Results).
FAA. 2013a. Integration of Civil Unmanned Aircraft Systems (UAS) in the National Airspace System (NAS) Roadmap, 1st ed. http://www.faa.gov/about/initiatives/uas/media/UAS_Roadmap_2013.pdf.
FAA. 2013b. A Plan for the Future: 10-Year Strategy for the Air Traffic Control Workforce, 2013–2022. http://www.faa.gov/air_traffic/publications/controller_staffing/media/CWP_2013.pdf.
Harfield, J. 2013. Airservices Australia’s Air Traffic Control Staff Resource Planning and Management. White paper prepared for the committee, June. Available on request from the Public Access Records Office of the National Academies (e-mail paro@nas.edu).
OIG. 2012. Contract Towers Continue to Provide Safe and Cost-Effective Services, but Improved Oversight of the Program Is Needed. AV-2013-009.
TRB. 1997. Special Report 250: Air Traffic Control Facilities: Improving Methods to Determine Staffing Requirements. National Research Council, Washington, D.C.
TRB. 2010. Special Report 301: Air Traffic Controller Staffing in the En Route Domain: A Review of the Federal Aviation Administration’s Task Load Model. National Academies, Washington, D.C.
Aviation Safety and Controller Staffing
Air traffic controller staffing affects safety. This chapter examines the aviation safety record in the United States, the role that accidents related to air traffic control (ATC) play in that record, and how aviation safety data might be analyzed to shed light on the relationships between air traffic controller staffing and aviation safety. A discussion of the Federal Aviation Administration’s (FAA’s) Federal Contract Tower Program follows, along with an evaluation of safety comparisons between low-activity FAA towers and contract towers. The chapter describes known best practices in scheduling to address concerns with regard to fatigue as identified in the United States and by other air navigation service providers (ANSPs) and the International Civil Aviation Organization (ICAO). Implementing such practices could require adjustments in how a controller staffing plan is executed and perhaps in staffing levels. Finally, the chapter addresses concerns in establishing and maintaining a “safety culture” in which staffing levels must be sufficient for managing traffic and for enabling proper reporting and controller involvement in safety management and in which the appropriate data are collected and used in the planning and implementation of controller staffing.
INDICATORS OF THE RELATIONSHIPS BETWEEN CONTROLLER STAFFING AND AVIATION SAFETY
This section places ATC-related accidents1 in the context of all aviation accidents.2 It then considers how accident and incident data might be analyzed to help in understanding relationships between air traffic controller staffing and aviation safety.
Table 2-1 shows the total number of aviation accidents and the total number of ATC-related accidents from all causes in the United States between 1990 and 2012, by industry segment. Fatal accidents accounted for 20 percent of the more than 41,000 total accidents during the period. Air carriers accounted for less than 1 percent of fatal accidents, although these accidents corresponded to slightly more than 10 percent of aviation fatalities, which is likely due to the larger number of passengers per airplane associated with air carrier operations. Air taxis and commuters were responsible for approximately 5 percent of fatal accidents and for 8 percent of fatalities, and general aviation (GA) accounted for 94 percent of fatal accidents and for 82 percent of fatalities.
ATC was considered as either a cause or a factor by the National Transportation Safety Board (NTSB)3 in 66 fatal accidents, which corresponded to 249 fatalities over the 1990–2012 period—about 0.8 percent of all fatal accidents and 1.4 percent of all fatalities. ATC is
__________
1The committee considered ATC-related accidents to be those in which accident investigation by the National Transportation Safety Board found that air traffic control was either a “cause” or a “factor” in the accident.
2For official definition of terms, see 49 CFR 830.2—Definitions (http://cfr.regstoday.com/49cfr830.aspx).
3For purposes of the committee’s analysis, no attempt was made to distinguish the degree of involvement of ATC errors, including omissions, in the fatal accidents. Thus, the two NTSB categories, causes and factors, were combined.
TABLE 2-1 U.S. Aviation Accidents by Industry Segment and Injury Level, 1990–2012
| All Aviation Accidents | ATC-Related Aviation Accidents | |||||
| Injury Level | Total Fatalities | Injury Level | Total Fatalities | |||
| Industry Segment | Total Fatal | Total Nonfatala | Total Fatal | Total Nonfatala | ||
| Air carrier | 59 | 753 | 1,738 | 3 | 8 | 79 |
| Air taxi and commuter | 455 | 1,355 | 1,322 | 6 | 3 | 30 |
| GA | 7,772 | 30,940 | 14,148 | 57 | 25 | 140 |
| Total | 8,286 | 33,048 | 17,208 | 66 | 36 | 249 |
a The injury category “nonfatal” is the sum of serious injury accidents, minor injury accidents, and none (no injury) accidents.
SOURCE: National Transportation Safety Board Aviation Accident and Incident Data System accessed through FAA’s Aviation Safety Information Analysis and Sharing System.
considered vital to the safety of almost all aviation operations; thus, the small number of accidents in which ATC is considered a causal or contributing factor reflects the success of the ATC system in the aggregate.
The frequency of ATC-related accidents was not the same across all aviation industry segments. Table 2-2 shows the total number of ATC operations, the number of ATC-related fatal accidents, and ATC-related fatal accident rates, by industry segment. Clearly, GA has been responsible for more fatal ATC-related accidents than have air carriers and air taxis and commuters combined. In addition, the rate of fatal ATC-related accidents per 10 million ATC operations has been much higher for GA than for commercial aviation (air taxis and commuters and air carriers).4 As with accidents from all causes, GA accounted for the majority of ATC-related accidents (86 percent of those accidents and 54 percent of fatalities).
Relatively simple analyses of accident data could offer useful insights into the nature of ATC-related accidents, as illustrated by the following discussion of loss of separation and single aircraft accidents. The committee’s intent here is not to conduct a definitive piece of original analysis but rather to highlight opportunities for gaining safety insights related to controller staffing from an examination of accident and incident data.
Discussions of ATC safety typically focus on maintaining safe separation between aircraft, although controllers are required to give first priority both to separating aircraft and to issuing safety alerts.5 For example, FAA’s tracking of ATC incidents that threaten safety focuses
__________
4The committee was unable to determine whether the distinction between air carriers and air taxis and commuters in the Air Traffic Activity Data System was precisely the same as the distinction between the aircraft operating under Part 121 and the aircraft operating under Part 135; thus, the committee reported the combined air carrier and air taxi and commuter numbers as “commercial aviation.”
5While the primary purpose of ATC is to prevent collisions between aircraft and to manage the flow of traffic, ATC is required to perform other controller safety functions, such as providing safety alerts and disseminating weather information. See FAA JO Order 7110.65, Section 2-1-2, Duty Priority, and Section 2-1-6, Safety Alert. https://www.faa.gov/air_traffic/publications/ATpubs/ATC/atc0201.html.
TABLE 2-2 ATC-Related Fatal Accident Rates and Accident Type by Industry Segment, 1990–2012
| ATC-Related Fatal Accidents | |||||
| Industry Segment | Total ATC Operations | Total ATC-Related Accidents | Fatal Accidents per 10 Million ATC Operations | Loss of Separation Accidents | Single Aircraft Accidents |
| Air carrier | 1,832,471,000 | 3 | 0.05 | 2 | 1 |
| Air taxi and commuter | 6 | 3 | 3 | ||
| GA | 1,378,570,000 | 57 | 0.41 | 15 | 42 |
| Total | 3,211,041,000 | 66 | 20 | 46 | |
SOURCE: Accident data are from NTSB’s Aviation Accident and Incident Data System accessed through FAA’s Aviation Safety Information Analysis and Sharing System. Total ATC operations are by calendar year and include all U.S. ATC operations as reported in the Operations Network Factbook Yearly Summary Report.
almost entirely on loss of separation; similarly, FAA’s risk analysis process within the Air Traffic Organization (ATO) deals exclusively with loss of separation events.6 However, as the data in Table 2-2 show, an important fraction of ATC-related fatal accidents did not involve aloss of separation. In the two rightmost columns of Table 2-2, ATC-related fatal accidents are divided into two categories: those involving a loss of separation, either between two aircraft (in the air or on the ground) or between an aircraft and another ground vehicle, and those involving a single aircraft in which the controller failed to provide required safety information or provided other types of inaccurate or inadequate information. For the aviation industry as a whole, loss of separation has not been the dominant cause of fatal ATC-related accidents. Only about 30 percent of fatal ATC-related accidents involved a lack of separation. The remainder involved single aircraft and controllers’ failure to provide weather information to pilots or failure to issue terrain alerts—such as minimum safe altitude warning alerts—or to issue other instructions, which put the aircraft in a hazardous situation.
The data presented in Table 2-2 suggest that failure to provide timely and accurate safety information is a cause or a factor for a large proportion of fatal ATC-related accidents, particularly for GA. The data suggest that FAA might benefit from giving more attention to the provision of information to pilots in addition to focusing on loss of separation. Analyzing accident and incident data could also be an important step for guiding future data collection.
__________
6“Standard Operating Procedures for the Quality Assurance Risk Analysis Process,” FAA Document AJI-12-RAPSOP05-F, provided by Rick Huss on January 17, 2014.
SAFETY OF FAA’s CONTRACT TOWER PROGRAM
FAA’s Federal Contract Tower Program began more than 30 years ago and offers an alternative business model for the delivery of ATC services at low-activity towers operating under visual flight rules. As noted in Chapter 1, FAA contracts with private-sector organizations7 for ATC services at its contract towers.8
Since 1998, the U.S. Department of Transportation Office of Inspector General (OIG) has released five reports evaluating numerous aspects of the Federal Contract Tower Program (OIG 1998; 2000; 2001; 2003; 2012a). In general, the OIG reports have found that contract towers provide ATC services at a lower cost than similar FAA towers, with little difference in the quality of services between FAA and contract towers. The OIG also found that “contract towers had a significantly lower number and rate of safety incidents compared to similar FAA towers” (OIG 2012a, 2). The committee, however, has reservations about this finding for the reasons discussed below.
The 2012 OIG report compares contract towers and FAA-operated towers with similar average traffic densities. The OIG used the numbers of operations and the hours of service for FY 2009 and FY 2010 to calculate the average traffic density9 for its population of 240 contract towers and 92 FAA towers and then matched a randomly selected sample of 30 contract towers to 30 FAA facilities with similar air traffic densities.10
Average traffic density is only one of several metrics characterizing the demands placed on controllers as they manage traffic. Other metrics that can influence controller workload include traffic complexity, types of users, and special geographical and meteorological features of an airport. In an effort to capture the various factors contributing to controller workload, FAA classifies its ATC facilities into nine levels, ranging from 4 to 12, with 12 being the most demanding. However, contract towers are not classified by level, which complicates efforts to establish pairs (or groups) of FAA-operated and contract towers with comparable air traffic demands.
The OIG’s method of matching average traffic densities is one approach for comparing towers, but other factors should be considered. As shown in Table 2-3, towers with similar average traffic densities can be assigned different levels by FAA. Furthermore, as shown in Table 2-4, average traffic density can vary by a factor of two or more among facilities at the same level. These observations raise questions about the extent to which the OIG was able to establish analogous groups of FAA and contract towers for purposes of safety comparisons.
All five OIG reports cited above consider the safety of contract towers by comparing the number or rate of safety incidents. In all cases, however, identifying real differences in rates of these safety incidents is challenging. The Government Accountability Office (GAO) concluded that “comparisons of operational error rates alone are not sufficient to draw conclusions about the relative safety records of air traffic control facilities” (GAO 2003, 3) and that “comparisons … among types of air traffic control facilities, such as FAA-staffed facilities versus contractor-staffed facilities, cannot be used alone to provide valid conclusions about safety due to three
__________
7Contract towers are operated by one of three companies. See http://www.contracttower.org/fctcontractors.html.
8As of January 2014, 252 facilities are in the contract tower program; see p. 10 of the following document for a complete list: http://www.contracttower.org/ctaannual/13CTAannual.pdf.
9The OIG defines density as the average number of operations at a tower per hour the facility is open (OIG 2012a, 4).
10For a more detailed description of its methodology, see OIG 2012a, p. 11, Exhibit A, Scope and Methodology.
TABLE 2-3 Levels of Selected FAA-Operated Towers with Similar Average Traffic Density
| Tower ID | Tower Name, State | Average Traffic Density | Level |
| SJU | San Juan Tower, Puerto Rico | 22.1 | 7 |
| GCN | Grand Canyon Tower, Arizona | 20.7 | 5 |
| ADS | Addison Tower, Texas | 20.2 | 5 |
| PHF | Patrick Henry Tower, Virginia | 19.8 | 6 |
NOTE: Density is defined as the average number of operations at a tower per hour the facility is open.
SOURCE: Adapted from OIG 2012a.
TABLE 2-4 Average Traffic Density for Selected Level 7 FAA-Operated Towers
| Tower ID | Tower Name, State | Average Traffic Density |
| TMB | Tamiami Tower, Florida | 37.3 |
| BED | Hanscom Tower, Massachusetts | 32.4 |
| SJU | San Juan Tower, Puerto Rico | 22.1 |
| TEB | Teterboro Tower, New Jersey | 17.5 |
NOTE: Density is defined as the average number of operations at a tower per hour the facility is open.
SOURCE: Adapted from OIG 2012a.
factors” (GAO 2003, 2). First, any differences in reporting practices between types of towers can raise questions about the completeness and accuracy of incident data. Since some errors are self-reported, controllers may not report all incidents, leading to underreporting (GAO 2003). FAA controllers voluntarily self-report information about operational errors through the Air Traffic Safety Action Program (ATSAP) beginning October 2010, without fear of reprisal. Contract towers did not have such a voluntary reporting program, although they were expected to implement one by December 31, 2012 (OIG 2012a). Second, any analyses of data would need to control for other factors that could affect the rate of operational errors, including age and experience of controllers, weather conditions, and traffic complexity. Third, low rates of operational errors make detection of real differences in error rates among facilities difficult (see GAO 2003, 2–3).
Impact of Fatigue on Safety
Fatigue is a risk factor for errors and accidents, and it is frequently encountered in operations that need to be sustained 24/7, like ATC. Fatigue can be broadly defined as “a physiological state of reduced mental or physical performance capability.” Numerous factors are known to induce or contribute to fatigue (ICAO 2011):
1. Acute sleep loss (i.e., being awake for a prolonged period of time),
2. Chronic sleep restriction (i.e., not getting enough sleep per 24 hours on a regular basis),
3. Circadian rhythm (e.g., working at night when the body is programmed to sleep or sleeping during the day when the body is programmed to be awake),
4. Low-quality sleep due to sleep fragmentation that is induced internally (e.g., by sleep disorders) or externally (e.g., by noise),
5. Sleep inertia (i.e., a period of reduced performance capability immediately after waking up),
6. Time on task (i.e., prolonged work periods without breaks),
7. High workload, and
8. Traitlike (i.e., likely genetic) interindividual differences in susceptibility to the above factors.
The safety of the National Airspace System depends on continuously high levels of controller performance. At the same time, the tasks of controllers can be complex and demanding, and they require a high level of attention. The latter is affected profoundly by sleep loss, circadian misalignment, and other fatigue-inducing factors (Lim and Dinges 2010; Lim and Dinges 2008). Several studies demonstrate the impact of fatigue on air traffic controller performance (for example, Schroeder et al. 1998; Signal and Gander 2007; OIG 2009). For these reasons, fatigue deserves special attention as a risk factor for air traffic controllers.
Rare but highly publicized incidents of controllers falling asleep on the job have drawn attention to the risks associated with controller fatigue.11 As a result of these incidents, night shifts with a single controller on duty are no longer permitted in most circumstances.12 Other prescriptive limitations on controllers’ work schedules and duty times, such as mandatory breaks and lunch periods and limits on the number of hours worked in a shift, aim to mitigate the risks associated with controller fatigue. Another result was the 9-hour rule, which requires controllers to have a minimum of 9 hours off duty preceding the start of a day shift. The intention of such actions is to improve safety by increasing controllers’ opportunities for nighttime sleep.
Despite recent policy changes such as the 9-hour rule and efforts to educate controllers about fatigue issues through a series of fatigue risk management bulletins,13 some controller schedules continue to raise concerns about fatigue. In particular, the counterclockwise rotating 2-2-1 schedule (shown in Figure 2-1) compresses the workweek and then allows controllers 80 hours off. Although the schedule, described in Box 2-1, is popular among controllers, it results in severely reduced cognitive performance during the midnight shift because of fatigue.
The extent to which fatigue has affected safety is impossible to address in view of the limited data collected in accident and incident reports. The treatment of potential fatigue concerns in such reports by FAA and NTSB has been variable, and important elements of information relative to fatigue are often not included. In view of the small number of safety
__________
11See NTSB Press Release (http://www.ntsb.gov/news/2011/110324.html); Scovel 2014, 10; OIG 2013a; and OIG 2009.
12Under certain conditions, single controllers are permitted on the midnight shift. See FAA JO 7210.3Y, 2-6-12c, effective date April 3, 2014 (http://www.faa.gov/documentLibrary/media/Order/JO_7210.3Y.pdf).
13FAA provided the committee with nine bulletins published so far. Among them are Fatigue Risk Management Bulletins No. 1: The 9-Hour Rule, published March 13, 2013; No. 2: 7 and 9 Hour Shifts, published April 8, 2013; and No. 3: Self-Declaration of Fatigue, published April 22, 2013.
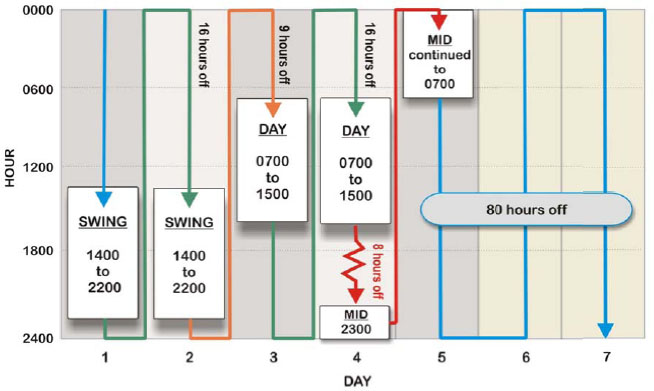
FIGURE 2-1 Example of counterclockwise rotating 2-2-1 schedule.
Box 2-1
Counterclockwise Rotating 2-2-1 Schedule
The counterclockwise rotating 2-2-1 schedule compresses the workweek (five shifts during 4 days followed by 80 hours off) and is thus popular among controllers. From a fatigue and safety perspective, this scheduling practice is questionable, and the committee was astonished to find that it is still allowed under current regulations.
The schedule involves two swing shifts on Days 1 and 2, two day shifts on Days 3 and 4, and a midnight shift starting at the end of Day 4. The second day shift usually starts early in the morning, and controllers with long commute times will have to get up even earlier to arrive on time for their shift. As a consequence, controllers likely will not get enough sleep before the second day shift, and controllers with a late circadian preference (i.e., those who would usually go to bed and get up late) are especially likely to start the second day shift with a sleep deficit. After the second day shift, controllers have 8 hours to recuperate before they have to arrive for the final midnight shift.
The commute will cut down on their time for recuperation, and since controllers are asked to sleep during the afternoon or early evening when the circadian system is maximally promoting wakefulness, they are unlikely to log a substantial amount of sleep (if any) before the f nal midnight shift, where they are required to work through the circadian nadir. This combination of acute sleep loss and work during the biological night increases the risk for fatigue and for associated errors and accidents.
incidents that can be attributed to ATC, data-driven evaluation of the effects of controller fatigue on safety would be difficult on the basis of incident data alone even if such elements are included in incident reports. Nonetheless, evidence from incidents in which fatigue played a role has triggered FAA scrutiny about controller staffing and scheduling and has generated follow-up action (e.g., the new 9-hour rule and the release of fatigue risk management bulletins, which were mentioned above). The relationship between safety and fatigue can be examined further through wider analysis of other data sets, including controller reports of situations that did not rise to the level of “incident” but that were believed to warrant investigation, as discussed in the next section of this chapter.
Best Practices Addressing Fatigue
Full implementation of a fatigue risk management system (FRMS) could go beyond duty time limitations and mitigate fatigue in a more comprehensive manner. ICAO defines an FRMS as “a data-driven means of continuously monitoring and managing fatigue-related safety risks, based upon scientific principles and knowledge as well as operational experience that aims to ensure relevant personnel are performing at adequate levels of alertness.” An FRMS shares characteristics with safety management systems, including effective safety reporting, senior management commitment, a process of continuous monitoring, a process for investigation of safety occurrences that aims to identify safety deficiencies rather than apportioning blame, the sharing of information and best practices, integrated training for operational personnel, effective implementation of standard operating procedures, and a commitment to continuous improvement.
As a step toward implementing an FRMS, in 2009 FAA and the National Air Traffic Controllers Association (NATCA) established the Article 55 Fatigue Risk Management Work Group, which included members from FAA and NATCA. They published a memorandum of understanding in July 2011 stating that “the Agency will implement a Fatigue Risk Management System (FRMS) in the ATO for air traffic operations that includes the Union, to analyze, identify and recommend mitigation strategies for fatigue risks. The FRMS will be implemented no later than January 2012.” To date, FAA’s FRMS program remains incomplete.
The results of a 2009 study conducted jointly by FAA and the National Aeronautics and Space Administration (NASA) examining controller fatigue have been available to the nascent FRMS program. They have remained in a “for official use only” format and have not been released to the public (or to the committee). Nevertheless, the FRMS program has issued a series of fatigue-related recommendations aimed at increasing the safety of the National Airspace System and improving the health and well-being of the controller workforce. FAA has addressed these recommendations through policy changes (such as the 9-hour rule noted earlier) and fatigue awareness training.14
With the budget sequestration in 2013, FAA has effectively eliminated the FRMS program’s capability of monitoring for fatigue concerns proactively. Policy changes made since FAA received the results of the FAA–NASA study have not been scientifically monitored or evaluated to determine whether they are achieving the intended reductions in safety concerns
__________
14Fatigue interventions developed and implemented through the efforts of FAA’s Fatigue Risk Management Office. Fatigue implementation and utilization reports for FY 2012 and FY 2013 for ATC and Technical Operations were provided by Darendia McCauley, FAA Civil Aerospace Medical Institute, February 12, 2014.
with fatigue.15 Thus, a recent OIG audit report noted the following: “We could not determine the extent to which these new policies impact fatigue because FAA does not have metrics to measure the effect of its scheduling practices” (OIG 2013a). Similarly, after meeting with the remaining FAA staff administering the FRMS program, the committee could not verify or determine the metrics that FAA intends to use to evaluate the implementation of these policies or whether FAA has collected or analyzed any data to which metrics would be applied. The committee did not see—or was not provided—with evidence that FAA has plans for such evaluations or the appropriate resources to complete them.
Additional recommendations concerning fatigue mitigation are likely to result from further implementation of an FRMS. The extent, if any, to which staffing requirements for sustaining the operation will be affected by such mitigations is not known. The committee tried to address this question by using a scheduling tool under development by FAA, Operational Planning and Scheduling (OPAS), to investigate the effects of the minimum duration off between a night and a day shift on required staffing levels. Three different demand curves16 were compared for 8 hours, 9 hours, and 10 hours off between shifts at constant traffic levels. For two of the three demand curves, one additional employee was needed if the off-duty period was increased from 8 to 9 hours (in this hypothetical scenario, 22 controllers instead of 21 are required for “flat,” and 24 controllers instead of 23 are required for “camel”). The number of controllers did not increase further if the off-duty period increased to 10 hours. However, with 10 hours off between shifts, schedules generated by the tool resulted in start and end times that were somewhat atypical, which could be considered a disruption by controllers in terms of rescheduling their work and commute times (Grant Thornton 2013).
Ultimately, a full FRMS implementation—similar to that of ANSPs in other countries17—will build not only on policy and training but also on tools at local facilities that plan controller duty schedules with consideration of fatigue risk and provide immediate decision support to managers in changing schedules at short notice in response to unexpected events. While FAA is headed in this direction with the OPAS tool, program implementation is still in its infancy, concerns about the software and its utilization remain unresolved, and the target date for its implementation appears to have slipped.18 Furthermore, the controller workforce may resist the implementation of any scheduling tool if it results in significant changes in common scheduling practices at the facility level. Changes in scheduling practices would be easier to justify to the workforce if they were substantiated by data and monitored for unintended side effects, as originally planned in the implementation of the FRMS program’s activities. However, recent budget cuts to the FRMS program have hampered progress toward its goals.
__________
15For example, FAA’s briefing to the Human Factors subcommittee of the Research, Engineering, and Development Advisory Committee (February 26, 2013) reported plans to eliminate all contractor spending on air traffic controller fatigue research in FY 2014 and FY 2015. Research would be limited to what could be performed by in-house personnel, and field studies would be canceled.
16The three demand curves include “flat,” with no major demand peaks; “camel,” with limited demand peaks; and “multipeak,” with numerous demand peaks. The only variable that changed was the time between shifts.
17For example, Airservices Australia reported to the committee that its enhanced FRMS was implemented in 2012.
18 “FAA plans to implement OPAS at 15 FAA facilities by the end of fiscal year 2013, and achieve nationwide implementation in the fiscal year 2016–2017 timeframe” (OIG 2013a, 16).
MOVING FORWARD: MONITORING FOR STAFFING’S IMPACT ON SAFETY AND ON SAFETY CULTURE
As discussed earlier, ATC-related accidents since 1990 have been a small proportion of accidents from all causes. This safety level reflects the steady professionalism of controllers and FAA, yet evaluating this level of safety is problematic. Various FAA organizations gather data related to safety; examples include data on incidents violating various safety criteria without causing accidents, records of actual operations, and voluntary controller reports from ATSAP.19 Many of these metrics are marked as proprietary or confidential and were not available to the committee, which limited its ability to assess data. Accordingly, the committee is uncertain whether current FAA practices monitor this safety record sufficiently to identify where further safety improvements can be made. The committee is even less certain whether these practices analyze the association between ATC-related accidents and incidents and staffing indicators,20 such as overall staffing levels relative to staffing targets, the use of overtime, and fatigue risk factors. The examination of accident data has been useful in other areas of aviation safety analysis (Oster et al. 2013), and FAA is encouraged to examine ATC-related accidents and incidents more closely. For example, determination of how these accidents and incidents varied across industry segments and ATC facility types might be possible (see Pape et al. 2001). Such analyses could be helpful to FAA in reducing ATC-related accidents and incidents stemming from various causes and types of operations. Furthermore, changes in staffing practices or staffing levels might reduce the safety of ATC operations and lead to an increase in ATC-related accidents and incidents. An understanding of the possible link between staffing practices, staffing levels, and ATC-related accidents and incidents would require a better understanding of ATC-related accidents, their causes, and when and where they have occurred.
Investigation of the impact of controller staffing levels on safety is complicated by FAA’s ability to limit the number of ATC operations it must manage. For example, faced with reduced controller staffing levels, the agency can decide against opening a sector to accommodate more traffic during busy periods and can order pilots to hold flights on the ground until FAA controllers can accept them, with resulting flight delays. Such built-in adjustments to air traffic management procedures complicate efforts to relate staffing to safety because the impacts of inadequate controller staffing levels are manifested as a degradation in the performance of the National Airspace System (i.e., in flight delays) rather than as a reduction in safety.21
The level of safety reflects not only individuals’ actions but also the broader organization’s collective functioning in preventing and mitigating risks where they are possible to predict and in committing to monitor for and address unpredictable risks as they emerge.
__________
19The committee received indications from FAA that data are collected and that various metrics are generated, analyzed, and acted on. However, the committee did not receive examples of these data or how the data are analyzed. See http://www.faa.gov/about/office_org/headquarters_offices/ato/service_units/safety/media/NSFPresentation-final-for-web.pdf, prepared by Joseph Teixeira, FAA, May 2013.
20As reported to the committee, FAA does not actively analyze relationships between safety and staffing levels (Joseph Teixeira, FAA, briefing to a subgroup of the committee at FAA headquarters, January 6, 2014).
21In late April 2013, reductions in controller staffing due to furloughs associated with the sequester led to some flight delays, particularly in congested airspace in the New York City area (Elias et al. 2013). However, some of these delays were attributed to weather problems at key hub airports rather than to reduced controller staffing (Lowe 2013). Experience during the sequester does not provide robust, quantitative evidence about the impacts of reduced controller staffing levels on the performance of the National Airspace System over a prolonged period.


