
APPENDIX C
ILLUSTRATIVE RISK ANALYSIS METHODS
A number of formal procedures and specific analysis tools have been developed in fields where risk analysis has been applied. Some of the more commonly used methods, briefly described here, illustrate the logic of risk analysis. All such methods have limitations and appropriate ranges of application.
PRELIMINARY HAZARD ANALYSIS
A preliminary hazard analysis (PHA) is a qualitative study of the hazards, components of the related operational system, and event sequences that could lead to an unwanted incident. Possible consequences of the incident and potential corrective actions normally are included in the study. The PHA uses an inductive forward analysis of starting with the failure event and identifying sequential consequences resulting from the failure.
A PHA is an initial effort to identify potential problem areas and the system components and their interfaces. The study is qualitative and considers larger operational components, rather than detailed interactions. (See Figure C-1) If a PHA is done during the preliminary design stage, awareness of the potential problems can enable the designer to incorporate features to reduce, control, or avoid the risk. If the potential risk remains after design and construction, the PHA can be used to identify needs for management or governmental action to mitigate the potential losses.
|
Hazardous element |
Triggering event 1 |
Hazardous condition |
Triggering event 2 |
Potential accident |
Effect |
Corrective measures |
|
1. Strong oxidizer |
Alkali metal perchlorate is contaminated with lube oil |
Potential to initiate strong redox reaction |
Sufficient energy present to initiate reaction |
Explosion |
Personnel injury; damage to surrounding structures |
Keep metal perchlorate at a suitable distance from all possible contaminants |
|
2. Corrosion |
Contents of steel tank contaminated with water vapor |
Rust forms inside pressure tank |
Operating pressure not reduced |
Pressure tank rupture |
Personal injury; damage to surrounding structures |
Use stainless steel pressure tank: locate tank at a suitable distance from equipment and personnel |
|
(Source: Henley and Kumamoto, 1981) |
||||||
Figure C-1 Examples of Preliminary Hazard Analysis (PHA): 1. Hazardous situation: alkali metal perchlorate is contaminated by a spill of lube oil; 2. Hazardous situation: moisture inside pressurized steel tank.
Although the PHA lacks detail, it is a useful procedure to create awareness of potential hazards and to provide guidance for improving protection for the assets of people, property, and operational continuity. The time to complete a PHA is comparatively short, and the experience of the analyst is important to the quality of the results.
FAILURE MODES AND EFFECTS ANALYSIS
A failure modes and effects analysis (FMEA) describes potential failure modes in a system and identifies the possible effects on the system's performance. The method first identifies the subsystem components and their inter-relationships in detail. Then, every mode of failure for each component is considered, and the effects on system function are identified. A FMEA normally is developed in a qualitative format, although quantitative values for reliability may be incorporated. (See Figure C-2)
The FMEA is an inductive, forward analysis. The procedures can involve a high degree of detail because all modes of failure for each component must be considered. A FMEA requires an intimate knowledge of the system, constraints, environment, and the definition of failure. Mathematical sophistication is not important, and reliability quantification of each component can be time consuming and expensive, particularly when components have more than one failure mode.
A FMEA normally deals with equipment and does not include the human action interface, system interaction, and common cause failures. The documentation of failure modes and conditions that lead to the failure enables the designer to focus on details of enhancing reliability and performance in a systematic manner. However, it is often difficult to determine exactly which failure modes cause a specific adverse effect. A fault tree analysis can complement a FMEA to identify causal details.
CRITICALITY ANALYSIS
A criticality analysis (CA) provides a measure by which the relative importance of system components may be ranked. A CA often is an extension of a FMEA. As with a FMEA, a criticality analysis deals mostly with equipment and does not take into account the human activity interface, system interactions, and common cause failures. Criticality may be expressed in functional categories or in probabilistic terms.
Criticality categories may be established subjectively in terms of functional descriptions or levels of damage, or more quantitatively in terms of a
|
1. Subsystem--- |
2. Dwg. Nr.--- |
3. Prepared By--- |
4. Date--- |
|||
|
Item |
Failure Modes |
Cause of Failure |
Possible Effects |
Probability of Occurence |
Criticality |
Possible Action to Reduce Failure Rate or Effects |
|
Motor case |
Rupture |
a. Poor workmanship b. Defective materials c. Damage during transportation d. Damage during handling e. Over pressurization |
Destruction of marble |
0.0006 |
Critical |
Close control of manufacturing processes to ensure that workmanship meets prescribed standards. Rigid quality control of basic materials to defectives. Inspection and pressure testing of completed cases. Provision of suitable packaging to protect motor during transportation. |
|
Propellant |
a. cracking b. Voids c. Bond separation |
a. Abnormal stresses b. Excessively low temperatures c. Aging effects |
Excessive burning rate. Overpressurization; motor case rupture during otherwise normal operation |
0.0001 |
Critical |
Carefully controlled production. Storage and operation only within prescribed temperature limits. Suitable formulation to resist effects of aging. |
|
Liner |
a. Separation from motor case b. Separation from motor insulation |
a. Inadequate cleaning of motor cases after lubrication b. Use of unsuitable bonding material c. Failure to control bonding process properly |
Excessive burning rate. Overpressurization. Case rupture during operation |
0.0001 |
Critical |
Strict observance of proper cleaning procedures. Strict inspection after cleaning of motor case to ensure that all contaminants have been removed. |
|
(Source: Hammer, 1972) |
||||||
Figure C-2 Example of Failure Modes and Effects Analysis
frequency of failure. The cost of evaluating component failures can vary substantially.
A CA allows a ranking of the hazards and failure effects to identify relative importance or attention. In addition to probabilistic ordering, criticality ranking can be expressed as a product of probability and expected damage.
EVENT TREES
An event tree starts with an identified failure condition and proceeds with a forward, inductive analysis to show causal relationships. This forward analysis traces all possible sequences of events that together describe all possible outcomes of the failure event. The diagrammatic structure that describes these outcomes in a series of discrete, connected events is an event tree. Each branch represents a possible status (state) of the system.
The sequence of events in this forward analysis enables one to identify a number of scenarios (sequences of events) for the outcomes of a single initiating event. The selection of the events reflects the degree of detail that is desired. Figure C-3 shows a relatively gross description of the possible outcomes to a fire in a three room building having Room 1 as the room of origin. Fire termination may occur by self termination, automatic sprinkler suppression, or manual suppression. One could construct event trees to describe events in even greater detail.
The event tree can be used qualitatively to describe possible outcomes of an event. Outcomes may be grouped in terms of their consequences, as illustrated in Figure C-3. When event probabilities are determined, the probability of the outcomes may be calculated. It is often difficult to determine the probabilities objectively because they are conditional on the occurrence of prior events.
The method's inherently binary nature, with each mode indicating a "fail, not-fail" dichotomy can be overcome but is a shortcoming. Systems often degrade without experiencing sudden failure, but detailed analyses of such failure modes introduce considerable complexity into the event trees. Statistical correlations among events may affect the sequence probabilities and are difficult to evaluate with currently available data.
FAULT TREES
A fault tree is a diagram that traces the causal events that can lead to a system failure backward through deductive logic to determine its roots. The events are organized into a logical framework which uses logic gates to
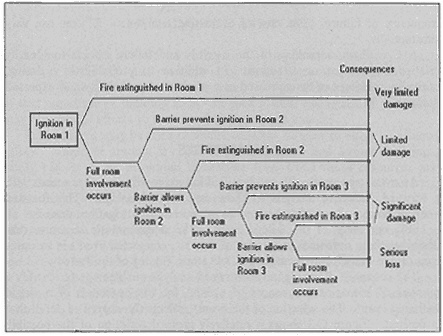
Figure C-3 Example of Event Tree Analysis
identify the causal relationships of the events immediately below the gate. Fault trees can be used for evaluating the events as branches in the event tree in Figure C-3.
Procedures for constructing fault trees are well documented and provide a means by which complex interrelationships can be understood. Construction of a fault tree requires an intimate knowledge of the system being studied, identifying causes, determining exclusiveness, independence, and conditionality of events, and logically describing event interactions require considerable thought and understanding. This process is, however, one of the most valuable parts of the analysis process.
Fault trees are analogous to a photograph in that they depict conditions at an instant in time or as a transition between two consecutive events in an event tree. Fault trees may be used qualitatively to identify events that cause failure. When probabilities are determined for the events, the probability of failure of the main event may be calculated. Time dependent event relationships cannot be represented on fault trees.
Variations of the fault tree analysis may be explored, focusing on actions that will prevent progress toward failure. Success trees and more general network diagrams share with fault trees the basic characteristics of illustrating graphically the chains of cause and consequence that can lead from an initial event (such as an earthquake) to loss of life or safe and acceptable performance.


