5
Climate Change and Climate Variability: The Climate Record
Kevin E. Trenberth
National Center for Atmospheric Research
Boulder, Colorado
INTRODUCTION
Global warming is a prominent part of the climate change expected in association with the observed increases in greenhouse gas levels brought about by man's activities. Yet natural variations, such as those associated with El Niños, make it difficult to detect anticipated climate changes. In addition, detection in the observational record of the expected global warming is confounded by flawed and patchy observations and because observed climate change is not geographically uniform. This paper discusses the difference between weather and climate and analyzes examples of recent climate anomalies, including the 1988 North American drought. It also summarizes the climate changes expected from increased greenhouse gas concentrations in light of the observational record.
The observed patterns of temperature change over the globe are not yet well accounted for by climate models. Nevertheless, climate models are the best tool we have for quantifying the complex processes involved in climate change and for making future projections. Large natural variability will continue to be a major factor to be planned for, and any changes in the incidence or kind of El Niños could have profound impacts in the western United States.
THE POTENTIAL FOR GLOBAL WARMING
There are many uncertainties in future projections of climate change: uncertainties about what form the climate change will take, how quickly it will develop, and how extreme it will be.
With the recognition that climate changes are inevitable as a result of the observed increase in greenhouse gas concentrations in the atmosphere, there is a great need for better observations and analyses to document the past and current climate and how it has changed with time. The need is for both regional and global evidence, to the extent that it exists, for many climatological variables.
While there are many uncertainties in any future projections, there are also some certainties. The levels of several greenhouse gases are increasing and will continue to do so. Carbon dioxide is the best known greenhouse gas. For example, observations at Mauna Loa show that since 1958 the carbon dioxide concentration has increased from 315 to approximately 350 ppm (Figure 5.1), and bubbles of air in ice cores reveal that the preindustrial carbon dioxide levels of the last century were around 280 ppm. So concentrations have already increased by 25 percent, largely because of man's burning of fossil fuels and clearing of forests. The other greenhouse gases of note are methane, nitrous oxide, and the chlorofluorocarbons (CFCs); the concentrations of all these gases
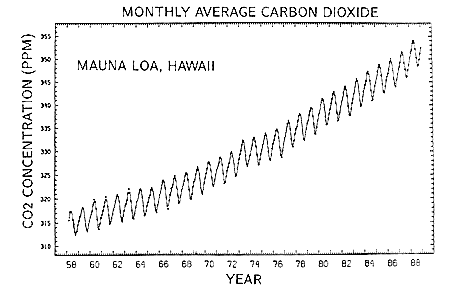
FIGURE 5.1 Monthly average carbon dioxide from Mauna Loa, Hawaii in parts per million by volume.
SOURCE: Reprinted, by permission, from Keeling et al. (1989). Copyright © 1989 by American Geophysical Union.
are observed to be increasing due to man's activities and will continue to increase. The pressures of population growth, more than any other factor, will guarantee this. It is not my purpose here to delve into this aspect any further, though it is a subject of interest in itself.
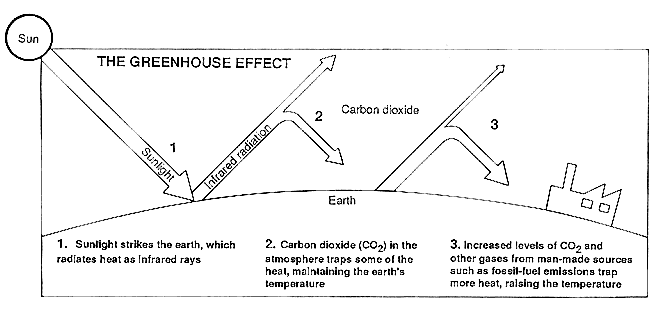
Because these gases are greenhouse gases—that is, they interfere with the outgoing radiation (Figure 5.2)—they will cause climate change. In the midst of all the uncertainties, we must not lose sight of this. The greenhouse gases are well mixed and globally distributed and the increase will undoubtedly cause climate change. The main prospect of this gas accumulation is indeed global warming.
THE 1988 DROUGHT
During the summer drought of 1988, there was a proliferation of news media speculations about a possible link between the drought and the greenhouse gas effect. In fact, the best assessment we can make indicates that the drought was, more likely, essentially a natural phenomenon brought about primarily by changes in the tropical sea surface temperatures (SSTs) in the Pacific Ocean. The theory of the drought (Figure 5.3), which has been tested with models (Trenberth et al., 1988), goes as follows:
-
In the tropical Pacific, atmospheric winds drive the ocean currents and thus determine the SST patterns; simultaneously, the SSTs determine where the main convergence in winds occurs in the atmosphere and thus where the tropical storms and thunderstorms are most apt to form in organized patterns. The names given to the different extremes of these changes are El Niño, for the times when the tropical Pacific is warmer than normal, and La Niña, for the times when it is colder than normal.
-
In April 1988, a strong La Niña developed, creating very cold water along the equator. Warmer water, a residual from the previous El Niño that occurred in 1986 and 1987, was pushed up to a region southeast of Hawaii and elsewhere. This pattern was favorable to a northward displacement of the Inter Tropical Convergence Zone, a region of organized thunderstorms, and resulted in a change of heating patterns in the atmosphere through the latent heat released in rainfall.
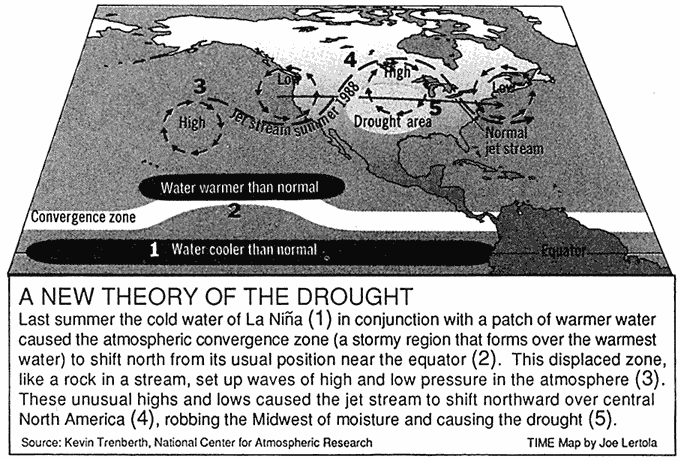
FIGURE 5.3 Schematic outline of the theory for the 1988 drought.
SOURCE: Reprinted, by permission, from TIME Magazine (October 31, 1988). Copyright © by TIME.
-
In turn, the change in heating disrupted the atmospheric flow by setting up anomalous waves in the atmosphere, manifested as a change in the jet stream and associated storm tracks in mid-latitudes. In the spring of 1988, this led to anticyclonic conditions over North America—conditions favorable for the development of the drought.
-
The dry conditions led to heat waves, because the incoming solar radiation in summer goes mostly into heating the atmosphere rather than to evaporating moisture, and this, along with the moisture shortage, led to a perpetuation of the drought.
The greenhouse effect may well have made the heat waves hotter and the drought somewhat more severe than it would have been otherwise, but these effects were probably relatively small. The drought would almost certainly have occurred without any enhanced greenhouse effect; droughts are essentially a natural phenomenon and have occurred throughout history.
WEATHER VERSUS CLIMATE
In 1989, there were other weather extremes to talk about. While it was listed as the sixth warmest year on record for the globe, the warmest year ever in Great Britain (where the instrumental records, which begin in 1659, are the longest anywhere), and also the sunniest year, there were some contraindications, including record cold outbreaks in the United States in February 1989 and again in December 1989. How are these consistent with the greenhouse gas effect?
While one possible explanation of these signs relates to whether or not there might be increases in extremes in a greenhouse gas world—a distinct possibility with respect to droughts, floods, and things like hurricanes—another likely prospect is that these extreme events were caused simply by ''weather'' or natural variability. There is a lot of confusion in the mind of the public on this issue. Weather arises from internal instabilities in the atmosphere that produce anti-cyclones and cyclones, and cold and warm fronts, as the equator-to-pole temperature gradient is continually being eroded by cold polar outbreaks and warm southerlies in these weather systems, even as the incoming solar and outgoing earth radiation help maintain those temperature gradients. Weather, then, is an atmospheric phenomenon, and it has an infinite range of variability.
Climate, on the other hand, is more persistent, and we think of it as essentially forced, or caused, by things external to the atmosphere. The ocean is the primary link that produces climate anomalies; the largest interannual changes in world-wide weather patterns arise from the El Niño events in the tropical Pacific. Changes in greenhouse gas concentrations is another phenomenon external to the weather system. Other possibilities are changes in the sun, volcanic eruptions that blot out the sun, and interactions with snow, sea ice, and glaciers. Climate then, involves not only the atmosphere but also the oceans and interactions with other parts of the climate system.
CLIMATE OBSERVATIONS
There are three areas of concern related to the use of climate observations to detect climate change:
-
the quality of the observational data base—its spatial and temporal distribution, biases, and random errors;
-
the validity of spatial averages—of the analysis methods used to compile regional and global numbers; and
-
the best ways to interpret results—to account for natural variability while detecting trends in climate signals.
Surface Temperatures
The problems of homogenizing the original data are severe because over time there have been changes in the following:
-
instrumentation, instrument exposure, and measurement techniques (e.g., standard thermometers versus electronic thermistors);
-
station location;
-
observing times and methods of computing daily and monthly means;
-
station environment, such as urbanization; and
-
analysis methods for computing area averages.
For land temperatures, station locations have moved, such as from the central city to the airports in the 1950s, and observation times have changed. Because daily averages sometimes use averages of hourly or six-hourly readings and sometimes simply average the daily maximum and minimum temperatures, changes in observation time can introduce a bias. These effects can be corrected if the changes in instrumentation, station site, time, and method of measurement are known, but this is not the case for many places outside of the United States.
Some studies use only land-based stations, but such an approach is hardly global. Climate data in Antarctica began only in 1957. Observations at many southern ocean islands were initiated in the 1940s. For SSTs there are huge gaps in coverage over the ocean as we go back in time (Figure 5.4). Global coverage combining SST and land data is estimated as shown in Table 5.1.
Other problems with SSTs are the changes in the kinds of buckets used to bring up water for temperature measurements and the switch, especially around World War II, to use of engine room readings of temperatures of water brought in to cool the engines. Because of heat in the engine room, the latter tend to be 0.3 to 0.7°C warmer than bucket temperatures, but the difference varies greatly depending on the draft of the ship and the engine room configuration. More recently, satellite data have introduced other kinds of errors because of contamination by water vapor and aerosols in the atmosphere and because the satellite sees only the surface—the skin temperature.
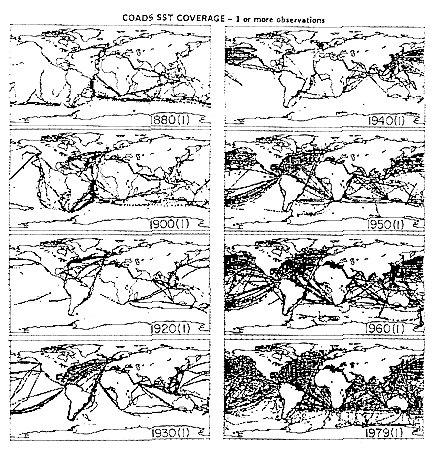
FIGURE 5.4 Coverage of sea surface temperature from ship observations during January of the years shown. To be plotted, one or more observations were required in a 2° latitude by 2° longitude square with the small x plotted at the center of gravity of the observations.
SOURCE: Adapted from Comprehensive Ocean-Atmosphere Data Set (COADS).
Figure 5.5 shows uncorrected and corrected SSTs averaged over the Northern Hemisphere as a function of time. Of the two corrected versions here, one shows almost no trend, while the other shows an upward trend and is more similar to what land data show. The point here is that the corrections that need to be made to the data are uncertain, at least to 0.2°C, and the magnitudes of the corrections are larger than the signal we are looking for.
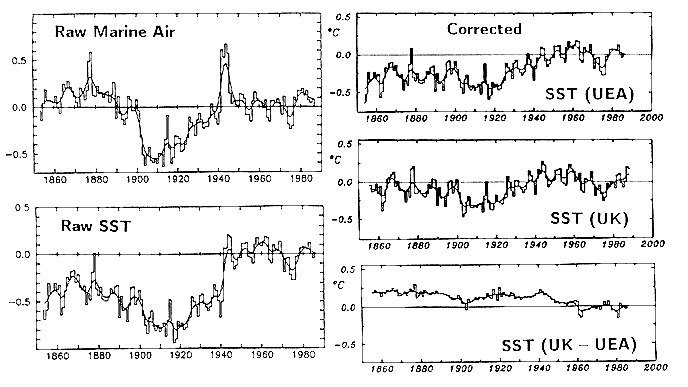
FIGURE 5.5 Time series NH temperature anomalies over the oceans: (i) uncorrected marine air temperatures, (ii) uncorrected sea surface temperature (SST), (iii) SST as corrected by the University of East Anglia (UEA), (iv) SST as corrected by the U.K. Meteorological office (UK), and (v) differences in SST (UK-UEA).
SOURCE: Adapted from Farmer et al., 1989.
TABLE 5.1 Portion of the Globe for which Surface Temperature Data are Available for Various Decades (in percent).
|
|
Percentage Covered by Temperature Data |
||
|
Decade |
Globe |
Northern Hemisphere |
Southern Hemisphere |
|
1960s |
70 |
85 |
55 |
|
1930s |
50 |
65 |
35 |
|
1910s |
33 |
45 |
20 |
The best estimates we have of global and hemispheric temperatures (Figure 5.6), keeping in mind the uncertainties discussed above, do reveal a modest warming of approximately 0.5°C, with the warmest years in the 1980s. Note that in the Southern Hemisphere, the temperature trend is what we might expect—the largest temperature increases occurred after World War II when greatest increases in greenhouse gases occurred. In contrast, the biggest jump in the Northern Hemisphere occurred in the 1920s. The details of why the record is like this are not yet well understood. A big question is whether the overall warming will continue, as we might expect because of the greenhouse effect, or whether temperatures will decline as they did in the 1960s. Of this overall warming, it is possible that 0.1°C of the increase is from the urban heat island effect.
However, regionally, there are large departures from this pattern, and there has not been much of a trend for the United States (Figure 5.7). For the United States, the highest temperatures are found in the 1930s, the dust bowl era in which droughts and heat waves prevailed. For comparison, many years have been warmer than 1988, the second-to-last point on Figure 5.7 and the year of our most recent major drought.
When we look regionally at the decade from 1977 to 1986 (Figure 5.8), we see that the largest warming—more than 1.75°C—relative to the mean for the period 1951 to 1980 occurred over
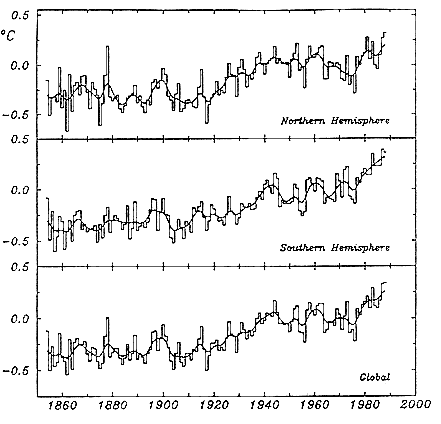
FIGURE 5.6 Global and hemispheric estimates of the total surface temperature variations from 1884 to 1988.
SOURCE: Reprinted, by permission, from Farmer et al. (1989). Copyright 1989 by University of East Anglia Climate Research Unit.
found in the 1930s, the dust bowl era in which droughts and heat waves prevailed. For comparison, many years have been warmer than 1988, the second-to-last point on Figure 5.7 and the year of our most recent major drought.
When we look regionally at the decade from 1977 to 1986 (Figure 5.8), we see that the largest warming—more than 1.75°C—relative to the mean for the period 1951 to 1980 occurred over Alaska. The
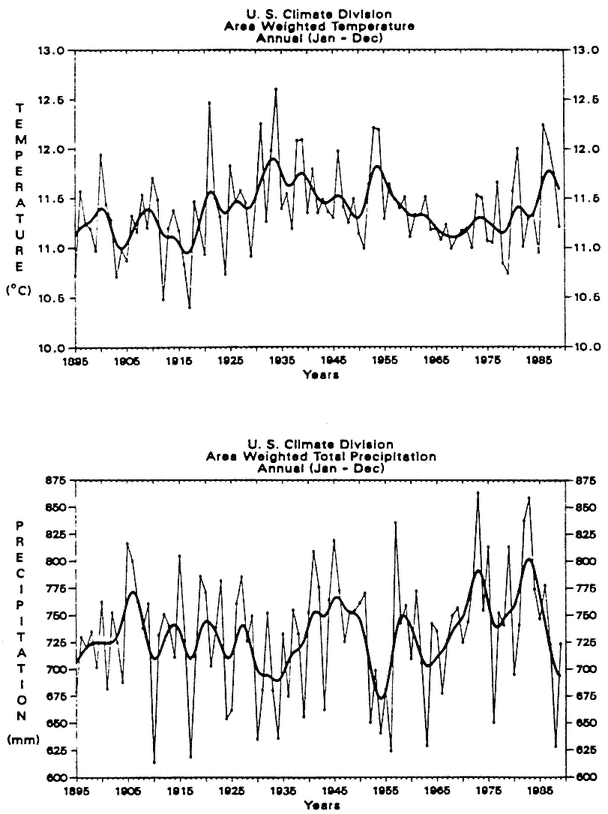
FIGURE 5.7 Time series of annual mean temperature and precipitation for the United States from 1895 to 1989.
SOURCE: Updated from Karl, 1988.
Alaska. The western states were warmer but the eastern states colder, providing little change for the United States as a whole. Note also the cooling in the North Atlantic and North Pacific, which would not be well captured using only land data. It turns out that this pattern
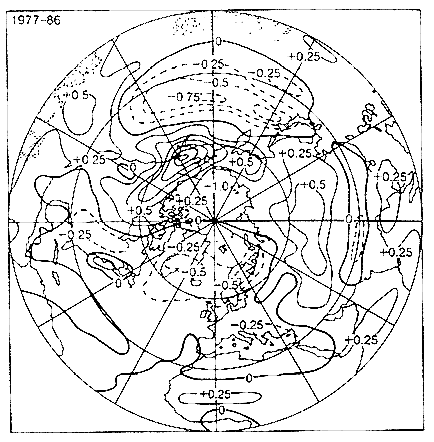
FIGURE 5.8 Decadal mean surface temperature anomalies for 1977 to 1986 relative to a 30-year mean (1951-1980). Contours are every 0.25°C and stippled areas indicate inadequate data.
SOURCE: Trenberth, 1990.
occurred for a reason related to changes in atmospheric circulation (Trenberth, 1990). Over the North Pacific in winter (November through March), the Aleutian Low pressure system was more intense than normal from 1977 to 1988, bringing more southerly winds over the West Coast and Warmer, moister air into Alaska, while on the back side of the Aleutian Low colder, drier air caused cooling over the North Pacific. This change in circulation takes the form of a
wave pattern in the jet stream, and the North Pacific changes are also linked to the cooling over the East Coast.
Why did this occur? A big part of it may be related to changes in the tropics and what meteorologists refer to as "teleconnections." Teleconnections come about because the atmosphere responds to forcing by setting up waves that may propagate over great distances. In this case, the corresponding changes in the tropics are manifest as the El Niño-Southern Oscillation (ENSO) phenomenon (Figure 5.9).
A major question, at present unresolved, is whether there may be a change in intensity or frequency of ENSO events with global warming. From 1977 to 1988 there were three major El Niños (warm events) in a row but no corresponding La Niñas (cold events) in the tropical Pacific. This is unprecedented in the past 108 years. Consequently, the question of why it was warm in Alaska becomes one of why there were three ENSO events in a row. Is this a signal of the greenhouse effect?
Precipitation
Reliable precipitation climatologies are not available over the oceans because even where rare measurements from ships do exist, they are unreliable. Over land, the climatologies are undoubtedly useful, but still subject to inhomogeneities, and it is difficult to obtain good estimates of changes with time, except regionally. The records that do exist exhibit strong variability on all time scales. Interannual variations, often associated with ENSO, are strong, and there are also large decadal scale variations that can be verified by changes in lake levels. In the United States, record high levels in Lake Michigan and the Great Salt Lake in 1985 provide evidence of the persistently above normal rainfalls from about 1970 to 1985 (Figure 5.7). Some lower frequency variations and trends also appear in several records, but their reality is often less certain. One example of a strong and persistent reduction in rainfall is in the Sahel region of Africa, which has caused Lake Chad in the central Sahel to fall substantially in recent decades.
For precipitation data, the large spatial variability and inherent small scales make coverage, analysis, and averaging methods important considerations. Small changes in station location and changes in exposure, such as tree growth, commonly corrupt rainfall records, but these changes are generally not detectable unless detailed station history records are kept. Because of the small-scale spatial variability, adjustment of rainfall records for inhomogeneities using an
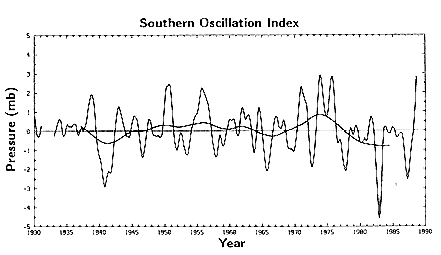
FIGURE 5.9 Time series of the Southern Oscillation index.
adjacent station comparison requires a much denser network of stations than adjustments of temperature records. The latter also means that many more stations are needed to adequately monitor rainfall than are needed to monitor temperature, especially in complex terrain areas.
In addition, changes in instrumentation through alterations in rain gauge design to address factors such as wind, wetting losses, and evaporation that affect the collection efficiency and measurement of rain, and especially snow, introduce biases with time that must be corrected. National practices for converting frozen precipitation into liquid equivalent vary. In the past, discontinuities in isohyets* across the borders of adjacent countries have often been noted. Correcting of the pervasive inhomogeneities in rainfall records with complete station records is essential if confidence is to be gained in how rainfall is changing with time.
For the United States, regional reconstructions of precipitation variations with time have been made by the National Climatic Data Center (NCDC) at the National Oceanic and Atmospheric Administration (NOAA). Data for years prior to 1931, however, are much more uncertain and have a different basis. Prior to 1931, data from all
reporting stations were averaged with equal weighing, taking no account of the distribution of stations. After 1931, statewide estimates were made by areally averaging the values from each climatic division (divisions represent climatically homogeneous subregions). Within each division, each station is weighted equally, although the number of stations varies with time. In 1982, 5000 stations were used across the United States. Values prior to 1931 have been adjusted in an ad hoc fashion to be compatible with post-1931 methods (Karl et al., 1983), but this process may alter long-term trends.
The states are amalgamated such that the nation is divided into nine broad regions (Figure 5.10). Time series of precipitation for the three western regions are shown in Figure 5.11. In the Northwest, low-frequency fluctuations lasting several decades are in evidence, with the 1920s appearing as particularly dry. Precipitation in the Northwest was fairly consistently above the long-term mean from about 1945 until 1984 but has been very low since 1985. Year-to-year fluctuations of 10 to 20 percent of the mean are quite common.
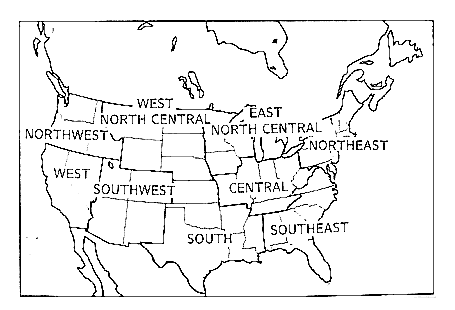
FIGURE 5.10 Map showing the major climatic regions of the United States.
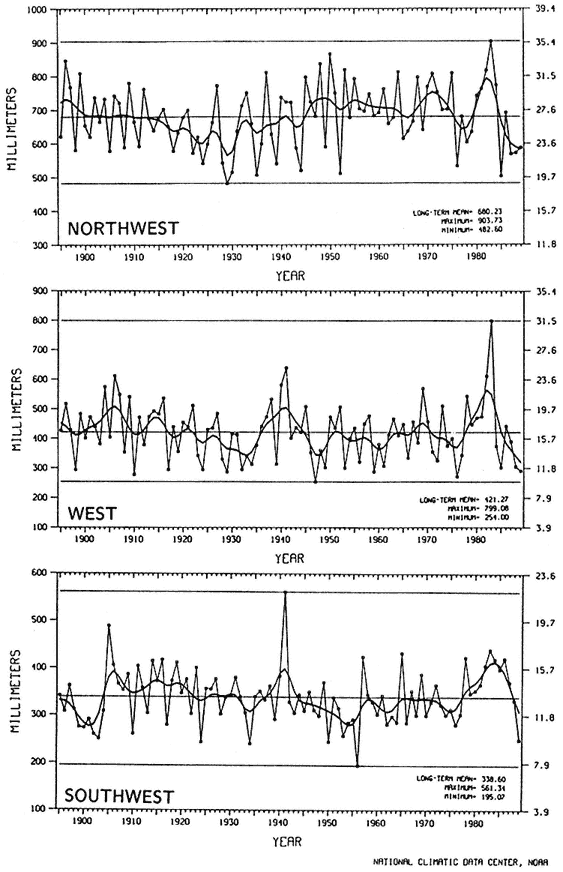
FIGURE 5.11 Time series of annual mean precipitation amounts in the Northwest, West and Southwest regions in mm (left) and inches (right). The long-term mean and extremes are given at the lower right and lines are plotted for each. A low pass smoother shows interdecadal fluctuations.
SOURCE: Courtesy of T. Karl.
In the West and Southwest, the annual mean precipitation is much lower but fluctuations of 10 to 20 percent are still common. Low-frequency (greater than decadal) fluctuations are less in evidence, but occasional extremely high rainfalls are recorded, in particular for the years 1941 and 1983 in both the Southwest and the West. Both of these years were times of major El Niño events (Figure 5.9). As a result, the rainfall distribution tends to be skewed, and more years tend to be below ''normal'' (i.e., the median is less than the average).
The net amount of water available for agriculture or hydrology, however, depends also on evapotranspiration. It is important to take this factor into account in assessing drought. Nationally, the Palmer Hydrological Drought Index is one measure of the cumulative effects of evapotranspiration and precipitation anomalies, and, for the United States, the 1930s and 1950s are seen as the main periods of drought (Figure 5.12).
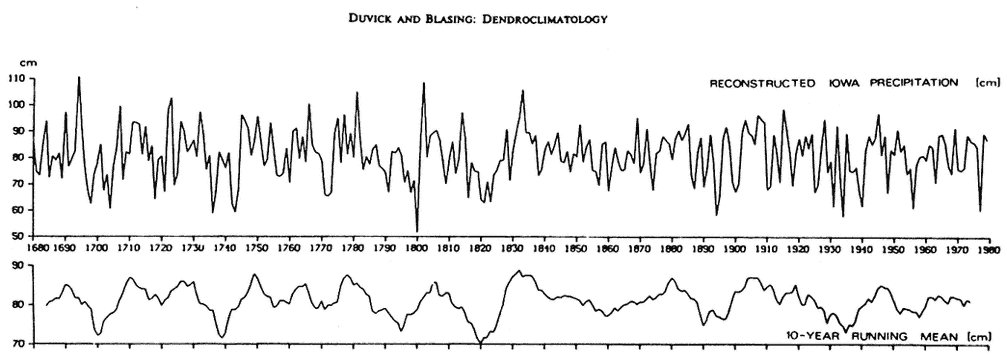
Longer time series of droughts or precipitation have been reconstructed from tree ring analysis, such as that for Iowa (Figure 5.13), from Duvick and Blasing (1981). Although the method of reconstruction may remove very long-term trends, the reconstruction indicates that five decades in the past 300 years have been comparable to or drier than the 1930s. It appears that planning should take account of the expectation that such extreme droughts may occur about twice per century.
MAJOR FINDINGS FROM THE OBSERVATIONAL RECORD
Below is a summary of the major findings at this point from the observational record:
-
The best estimates of global mean surface temperatures reveal increases of about 0.5°C over the past century.
-
The main increase in Northern Hemisphere temperatures occurred between 1920 and 1940, with a temporary reversal after 1960 and a recovery to the highest levels in the 1980s.
-
In the Southern Hemisphere, the main upward trend has been more steady, beginning after about 1930.
-
El Niño events influence global mean temperatures by 0.1°C.
-
The best estimates of global temperature change are not very good. Coverage is not global, especially prior to World War II.
-
Large spatial variations exist in regional temperature trends associated with changes in atmospheric circulation.
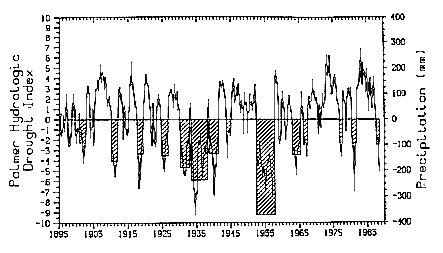
FIGURE 5.12 Palmer Hydrological Drought Index for the United States from 1895 to 1988. Periods of severe drought are cross hatched.
SOURCE: National Oceanic and Atmospheric Administration (NOAA), and National Climatic Data Center (NCDC), 1988.
-
Substantial uncertainties exist in the overall trends, from sampling error and changes in instrumentation and measurement methods. Overall global trends are uncertain by about ±0.20°C per 100 years.
COMPARISON WITH MODEL RESULTS FOR GREENHOUSE GAS INCREASES
Climate models attempt to represent all the complex processes involved in and interactions between the atmosphere, ocean, and land (Figure 5.14) as mathematical expressions—representing the physical laws—that can be solved in a supercomputer. In surveying the modeling results for simulations with increased greenhouse gas concentrations, looking for common features, and assessing the reliability of different models, I have drawn the following conclusions concerning the model results and the observational record:
-
The models indicate warming of 2 to 5°C for an equilibrium climate with doubled carbon dioxide. Effective doubling of carbon
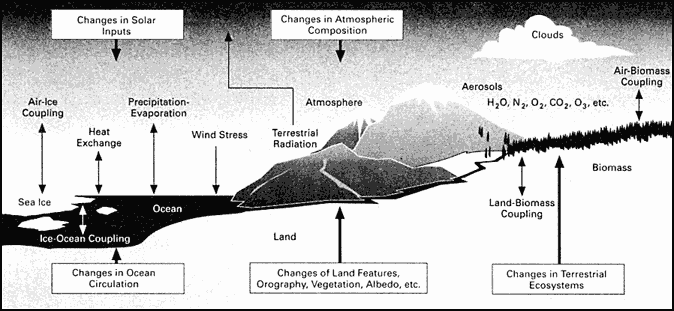
FIGURE 5.14 A schematic representation of the components of the climate system and the interactions between them which should be represented in climate models.
-
dioxide, taking into account the other greenhouse gases, will likely occur around the years 2030 to 2050, with corresponding manifestations of Northern Hemisphere climate change occurring 20 to 30 years later. Because of uncertainties in the models, particularly uncertainties about the role of clouds, I think the best estimate is at the low end, perhaps a 2°C warming for these conditions. The larger values do not appear to be tenable given the observational record unless the oceans are playing tricks on us. Moreover, a big factor in producing the larger values is a positive feedback in clouds, which is not proven. Nevertheless, the error bars on this number are significant. Also, substantial discrepancies exist between the observational temperature record and that expected from models—discrepancies in the timing of Northern Hemisphere warming in the 1920s and in spatial patterns between the Northern and Southern hemispheres and between the land and ocean.
-
Increases in water vapor (a greenhouse gas) and decreases in snow cover and sea ice (lower albedo) provide positive feedbacks that should enhance the effects as time goes on. One result of this is that largest warming should occur in the Arctic. Evidence for an enhanced response in the Arctic can be found in the temperature rises from 1900 to 1940 but not in recent years. Significant trends in snow and ice do not emerge from the climate record, but the record is short.
-
The hydrologic cycle is likely to speed up by about 10 percent with carbon dioxide doubling, causing increased evaporation and increased rainfall in general. Because more precipitation is apt to fall as rain in winter and because snow melt is likely to be faster in spring, soil moisture availability going into summer over mid-latitude continents is likely to be less. Combined with increased evapotranspiration in summer, this implies that any natural tendency for a drought to occur is likely to be enhanced. Increases in rainfall in winter with drier summer conditions imply that water management will become a prominent issue in the future. However, there is not good agreement among the models on this prediction. Precipitation is well known only over land. Real regional decadal variations appear to exist, but overall trends are quite uncertain. Meaningful comparisons between model results and the observational record are difficult to come by.
-
Because warming results in the expansion of the ocean and the melting of snow and glacial ice, one real threat is a rise in sea level. However, there may be some compensation through increased snowfall on top of the major ice caps (in Greenland and Antarctica) so that they could increase in height even as they melt around the edges. Sea level has risen by 1 to 1.5 mm per year or 2.4±0.9 mm per year when corrected for isostatic adjustment—values that are reasonably consistent with alpine glacier melting and thermal expansion of the upper ocean. The rate of sea level rise should increase, but the main impacts will likely be felt much later next century.
-
Stratospheric cooling is another likely effect of increased greenhouse gas concentrations, and this has important implications for ozone, because the kind of heterogeneous chemistry responsible for the Antarctic ozone hole is more effective at lower temperatures. The chlorofluorocarbons that are responsible for the ozone hole are also a greenhouse gas. Large interannual variability confounds temperature trend detection in the lower stratosphere. The record is fairly short (30 years) and inhomogeneous. Detection of greenhouse effects is complicated by ozone-induced changes.
-
Another possibility, because of increased SSTs, is increased frequency and/or increased intensity of tropical storms and hurricanes. This is because SSTs above about 27°C are needed before hurricanes can sustain themselves by feeding on the extra water vapor and latent heat available in such regions.
-
Greatest confidence exists on the global scale; regional climate changes are much more uncertain.
A central task in climate research over the next few years will be to reduce these uncertainties and thereby provide more reliable projections into the future. At the same time, we must recognize that climate has changed throughout history on its own through natural variability and that there is a large "noise" component due to weather that can mask, for a considerable time, any man-made effects. At present, any planning must recognize these factors and uncertainties.
ACKNOWLEDGMENTS
Tom Karl kindly provided material for Figures 7, 11, and 12.
REFERENCES
Duvick, D., and T. J. Blasing. 1981. A dendroclimatic reconstruction of annual precipitation amounts in Iowa since 1680. Water Resources Research 17:1183-1189.
Farmer, G., T. M. L. Wigley, P. D. Jones, and M. Salmon. 1989. Documenting and Explaining Recent Global-Mean Temperature Changes: Final Report to NERC. University of East Anglia, U.K.: Climate Research Unit.
Karl, T. R. 1988. Multiyear fluctuations of temperature and precipitation: The gray area of climate change. Climatic Change 12:179-197.
Karl, T. R., L. K. Metcalf, M. L. Nicodemis, and R. G. Quayle. 1983. Statewide Average Climatic History. Historic Climatology Series 6.1. Asheville, N.C.: National Climatic Data Center, National Oceanic and Atmospheric Administration.
Keeling, C. D., R. B. Bacastow, A. F. Carter, S.C. Piper, T. P. Whorf, M. Heinmann, W. G. Mook, and H. Roeloffzen. 1989. A three dimensional model of atmospheric CO2 transport based on observed winds, part I: analysis of observed data. Pp. 165-236 in D. H. Peterson, ed., Aspects of Climate Variability in the Pacific and the Western Americas. Washington, D.C.: American Geophysical Union.
National Oceanic and Atmospheric Administration (NOAA) and National Climatic Data Center (NCDC). 1988. Drought of 1988 and Beyond. Proceedings of a Strategic Planning Seminar, October 18. Washington, D.C.: National Academy of Sciences and U.S. Department of Commerce.

