
3
The Northeast
Orie Loucks and Wu Jianguo
INTRODUCTION: THE FOREST STEPPE
The regional vegetation map of China (Map 1-2) shows the temperate steppe region (region V) as covering an elongated area from southeastern Gansu to western Heilongjiang. This region is divided into two zones: a northwesterly steppe zone, and an easterly and southeasterly forest steppe zone. Zhao (1990) includes these two zones, as well as the desert steppe to the north and west of the steppe, in her survey of temperate steppes. As in other continental grassland systems, this steppe forest zone is distinguished from the typical steppe by its slightly higher rainfall, soils with higher organic matter content, greater production of forage and cultivated crops, and a significantly higher population density. Under good conditions, the characteristic grassland type in this zone is the meadow steppe, characterized by sheepgrass (Aneurolepidium chinense) and a wide range of forb species.
Many of these vegetation and soil characteristics are present in the easternmost sections of Inner Mongolia, but dense, long-term settlement has left this region nearly treeless and the grasslands severely degraded (Wang, 1984). This chapter briefly summarizes Chinese research on the productivity and management of these grazing areas. Much of the research focuses on the Horqin
Professor Orie Loucks and Dr. Wu Jianguo of the Miami University survey recent research on the climate, soils, vegetation, and grazing practices in the forest steppe region of northeast China. They describe evidence of degradation of these grasslands and efforts to control damage through the construction of shelterbelts, the abatement of salinization, artificial seeding, livestock rotation, and other devices.
[Keerqin], Jirem [Zhelimu], and Songnen Plains, northeast of Chifeng and east of the Daxinganling Mountains (Map 1-3). The regional vegetation map of China (Map 1-2) shows that these grazing areas extend well into the adjacent Liaoning, Jilin, and Heilongjiang provinces.
CLIMATE
The climate of the steppe region of China is cold and dry in winter and relatively warm in summer. Figure 3-1, a Klimadiagram for Chifeng City, shows five months of the year with a mean temperature of less than 0°C. The forest steppe zone differs from the other steppe regions by having more total rainfall, particularly summer rainfall, thereby contributing to potentially higher biological productivity. Jiang Fengqi (1984), professor at the Institute of Applied Ecology in Shenyang, demonstrates the relationship between the higher
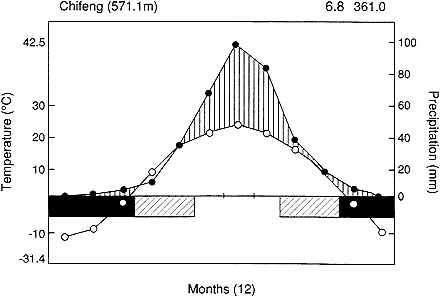
Figure 3-1 Klimadiagram, Chifeng City, Inner Mongolia. NOTE: Chifeng is grassland area at 571 m elevation. The left scale of the diagram is in degrees Celsiu (10°C per scale unit) and shows the monthly means (open symbols). The extreme minimum and maximum temperatures are shown on the left. The mean annual temperature is second from the upper right. The right scale is monthly precipitation (20 mm per scale unit, closed symbols). The annual precipitation is shown at the upper right. The solid horizonal line indicates the period when the monthly mean minimum temperature is below 0°C; the dashed bar, when the lowest of several minimum temperatures extends below 0°C.
Table 3-1 Climate and Soils of Northern China
|
Region |
Climate |
|
Principal |
Forest |
|
|
Annual Precipitation (mm) |
Annual Windy Days (17.2–20.7 m/s) |
Soil Type |
Coverage (%) |
|
Western part of northeast China and eastern part of Inner Mongolia |
350–600 |
20 |
Chernozem, chestnut, sandy, solonchaks solonetz |
2.5 |
|
Northern part of Hubei Plain |
200–400 |
50–100 |
Chestnut, cinnamon, sandy |
0.8 |
|
Northern Xinjiang |
200 |
15–25 |
Brown, gray desert |
1.2 |
|
SOURCE: Jiang (1984). |
||||
precipitation (350–600 mm) and dark chernozem soils in the Northeast (Table 3-1). Although Jiang shows only 2.5% forest cover, more extensive scrub forests in the low Daxinganling mountain range provide fuel and building materials. Historically, the availability of rainfall, fuel, and productive rangelands has attracted more settlement to this area than to other steppe regions of China. Recently, however, the impoverishment of the resource base seems to have brought the vegetation of this region to the verge of catastrophe (Nan, 1984; Liu, 1990).
It may be useful to compare this region with analogous climatic and biogeographic regions in other continents. A North American analogue is the forest steppe transition zone of southern Manitoba, eastern North Dakota, and western Minnesota. The climate of this region, like that of northern China, is dominated by cold continental air masses, light snowfall in winter, and high precipitation during the summer growing season, owing to the strength of southerly (maritime) air masses that are carried into the interior. The North American analogue is also marked by an ephemeral steppe forest transition following human settlement and the high quality of many (but not all) soils. After the settlement of North America, scattered patches of forest, which alternated with grasslands, were cleared (often burned), and a nearly treeless landscape was created. The soils in Manitoba and Minnesota occur in a pattern of sandy parent materials alternating with heavier textured soils, although the former have been impoverished through cultivation followed by drought and grazing, with both processes leading to stabilization and the development of sand dunes.
HUMAN SETTLEMENT
According to Li Yuchen (1990), the population of China's forest steppe zone began to increase several centuries ago, giving rise to the cities of Chifeng, Tongliao, and Anguang. Others report that this settlement was promoted by the central government to enhance military security in a sensitive border area (Zhao Shidong, personal communication). At the outset, most of the good chernozem soils were converted to agriculture. Later, especially during the past 30 years, the population has continued to increase rapidly, through a process Wang (1984) describes as "blind growth of human population, over-cultivation, over-grazing and collection of firewood." Today, settlements are closely spaced, village structure is well developed, and the area available for livestock has been reduced. Sheehy (1990), describing the vicinity of Chifeng City, argues that "historical grazing patterns are no longer applicable." He says that demographic, social and economic changes of the past 20 years now prevent seasonal livestock movements. Herdsmen have become sedentary, while traditional animal husbandry practices (such as herd size) remain unchanged.
Zhang (1990) plans a new research project on optimal modeling of the grasslands of northern China. One field site in this project will be located on the Songnen Plain, near the Songhua River in northern Jilin Province. Professor Li Jiandong of the Institute of Grassland Science, Northeast Normal University in Changchun, will direct this research, which will focus on the problem of unstable soils and high salt concentrations in low-lying soils.
SOIL CONDITIONS AND PRODUCTIVITY
Li Tianjie (1990) indicates that Chinese grassland scientists have developed advanced approaches to soil inventory in the eastern grasslands. According to Li, "the task of [remote] soil cover interpretation is to distinguish the individual soil unit (type), soil association (community), and its spatial form and structure and geometric shape." Li uses satellite images of various spectral features of soil cover that show specific conditions on the land surface. He shows that soil mantle zones are generally aligned from northeast to southwest, as influenced by the nearby mountains. Thus, the east-to-west sequence of soil zones on the Horqin Plain is temperate forest steppe black soil, meadow steppe chernozems, steppe castanozems, semidesert brown calcareous soil, and desert soil. According to Professor Li, the distribution pattern of these soils varies according to the changes in elevation of the adjacent mountains. For example, in moving from east to west the alignment of arid steppe castanozems changes from northeast-southwest to east-west, owing to the influence of the Yinshan Mountains.
Li also reports on "soil cover degradation," a term that refers to the decline in productivity and quality of natural or artificial vegetation. Features of soil
cover degradation include (1) increase in the area of soils transformed by what the Chinese call "sandization" [sha-hua]; (2) deterioration of the physical properties of soil components, such as the loss of soil structure and the decline of soil water status; (3) decline of soil fertility and organic matter; (4) overall increase in the area of salinization and swamping; and (5) intensification of soil erosion. Li notes that natural environmental changes, socioeconomic development, and human activities are all major causes of soil cover degradation, with human activity being the most important.
According to Li, degradation of the grass cover is the most important cause of soil degradation in natural grasslands. Overgrazing and trampling by livestock are the main reasons for the loss of grass cover. The construction of roads, increasing access throughout the grasslands, is another factor. Li reports that all these phenomena can be seen clearly on Landsat Multispectral Scanner (MSS) imagery. Because of grassland degradation, organic matter in the soil decreases, soil structure changes, compaction occurs, and salinization and swamping develop.
Li concludes that it is important to use satellite remote sensing to monitor grassland resources, land use, and other dynamic changes of soil cover and structure. By establishing a correlation model that relates climate factors, soil moisture, and grassland biomass, and combining the model with remotely sensed images of vegetation growth, one can predict the biomass of various grassland types and use these projections for scientific management.
Shi Peijun of Beijing Normal University and his colleagues at Inner Mongolia University (1990) have investigated soil erosion problems of grasslands in Inner Mongolia, using both ground and remote sensing methods. This work was carried out in three steps: (1) analysis of information from ground investigations; (2) construction of indices of soil erosion from visual interpretation of remotely sensed images; and (3) relating the information from steps 1 and 2. Shi et al. (1990) classify soil erosion as shown in Table 3-2. "Class 3" erosion—2500–5000 tons/km2 per year—would be considered serious by U.S. standards (i.e., 4–7 tons per acre per year). Table 3-3, which shows areas affected
Table 3-2 Soil Eroison Index (tons/km2 per year)
|
Type/Class |
Water Erosion |
Wind Erosion |
|
1. Gentle |
<200 |
<240 |
|
2. Light |
200–2500 |
240–2250 |
|
3. Medium |
2500–5000 |
2250–4500 |
|
4. Strong |
5000–8000 |
4500–9000 |
|
5. Grave |
8000–15,000 |
9000–18,000 |
|
6. Severe |
>15,000 |
>18,000 |
|
SOURCE: Shi et al. (1990). |
||
Table 3-3 Severity and Regional Pattern of Soil Erosion in Inner Mongolia, by Class and Percentage of Area Affected, for Six Classes of Erosion
by each class (or degree) of erosion, demonstrates that only 5% of the land suffers from water erosion that is ''medium'' or worse, whereas 38% suffers from wind erosion at or above this level (i.e., class 3).
GRAZING PRACTICES
A good example of research on the problems of grassland production and utilization in northeast China is the work of Liu (1990) on the protection, utilization, and management of the Jirem grassland, which lies on the Horqin Plain in easternmost Inner Mongolia. This area has fluctuating moderate precipitation and good summer warmth, and numerous pasture species and varied grassland types provide favorable conditions for the development of animal husbandry. The total land area of the Jirem grassland is 65,000 km2 including 7334 km2 of cultivated land and 36,068 km2 of available pasture, on which 9,500,000 sheep are reared.
Liu's investigations have shown that two-thirds of the Jirem grassland is degraded and undergoing regressive succession. The community composition is being simplified, good herbage species are being reduced, production is declining, and environmental conditions are worsening. According to Liu, the
main cause of this decline is overgrazing. He estimates that the annual pasture production is 10.6 × 10⁸ kg of dry matter (DM), whereas the livestock feeding requirement is 16.8 × 10⁸ kg DM, leaving a deficit of 37%. In addition, more than 7334 km2 of grasslands have been cultivated for cereal production, causing subsequent destabilization and sand desertification.
Liu argues that grazing time and intensity strongly influence animal performance, vegetation regrowth, protection, and future production from these grasslands. The later tillering stages of grasses and branching in early flowering stages of legumes are the best times for grazing to begin. After a period of grazing, the grasses should be allowed to regrow to at least 15 cm before further grazing. Liu recommends that grazing be forbidden during the first 12–18 days after the grass turns green in spring and for 30 days after the cessation of growth at the end of the season.
Professor Zhu Tingcheng and colleagues (1989) of the Northeast Normal University have done research on the relationship among increasing human population, increasing livestock numbers, and the declining condition of grasslands in northeastern China.
DESERTIFICATION CONTROL
Shelterbelt Systems Since the forest steppe zone has had some forest cover in the past, the establishment of shelterbelts and increased fuel production by sand-stabilizing shrubs and low trees could be important to a rangeland restoration strategy. During the past decade, research by the Institute of Applied Ecology in the Wulanaodu Research Station, at the eastern end of the Horqin Sandy Land, South of the Xilamulun [Xar Moron] River, has contributed to a better understanding of the potential for rangeland restoration.
Cao (1984) describes Wulanaodu, a production brigade in the Wengniute Banner of Inner Mongolia. The brigade covers 22,667 hectares. Over the last 30 years, its human population has doubled to 1310 people, whereas livestock have increased 2.3 times to 16,846 animals. The rangeland has been devastated by overgrazing to such a degree that herbs that grew to 1.5 m in the 1950s now reach only 50–60 cm. The desertification and alkalinization of the soil have led to the degradation of pastureland and a decline in livestock productivity. The livestock cannot get enough fodder even during the peak growth period in June, a situation that sometimes lasts for several years. The mortality of overwintering livestock is reported to be as high as 7% in dry years.
According to Cao, primary productivity of the pasture is low and unstable. In recent years, the hay yield per hectare has been only 1100–1500 kg on mowed grasslands and 450–600 kg in grazing areas. The mowed grasslands and the grazing "banks" cover 5467 hectares and support 16,846 head of livestock, for an average of 0.3 hectare per head, compared with 1–2 hectares per head in European mountain pasturage.
Cao proposes a model to restore these grasslands, based on a three-dimensional design of herbaceous and ligneous plants, that can more fully utilize energy sources above-and below-ground. The model is based on the principle that livestock occupy less area, while each part of the system performs multiple functions. Forests surround and protect the pastures; a "shelterbelt network" reduces wind velocity, prevents wind erosion, diminishes evaporation, and eliminates damage caused by dry wind. Fodder shrub species can be used to stabilize the most volatile areas.
In one application of this model, 800 hectares of sand dunes have been enclosed. In an area of 267 hectares, 30 hectares have been planted in Pinus sylvestris var. mongolica and the rest in shrubs to stabilize mobile sands. Vegetation now covers 30% of this space. In 1983, 10,000 kg of hay and 4000 bunches of osier (wickers) were harvested. A fodder field of 33 hectares has been established within the windbreak. With such protection the ensilage maize harvest amounts to 75,000 kg per hectare, and the high-yielding fodder crop Astragalus adjurgens has reached 36,800 kg per hectare compared to conventional hay production of 1100–1500 kg per hectare.
Salinization Abatement Numerous advances have been made in controlling soil compaction and salinization in overgrazed rangelands of the northeastern meadow steppe region. Cao (1984) describes one approach tried by the Institute of Applied Ecology at the Wulanaodu Research Station. After noting treatments designed to modify the wind climate and vegetative cover in the area, Cao recommends soil remediation by plowing and harrowing. It must be noted that the soils in this area are poor in the main nutritive elements and must be replenished by fertilizers, especially in fodder fields. With regard to soil amendments, experiments to plow and harrow pastures with alkalinized soil, to apply powdered plaster to improve soil texture, and to add nutritive elements (ammonium sulfate, triple superphosphate, and zinc sulfate) to the soil have been carried out over an area of 10 hectares. According to Cao, these methods have increased hay yields by 70–100%.
Steppe Seeding and Restoration Li Yuchen (1990) of the Grasslands Station of Chifeng City, south of the Wulanaodu research area, presents a good example of "comprehensive treatment" of "sandification" in the West Liao River plain. Researchers in this area have developed tree and shrub windbreaks, fencing and to rotation-grazing systems, and aerial seeding of grasses, shrubs, and forbs.
Aeroseeding began in 1979 and by 1988 had been extended to 84,000 hectares. Test results indicate successful aeroseeding of grass and forbs on the gently sloping sandy land, with a vegetative cover rate of about 15% on "sandified" rangeland and abandoned uncultivated land. Two to three years after aeroseeding, the overall vegetative cover rate increased to 60–75%, and the highest rate to
more than 85%. Li reports that biomass increased to 4500–6750 kg per hectare, and in some cases to 12,750 kg per hectare. Aeroseeding also increased the biological diversity of this vegetation cover from a range of 1–24 species before seeding to 8–40 species afterward. The main species adopted for aeroseeding were Caragana microphylla, Astragalus adsurgens, Hedysarum fruitcosum, Lespedeza sp., and Agropyron cristatum. These species stabilize the sand and serve as forage. Li concludes that approximately 30% of the semidrift sandy land and gently sloping drift sandy land are suitable for aeroseeding and urges the government to invest funds in aeroseeding in the Horqin Sandland region.
Livestock Rotation Research on the potential for livestock rotation as a means of reducing the degradation of grasslands is underway at several locations in the forest steppe zone. Sheehy (1990) reports one example from the Ih Nur Pilot Demonstration Area, Balinyouqi [Bairin Right Banner] near Chifeng City, Inner Mongolia. The Ih Nur area was established in 1985 as a focus for modernizing pasture and livestock management. In 1985, it covered 6000 hectares (90,000 mu ) and provided forage for 13,561 sheep equivalent units (SEU). By 1987, livestock in the area had increased by 5.9% to 14,355 SEU. Measurement and comparison of standing crops available to livestock in the pilot area and within grazing exclosures were used to determine the productivity of the rangeland with and without grazing and the amount of vegetation being consumed by livestock during the growing season.
A four-pasture deferred rotation system has been developed for the Ih Nur area. In this system, the key species of grasses are crested wheatgrass (for the cool season), Baical needlegrass (for the warm season), and Cleistogenes (for the warm season). Key forbs are Lespedeza and wild alfalfa. Each of four pastures is deferred from grazing during a different season over a four year period. For example, in year 1, pasture A is rested during the winter season, pasture B during the spring season, pasture C during the summer season, and pasture D during the winter season. Each succeeding year, a different pasture is deferred during each season, so that after four years each pasture has been deferred in each season. In the fifth year, the deferment cycle begins again. Although the four-pasture system corresponds to the existing management units, Sheehy says that a three-pasture and a two-pasture system would also be applicable.
According to Sheehy, one of the major advantages of this grazing system is the simplicity of decision making by the herdsmen regarding numbers of animals. Using this system, the herdsmen do not have to decide on proper animal numbers or the correct stocking rate. Rather, they can continue to make traditional decisions about whose livestock, or how many livestock, can use nondeferred pastures in each grazing management unit. The only restriction is that no livestock use the deferred pasture during the season of deferment. Families or groups of families can rotate their herds within a single grazing management unit or combine all livestock of a particular type (e.g.,
cattle) into a single herd and rotate the large herds through all nondeferred pastures of all grazing management units on the production team.
Sheehy recommends the establishment of a monitoring and evaluation system for each grazing management unit. This system should consist of a permanent vegetation cover transect and a grazing exclosure in each pasture. The purpose of the permanent cover transect would be to monitor changes in vegetation composition and cover, in order to evaluate the effect of grazing on vegetation. Sheehy reports results showing rapid improvements in biomass following the establishment of exclosures, but no results on the benefits of the rotation.
RESEARCH NEEDS AND OPPORTUNITIES
Chinese scholars have done little modeling of grassland ecosystem responses to overgrazing or restoration measures. One exception is the work of Wang (1984) on the Horqin Zuoyi Banner. Wang reported that between the 1950s and the mid-1970s, the area of this banner covered by shifting sandy land increased from 15.0 to 20.7%, while the area covered by semifixed sandy land increased from 40.2 to 49.8%.
Wang further studied these changes in a 334-km2 site encompassing and surrounding the Daqingou Conservation Area. The general pattern of change from fixed or semistable vegetation toward unstable or shifting sands at this site is evident in Table 3-4. Combining a series of black and white and color infrared aerial photographs with ground observation data, Wang produced thematic maps showing the trend in desertification during two periods, 1958–1975 and 1975–1981, the latter being a period of concerted control measures. On the basis of both environmental (types of soils) and socioeconomic (grazing intensity) data, Wang also determined discriminating criteria for the specific areas of desertification.
In more recent work, Professor Wang (personal communication, 1986) has used these rates of change, based on grazing intensity, soil condition, and
Table 3-4 Change in Type and Amount of Sandy Land, from 1958 to 1981, Daqingou Conservation Area, Inner Mongolia (km2)
|
|
Year |
||
|
Type of Sandy Land |
1958 |
1981 |
Change, 1958 to 1981 |
|
Shifting |
9.16 |
37.39 |
+28.23 |
|
Semishifting |
31.51 |
98.43 |
+66.92 |
|
Semifixed |
126.60 |
83.33 |
-43.27 |
|
Fixed |
52.26 |
13.22 |
-39.04 |
|
SOURCE: Wang (1984). |
|||
other factors, to project the extent of desertification in specific locations over the next 15 years. Models of this type, applied through an effective extension system, could help alleviate the problems described above. However, the required extension programs are nonexistent, and Wang fears that the results he has been reporting will not be recognized and applied until conditions are so severe that grazing is no longer possible.
Cao (1984), working in the Horqin Sandy Plain, suggests that local managers need to adopt new systems for grassland utilization that rationalize the relationship between seasonal animal demand and seasonal pasture production. According to Cao, the design of such systems will require better data on the types of animals grazed, their number, rate of increase, seasonal performance, and pattern of migration, as well as the types and distribution of grasslands, their composition, regrowth after cutting or grazing, and degree of utilization.
CONCLUSION
The most serious problem in the grasslands of the Northeast, as in other parts of China, is the absence of institutional mechanisms for translating the results of existing grassland research into more effective grazing systems that can be adopted on a wide scale. Scattered demonstration projects appear successful, but without the means to influence local or regional governments, desertification continues to worsen. In the grasslands of the Northeast, work in the natural sciences is more advanced than in the social sciences, and basic research is more advanced than technology transfer. The most urgent need in this region is for effective demonstration projects that can incorporate the lessons of scientific research into decision making by counties or banners, villages, and individual herdsmen.
REFERENCES
Cao Xinsun. 1984. Neimenggu Wulanaodu shengtai xitong de jigou gongneng he zhuanbian fangshi [The structure, functions and the way of transforming the ecosystem of Wulanaodu, Inner Mongolia]. Pp. 41–44 in Tudi shamohua zhonghe zhili guoji yantaohui lunwenji [Proceedings of the International Symposium on Integrated Control of Land Desertification], Zhongguo ren yu shengwujuan weiyuanhui [Chinese National Committee for Man-and-the Biosphere], ed.
Jiang Fengqi. 1984. Nongyedai bianyuanqu fanghulin xitong de yanjiu [Study of protective forest systems in marginal agricultural zone]. Pp. 62–67 in Tudi shamohua zhonghe zhili guoji yantaohui lunwenji.
Li Jiandong. 1990. Zhongguo beibu jianhua yangcao caoyuan de gailiang yu youhua shengtai moxing [Improvement of alkaline Aneurolepidium chinense steppe in northern China and optimum ecological modeling]. In Zhongguo beibu caoyuan de youhua shengtai moxing yanjiu xiangmu [Project on Optimum Ecological Modeling of Grassland in Northern China], Zhang Xinshi, director. Research project sponsored by the National Science Foundation of China.
Li Tianjie. 1990. Yaogan zai Neimenggu caoyuan tubei diaocha, zhitu he jiance zhong de yingyong [Application of remote sensing to the investigation, mapping, and monitoring of soil cover in the grassland of Inner Mongolia]. Pp. 83–89 in Guoji caodi zhibei xueshu huiyi lunwenji
[Proceedings of the International Symposium of Grassland Vegetation], Yang Hanxi, ed. Beijing: Science Press.
Li Yuchen. 1990. Keerqin shadi de shahua guocheng ji zhonghe zhili [Sandification process of Horqin sandland and its comprehensive treatment]. Pp. 621–626 in Guoji caodi zhibei xueshu huiyi lunwenji.
Liu Xianzhi. 1990. Zhelimu caoyuan de baohu ji qi guanli [The protection, utilization, and management of Jirem grassland]. Pp. 609–611 in Guoji caodi zhibei xueshu huiyi lunwenji.
Nan Yinhao. 1984. Wulanaodu diqu zhibei [Vegetation of the Wulanaodu region]. Pp. 173–189 in Neimenggu dongbu diqu fengsha ganhan zhonghe zhili yanjiu [Studies on the Integrated Control of Wind, Sand Drifting and Drought in Eastern Inner Mongolia], Cao Xinsun ed. Vol. 1. Hohhot: Inner Mongolia People's Publishing House.
Sheehy, Dennis P. 1990. Caiyong yanqi lunmu fangshi lai gailiang Neimeng zhongdongbu tianran caoyuan [Using deferred rotation grazing to improve the natural rangelands of east-central Inner Mongolia]. Pp. 613–620 in Guoji caodi zhibei xueshu huiyi lunwenji.
Shi Peijun et al. 1990. Yaogan zai Neimeng turang qinshi yanjiu zhong de yingyong [Research on soil erosion in Inner Mongolia of China by remote sensing]. Pp. 137–140 in Guoji caodi zhibei xueshu huiyi lunwenji.
Wang Yimou. 1984. Yaogan jishu zai shamohua shengtai yanjiu zhong de yingyong [Application of remote sensing techniques to the study of the dynamics of desertification]. Pp. 45–50 in Tudi shamohua zhonghe zhili guoji yantaohui lunwenji.
Zhang Xinshi. 1990. Zhongguo beibu caoyuan de youhua shengtaixue moxing yanjiu xiangmu [Project on Optimum Ecological Modeling of Grassland in Northern China]. Research project sponsored by the National Science Foundation of China.
Zhao Xianying. 1990. Zhongguo wendai caoyuan gaishu [Survey of the temperate steppe of China). Pp. 235–238 in Guoji caodi zhibei xueshu huiyi lunwenji.
Zhu Tingcheng et al. 1989. Caodi tuihua yu caodi shengtai gongcheng jianshe [Grassland deterioration and reconstruction by grassland ecological engineering]. Pp. 19–22 in Zhongguo caodi kexue yu caoye fazhan [Grassland Science and Grassland Development in China], Zhongguo caodi kexue xueshu yantaohui lunwen bianxiezu, (Review Panel for Proceedings of the Chinese National Symposium on Grassland Science], ed. Beijing: Science Press.


