
6
Dolphin Mortality and Abundance
ESTIMATING INCIDENTAL DOLPHIN MORTALITY
In the early years of the purse-seine fishery, data on dolphin mortality were not collected systematically. Data are even marginally usable for only three of the several thousand fishing trips made between 1959 and 1970. In 1972, NMFS began regular sampling of the U.S. fleet, then predominant in the fishery (Smith and Lo, 1983); this program continues. In the late 1970s, however, other fishing nations began to increase their fleets, and IATTC started an international observer program, which became operational in 1979. Until recently, having an observer on board every trip undertaken by the tuna fleet was considered too costly, which left the sampling of a proportion of these trips as the only practical alternative. In all cases, observers at sea gather information on dolphin mortality, the use of equipment and procedures to reduce dolphin mortality, sightings of dolphin herds, and other biological and environmental data. Observers are debriefed at the end of their trips to clarify data and correct errors. The data are then subjected to several quality-control procedures.
Most of the following discussion is excerpted from a document prepared for the Tuna-Dolphin Workshop organized jointly by NMFS and IATTC in San Jose, Costa Rica, in March 1989 (IATTC, 1989c). Methodological considerations, factors affecting total mortality estimates, and estimates for 1959–1990 are covered.
Methodological Considerations
Sampling Design
Given the nature of the problem, the estimation method used must compute an average mortality from a sample and then extrapolate these results to the whole population from which the sample was taken. Several options are available for sampling.
-
Compute the average mortality per day at sea and extrapolate to total fleet days. Days at sea and fishing activity correlate well, but the correlation is far from perfect, because days at sea are spent in activities other than fishing, such as running to the fishing grounds, waiting for storms to pass, or drifting because of a malfunction. Indeed, a vessel may spend a whole trip fishing on logs or schooling tuna (i.e., not fishing on dolphins), but the days at sea will be added for the extrapolation. The total number of fleet days is obtained from departure and arrival records for all vessels. Location of fishing is not known; therefore, spatial considerations are not possible. NMFS uses this method for its current (real-time) estimates of dolphin mortality for the U.S. fleet.
-
Compute the average mortality per set on dolphins and extrapolate to total fleet sets. By using the sets as the measure of fishing activity, many of the uncertainties or ambiguities of days at sea are eliminated. By using sets on dolphins, all the fishing effort directed toward fish not associated with dolphins is eliminated. Effort can be differentiated according to the dolphin species involved and only the right share of the total effort can be applied in the extrapolation. Knowing the locations of the sets allows the use of spatial stratification.
-
Compute the average mortality per ton of fish caught, either yellowfin only or the sum of yellowfin, skipjack, and bigeye (Thunnus obesus) tuna and extrapolate to the total catch of tuna by the fleet. This method has the same advantages as the previous method. An additional advantage is that the mortality in a set is correlated with the size of the catch. The main drawback is that the catch in each set is an estimate, creating a new source of error.
Ratio Estimates
Estimates of mortality per unit of fishing effort (days, number of sets, weight of fish caught) are known as ratio estimates. Ratio estimates are frequently biased, that is, they tend to systematically over- or underestimate. Several options have been proposed to reduce this bias. Some have suggested modifications to the basic formula used to compute the ratio (Mickey, 1959; Pascual, 1961; Tin, 1965; reviewed in Rao, 1969). Another alternative is the use of resampling techniques that may help reduce bias.
The procedure called bootstrapping (Efron, 1982) consists of sampling repeatedly with replacement from the data base of trips. The repetitions allow the calculation of standard errors without making a set of assumptions about the distribution of the variables. In addition to being useful for estimating variances and confidence intervals, the bootstrap procedure may reduce bias in the estimates, and for these reasons it was introduced into the estimation methodology.
The Observer Effect
For purposes of estimating mortality, vessels are assumed to fish in the same areas, make similar proportions of the different types of sets, and use similar gear and procedures to reduce dolphin mortality whether or not they carry an observer. The validity of this assumption cannot be verified; only anecdotal information has been used as evidence. Thus, little scientific evidence supports the existence of an observer effect. The only way to eliminate any potential observer effect is 100% coverage.
MORTALITY ESTIMATES FOR 1959–1990
1959–1972
Few data are available for the early years of the fishery (Lo and Smith, 1986). Former crew members who were concerned about high dolphin mortality provided data for the first two trips, and a government observer provided data for the third. Thus, the data do not come from any valid sampling design. Trips were not selected at random or according to any pattern. The accuracy of the data is questionable because no standard procedure was used to collect information, and interpretation of the data cannot be determined to be correct. Estimating the standard errors is especially difficult.
A substantial problem also exists with bias in ratio estimates when sampling coverages are low. Using statistical simulations (IATTC, 1989c), the positive bias produced by ratio estimates at low sampling coverage results in overestimates of up to 4–5% at 5% coverage even after a bootstrap procedure has been applied to reduce bias. It is likely that the overestimates were even greater at the much lower coverage—about 0.1%—used earlier and when no procedures to reduce bias were applied.
In summary, the mortality estimates for the period before 1973 (peak values of up to 350,000–653,751 in a year by Perrin, 1968, 1969; Smith, 1979, 1983; Lo and Smith, 1986) have little or no statistical value, and the only conclusion that can be based on the data available is that mortality was very high. After a long hearing, the administrative law judge, Hugh Dolan,
concluded that many errors had caused dolphin mortality to be seriously overestimated and dolphin abundance to be seriously underestimated by NMFS in the 1960s and 1970s (Dolan, 1980).
Nonetheless, these mortality data were used to calculate estimates of dolphin abundance for 1959–1970; these estimates were used later to conclude that some stocks were depleted or were at a given proportion of their original abundance.
1973–1978
Wahlen (1986) computed mortality estimates for the U.S. fleet for 1973– 1978. During those years, after passage of the U.S. Marine Mammal Protection Act of 1972 (MMPA), the data collection system for the U.S. fleet improved considerably. With more and better standardized data, dolphin mortality was shown to have declined from over 100,000 dolphins per year to approximately 20,000. During that period, the fleets of other countries increased in size, prompting the creation of IATTC's international observer program.
1979–1990
Various estimates of dolphin mortality for the international fleet were produced between 1979 and 1983 (Allen and Goldsmith, 1981, 1982; Hammond and Tsai, 1983; Hammond, 1984; Hammond and Hall, 1985). From 1984 on, the methods used to estimate mortality were modified, and figures for 1979–1988 are presented in a series of publications (Hall and Boyer, 1986, 1987, 1988, 1989, 1990, in press, a,b). A review of all the figures for 1979–1987 is also available (IATTC, 1989c). Figure 6-1 shows the estimates for 1972– 1990.
FACTORS AFFECTING TOTAL MORTALITY ESTIMATES
Fishing Effort on Dolphins
The catches resulting from school fishing, log fishing, and dolphin-associated fishing usually are quite different in species composition and distribution of sizes of fish caught. Sets on floating objects (log sets) usually produce large amounts of skipjack associated with small yellowfin (<70–80 cm). The fish caught in school sets are slightly larger than those caught in log sets, and the distribution of size is broader in school sets than in log sets.
Sets on dolphins yield the largest tuna caught in the purse-seine fishery; most are longer than 80–90 cm and frequently are over 100 –110 cm, and almost all of them are yellowfin. The canneries pay higher prices for large
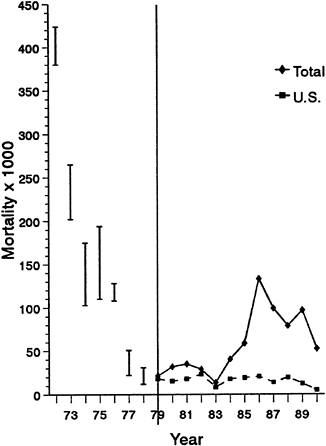
FIGURE 6-1 Estimated total mortality of dolphins, 1972–1990. Data for the period before 1979 are subject to controversy and do not permit reliable breakdown between U.S. and non-U.S. sources. See text. Data from IATTC; except total mortality data for 1972– 1978; in those cases, the high range is from NMFS (1980a) and the low range is extrapolated from a figure produced by a workshop and reported by IATTC (1989c); U.S. mortality data are from NMFS (MMC, 1991).
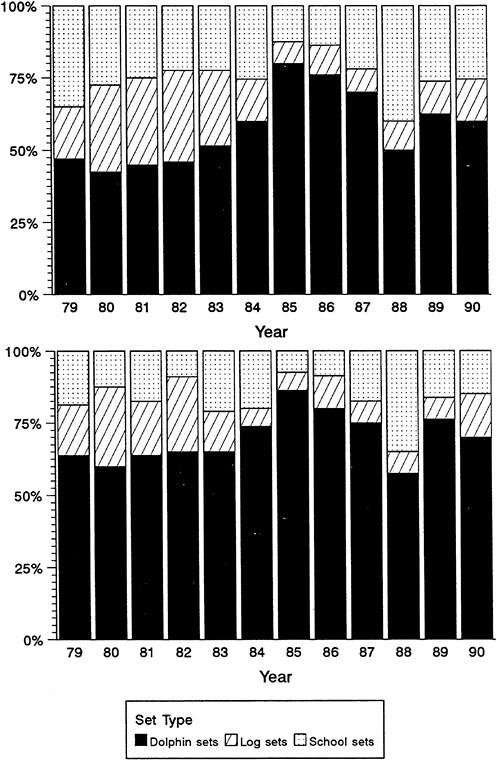
yellowfin than for other fish because they produce greater yields with less labor. In recent years, the gap between the prices paid for large and small yellowfin has fluctuated considerably, influencing the selection of mode of fishing by the fishermen. Figure 6-2 shows the proportion of sets made on dolphins, logs, and school fish, and the proportion of the total tonnage caught in each type of set during 1979–1990. When the price gap is wide, effort concentrates on dolphins, as in 1985–1987, resulting in large increases in the number of sets and in the tonnage caught on dolphins. In previous years, when the price difference was less, the proportion of all sets made on dolphins was also much smaller. In 1988, effort on dolphins declined markedly, but in 1989, the number of sets on dolphins increased by 19.6% over 1988 to a record high (IATTC, 1991a).
The level of effort on dolphins may also be affected by the dolphin-tuna association, which may be less frequent or more temporary during certain years. A good example of this effect is the 1982–1983 period, when a very strong El Niño event disrupted the fishery. One of the main fishing areas for dolphin-associated tuna (along latitude 10 °N) was quite unproductive, and fishing on dolphins declined considerably. The changes in oceanographic conditions, especially the patterns of the temperature fields and thermocline depth, may have driven the tuna deeper and made them less available to surface gear, or perhaps the changes in currents shifted the location of the productive fishing grounds to areas not normally fished by the fleet.
Finally, due to a series of environmental, biological, and fishery factors, the abundance of large yellowfin increased to very high levels in the mid to late 1980s (IATTC, 1989a).
Factors Directly Affecting Dolphin Mortality
Many factors other than total fishing effort influence dolphin mortality, and we probably do not know all of them. Some of the most important are described briefly below. Many of these factors are interrelated. For instance, in general terms, the larger the catch of tuna in a set, the longer the set will last, the larger the number of dolphins that will be caught, and the more likely it is that the set will finish after dark (dolphin mortality increases markedly after dark) or that a malfunction will occur. Also, different species or stocks of dolphins have different herd sizes and behavior patterns and inhabit different areas. Some areas and some species or stocks are fished during only part of the year, so spatial, temporal, and species effects cannot be distinguished. This makes it difficult to identify precisely the cause-effect mechanisms that result in the higher or lower mortalities.
Catch of Tuna in Set
The size of tuna catches affects mortality per set (MPS) and mortality per ton (MPT). Clearly, years with high abundance of tuna will result in larger average catches, and therefore higher mortalities per set. In recent years, the average catch per dolphin set has been roughly twice the average in the early 1980s (IATTC, 1989b).
Vessel Captain
Frequency distributions of 1989 observed average dolphin kill per set and total annual dolphin kill by vessel captain are given in Figure 6-3 and Figure 6-4, respectively (approximately 100% of U.S. trips and 35% of non-U.S. trips were observed in 1989). Figure 6-5 is taken from Figure 6-4 and shows the
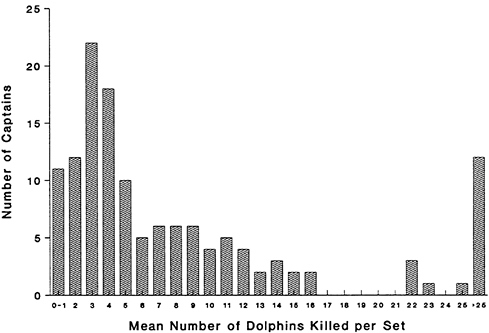
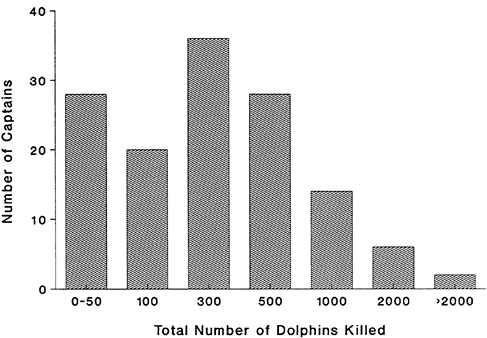
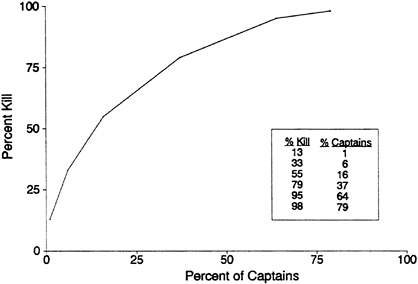
FIGURE 6-5 Percentage of captains and observed dolphins killed for 1989. Data extrapolated from Figure 6-4.
cumulative percentage of observed kill in 1989 against the percentage of observed captains that accounted for that kill. Approximately 15% of the total number of vessel captains accounted for 50% of the total dolphin kill, and conversely, 50% of the vessel captains accounted for less than 15% of the total dolphin kill. Although kill per captain is a function of the number of sets on dolphins as well as the captain's skill, skill is important. Data need to be collected and reported in such a way that these factors can be discriminated.
Species or Stock Caught
Several species or stocks of dolphins associate with tuna in the eastern Pacific. Some of the stocks occupy a large portion of the range of the fishery; others are present only in limited areas. Two sources of heterogeneity in the mortality rate of dolphins should be considered: (1) different species or stocks have different MPS values; and (2) the same species or stock may have different MPS values in different regions of the fishery.
The current mortality rates for common dolphins in sets is much higher than those for any of the other species. The average herd size for common dolphins (approximately 500) is greater than for the other stocks or species (spotted dolphins, 400; eastern spinner dolphins, 160; and whitebelly spinner dolphins, 180), and their more active behavior in the net makes them more likely to become trapped or tangled (IATTC, 1989c).
Area of Capture and Habituation
Cumulative effort and MPS values in an area are negatively correlated. Areas with more sets historically have lower MPS values; the edges of the fishery and some areas to the south that receive less effort have greater MPS values (IATTC, 1989c). This topic was discussed by Hall et al. (in press), who showed that the behavior of the dolphins seems to be affected by the fishing activity in the area in a way that leads to a reduction in mortality and that perhaps learning on the part of the dolphins was lowering the values. A spatial stratification scheme based on one-degree areas is used to increase the precision of the estimates.
Flag of Vessel
Early estimates of mortality (Allen and Goldsmith, 1981, 1982; Hammond and Tsai, 1983; Hammond, 1984; Hammond and Hall, 1985) included a stratification based on the flag of the vessel. The assumption was that countries with different degrees of regulation or enforcement were likely to have differences in mortalities. As sample sizes were insufficient to stratify by all flags, a category called “non-U.S. ” was used, although this group was in itself heterogeneous. However, a series of statistical tests (Hall and Boyer, 1986) for 1979-1983 showed that when fishing area was taken into account, it was not possible to reject the null hypothesis of equal MPS values for the two groups. Only two of seven areas used had significant differences, and they were of opposite sign. The conclusions of the study were that stratifying by area made more sense than stratifying by flag when samples were limited and that any differences between flags should be dealt with by using a proportional sampling design and taking the same proportion of all flags.
In recent years, however, the sampling coverage of the U.S. fleet, which is determined by NMFS, has been quite variable because of changes in policy. The rates of sampling have gone from 40% to 100%, down to 50%, and back up to 100% (IATTC, 1989c). These changes in coverage generate a bias by altering the proportion of samples from the U.S. fleet and also, in some cases, by affecting the behavior of the fleet, because the changes were made in response to reaching quotas or to lawsuits. The sampling rates for the non-U.S. fleets have been increasing, which has allowed an additional stratification by flag since 1986, and the results of these samples are added to compute the total for the international fleet. In recent years, the kill rate of the U.S. fleet has been lower than the average of the international fleet.
Time of Capture (Day vs. Night Sets)
Night sets (sundown sets) are defined as those in which the backdown procedure finishes in darkness. Because of the additional difficulties that
darkness generates for the dolphin rescue effort and also for the dolphins' perception of the situation, sundown sets have much higher mortality rates than day sets. The reduction in light at dusk below the sea surface is much greater than above it (McFarland and Munz, 1975) and many animals use visual sensitivity then (McFarland and Loew, 1983). The number of dolphins left in the net after the backdown maneuver is much higher in sundown sets. According to IATTC (1989c), sundown sets, which were only 9.3% of nearly 16,000 observed sets, accounted for nearly 26% of the dolphin mortality.
Duration of Set
Longer sets have higher mortality values than shorter ones. Typically, the backdown procedure lasts about 15 minutes; however, sets with backdown lasting 40 minutes or more have mortality rates 10 times higher than sets with backdown lasting 20 minutes or less (IATTC, 1989c). Long backdowns are infrequent and may be associated either with the capture of large herds of dolphins or with a malfunction, so one cannot assume that the duration of the set is the sole cause of high mortality. However, it is obvious that the longer the dolphins stay inside the net, the more likely they are to become entangled or die trapped by a net collapse or canopy.
Presence of Strong Currents
Strong subsurface currents affect the behavior and handling of the net and may cause net collapses, one of the major causes of mortality. Sets encountering these currents result in mortality rates twice as high as sets made in normal conditions (IATTC, 1989c).
Occurrence of Malfunctions
Malfunctions of many kinds can occur during a set. Some affect the skiff, some the speedboats, some the main vessel, and some the net. Sets with minor or major malfunctions have mortality rates about twice as high as those without malfunctions (IATTC, 1989c).
Alignment of the Fine-Mesh Panel
The fine-mesh panel forms the end of the backdown channel and is effective in reducing mortality if it is properly aligned. If it is not, its efficiency decreases sharply, and MPS and MPT more than doubles (IATTC, 1989c). Proper alignment can be achieved by performing a trial set.
Use of Dolphin-Saving Procedures
The correct use of all dolphin-saving procedures usually reduces mortality considerably. Preventing net collapses and canopies, or counteracting them when they happen, also helps. Sets with net collapses or canopies have mortality rates 2 to 3 times higher than sets without such collapses or canopies. The presence of a crewman in a raft in the backdown channel is associated with a reduction in the MPS from 11.6 to 5.1 and the MPT from 0.86 to 0.36 (IATTC, 1989c).
Relationship Between Number of Vessels and Total Mortality
Table 6-1 shows the relationship between the total carrying capacities of vessels in the ETP, the carrying capacities of the U.S. fleet fishing in the ETP,
TABLE 6-1 Carrying Capacity, in Metric Tons, of the International and U.S. Tuna Purse-Seine Fleets, and Total Dolphin Mortality, 1974–1990 a
|
Carrying Capacity |
Estimated U.S. Dolphin Mortality |
|||||
|
Total |
U.S. |
Total Dolphin Mortality |
||||
|
Year |
Seiners >400 Tons |
All Seiners |
Seiners >400 Tons |
All Seiners |
||
|
1974 |
138,901 |
161,983 |
107,854 |
118,475 |
103,000–175,000 |
|
|
1975 |
158,567 |
180,470 |
122,716 |
132,848 |
110,000–194,000 |
|
|
1976 |
173,734 |
194,469 |
124,255 |
133,361 |
108,000–128,000 |
|
|
1977 |
177,421 |
197,052 |
122,405 |
130,221 |
22,000–51,000 |
|
|
1978 |
176,054 |
199,220 |
113,050 |
122,559 |
12,000–31,000 |
|
|
1979 |
178,765 |
202,407 |
113,218 |
122,941 |
21,426 |
17,938 |
|
1980 |
181,991 |
203,481 |
117,147 |
124,614 |
31,970 |
15,305 |
|
1981 |
186,219 |
203,794 |
113,159 |
120,216 |
35,089 |
18,780 |
|
1982 |
170,786 |
184,893 |
109,100 |
114,840 |
29,104 |
23,267 |
|
1983 |
139,594 |
153,384 |
81,017 |
86,922 |
13,493 |
8,513 |
|
1984 |
114,871 |
125,036 |
48,777 |
52,700 |
40,712 |
17,732 |
|
1985 |
130,146 |
140,254 |
50,872 |
54,494 |
58,847 |
19,205 |
|
1986 |
125,740 |
135,065 |
44,664 |
47,645 |
133,174 |
20,692 |
|
1987 |
149,909 |
158,429 |
43,965 |
46,245 |
99,187 |
13,992 |
|
1988 |
154,399 |
163,258 |
46,531 |
49,026 |
78,927 |
19,712 |
|
1989 |
138,349 |
147,272 |
33,881 |
36,236 |
96,979 |
12,643 |
|
1990 |
140,910 |
149,279 |
33,220 |
35,412 |
52,531 |
5,083 b |
|
a Data from IATTC; except total mortality data for 1974-1978; in those cases the low range is extrapolated from a figure produced by a workshop and reported by IATTC (1989c) and the high range is from NMFS (1980a). US mortality data are from NMFS (MMC, 1991). Data for the period before 1979 are subject to controversy and do not permit reliable breakdown between U.S. and non-US sources. See text. b Because there was 100% observer coverage in 1990, the mortality for this year is a count, not an estimate. |
||||||
and the total dolphin mortality from 1974 to 1990. The total mortality dropped significantly between 1976 and 1977, largely because of industry gear development initiatives, which were then reflected in U.S. government regulations under the MMPA.
ESTIMATES OF DOLPHIN ABUNDANCE
Estimates of dolphin abundance in the ETP have been made by NMFS and IATTC, based on sightings made from either research vessels or fishing boats. Other methods of estimating abundance, such as mark-recapture experiments, or other sources of data, for instance sightings from aerial surveys, have proved inadequate for this purpose.
The sources of data for these estimate areas are as follows:
-
RVD (Research Vessel Data). Sightings from research cruises, designed and carried out by NMFS with the express purpose of estimating dolphin abundance. Holt and Powers (1982) produced estimates for 1979 using RVD alone and a combination of RVD and tuna vessel data. Since 1986, NMFS has made a series of five annual cruises to detect trends in abundance. The results are reported in Sexton et al. (in press) and Gerrodette and Wade (in press, a and b).
The RVD cruises are designed to provide a random distribution of effort and, therefore, unbiased estimation. However, given the size of the area over which the dolphin populations are distributed and the amount of searching effort (16,870 nautical miles in 1990, with 362 sightings), the estimates of abundance are imprecise. To reduce this imprecision, the data have been pooled in various ways, and as a result of this and other procedures applied to the data, RVD also produce estimates of relative abundance designed to detect trends over a period of time (Sexton et al., in press). A recent substantial revision of the methodology (Gerrodette and Wade, in press, a) reduces most of the biases; these estimates are recognized as being closest to estimates of absolute abundance (IWC, in press), and this method will be used in the future for RVD.
-
TVOD (Tuna Vessel Only Data). Sightings made from tuna vessels recorded by IATTC and NMFS observers placed on board to monitor the incidental mortality of dolphins in fishing operations. The analysis of these data have been carried out mostly by IATTC and reported in Hammond and Laake (1983) for the period 1975-1982, Buckland and Anganuzzi (1988), Anganuzzi and Buckland (1989), and Anganuzzi et al. (in press, a,b). Polacheck (1987) carried out an analysis (not based on line transect methods) of the U.S. TVOD.
The sample size for the TVOD data is very large (771,534 nautical miles searched in 1990, with 20,747 sightings), but because of the nature of the
fishery, searching is concentrated on areas of high density of dolphins. Unless this is taken into account in the analysis, the abundance will be overestimated. Various spatial stratification procedures have been used to alleviate these problems; see Buckland and Anganuzzi (1988) and Anganuzzi and Buckland (1989) for the most recent applications. These procedures aim at increasing the robustness of the estimates, rather than eliminating all sources of bias.
Analysis of the vessel sightings data has been based mostly on line-transect methodology (Burnham et al., 1980), which essentially estimates a correction factor to account for unseen herds of dolphins. A number of assumptions must be met in order for this method to produce unbiased estimates of abundance. These assumptions are violated to different extents by RVD and TVOD, and therefore, the statistical procedures applied in each case differ considerably. The resulting estimates are indices of relative abundance, indicating trends in abundance over the period of time in which the data were collected, rather than estimates of absolute abundance, i.e., the total size of the population. The section “Abundance and Size Structure” of yellowfin tuna contains further information on the difference between these two types of estimates.
The significance of a trend in relative abundance estimates, whether from RVD or TVOD, is determined on the basis of a linear test. A straight line is fitted to a subset of the time series of estimates, and if the slope of the line is significantly different from zero, the trend is considered significant. This test has been applied over a moving period of 5 years (Buckland and Anganuzzi, 1988; Anganuzzi and Buckland, 1989) and 10 years (Edwards and Glick, in press). However, given the imprecision of the estimates and the fact that the test does not take into account nonlinear changes in abundance, only very large changes in population size can be detected (Edwards and Glick, in press). To overcome these problems, Buckland et al. (in press) use a different method for detecting trends, based on a smoothing of the time series and a direct comparison of smoothed estimates. Additional studies are under way on the power of these tests.
Smith (1983) uses a different approach, which attempts to determine historical population levels. Estimates of abundance of three populations of dolphins (offshore spotted, eastern spinner, and whitebelly spinner) were calculated for 1959–1979, based on back-calculating estimated mortality and recruitment from the 1979 population estimates. However, as mentioned above, both mortality estimates for the period before 1972 and population estimates based on them have little or no statistical value.
The results of the analyses of RVD and TVOD are as follows:
-
Offshore spotted dolphin. This is the species most frequently set on: in the 1984–1988 period, 83.9% of dolphin sets were directed at spotted dolphins, either in pure herds or mixed with spinner dolphins. Abundance estimates for the northern stock for 1986–1990, based on RVD, average 1,514,800 animals,
-
with coefficients of variation (CV) between 29% and 36%; for the southern stock the corresponding figure is 267,400 (CV: 48–86%) (Gerrodette and Wade, in press, b). Estimated trends suggest a significant decline of the northern stock in the late 1970s, followed by a period of relative stability (and perhaps some increase) in the 1980s (Anganuzzi et al., in press, b; Buckland et al., in press). For the southern stock, there is an indication of a decline during the early 1980s. Recent high estimates for this stock suggest that the two stocks may not be as discrete as was thought, so these results should be treated with caution.
-
Spinner dolphin. RVD estimates for 1986–1990 average 588,500 animals (CV: 37–42%) for the eastern spinner, and 993,700 (CV: 38–64%) for the whitebelly spinner (Gerrodette and Wade, in press, b). No significant trends were reported in 1975–1990 for eastern spinners. Trends for the whitebelly spinners also indicate a stable situation in recent years, having a possible decline in the late 1970s. In 1986–1990, 21.9% of dolphin sets involved eastern spinners and 16.5% involved whitebelly spinners; in the great majority of these sets the spinners were in mixed herds with spotted dolphins.
-
Common dolphin. RVD estimates for common dolphins in 1986–1990 average 467,400 for the northern stock, 594,300 for the central stock, and 2,117,500 for the southern stock (Gerrodette and Wade, in press, b). Estimates for these populations are relatively imprecise, CVs ranging from 44% to 84%. Anganuzzi et al. (in press, b) and Buckland et al. (in press) reported a significant decline in the northern stock during the early 1980s, having an index of abundance for 1989 significantly lower than those for 1979–1981. The central stock showed evidence of a decline between 1978 and 1983 and subsequent stability. Data are sparse for the southern stock, but abundance in 1989 was significantly lower than in 1976–1978. In 1984–1988, 4.6% of purse-seine sets involved common dolphins.
-
Striped dolphin. Estimates in Gerrodette and Wade (in press, b) average 172,400 for the northern stock (CV: 37–62%) and 1,313,500 for the southern stock (CV: 27–30%). Sightings of striped dolphins in the TVOD data base are too rare for a reliable estimate.
The best estimate available of the average total population of these four species of dolphins in the ETP in 1986–1990, calculated from RVD by Gerrodette and Wade, “possibly [has] a slight negative bias ” and is slightly over 8,000,000 (Gerrodette and Wade, in press, b). Estimates of absolute abundance are very important because they convey the impact of the mortality within a stock due to fishing as a proportion of the total population, not as a number without any frame of reference (see Table 6-2).
In summary, both the NMFS and the IATTC studies demonstrate that none of the indicators of stock size shows any statistically significant trend in the last 5 years. The strong El Niño event of 1982–1983 affected many of the sources
of data, so it seems reasonable to use those years as a demarcation. Before 1982, and especially in the late 1970s, several stocks were experiencing large declines; since 1983 all indicators of stock size have been stable, and some appear to have been increasing (see Figure 6-6, Figure 6-7, and Figure 6-8). However, it should be borne in mind that the tests for trends are able to detect only fairly large changes (whether positive or negative) in the short term.
TABLE 6-2 Average Population Abundance in 1986–1990, Based on Research Vessel Surveys, Incidental Mortality in 1990, and Percentage of the Total Population Killed in the Fishery in 1990
|
Species and Stock |
Population Abundancea |
Incidental Mortalityb |
Percent Killed |
|
Offshore Spotted Dolphins |
|||
|
Northern Stock |
1,514,800 |
32,300 |
2.1 |
|
Southern Stock |
267,400 |
1,600 |
0.6 |
|
Spinner Dolphins |
|||
|
Eastern Stock |
588,500 |
5,400 |
0.9 |
|
Whitebelly Stock |
993,700 |
7,000 |
0.7 |
|
Common Dolphins |
|||
|
Northern Stock |
467,400 |
700 |
0.1 |
|
Central Stock |
594,300 |
4,100 |
0.7 |
|
Southern Stock |
2,117,500 |
300 |
0.0 |
a Data from Gerrodette and Wade, in press, b.
b Data from Hall and Boyer, in press, b.
SIGNIFICANCE OF THE ESTIMATES OF MORTALITY AND ABUNDANCE
For a complete assessment of the significance of estimated mortality and abundance to dolphin populations, a better knowledge of recruitment rates and dolphin migration is needed, as well as better stock identification of individuals. At present, the eastern spinner dolphin (Stenella longirostris orientalis) is the subject of current concern and currently being proposed for depleted status under the MMPA. Estimates of its numbers as a fraction of prefishery numbers vary widely, because baseline estimates of prefishery numbers are low and because estimates of mortality rate —themselves very imprecise for the years before the mid-1970s—are used in calculating population numbers. Furthermore, population estimates are complicated because hybridization with surrounding populations appears to be common. Some researchers believe that hybridization may be increasing because of inmigration from surrounding populations to areas of greatest mortality.
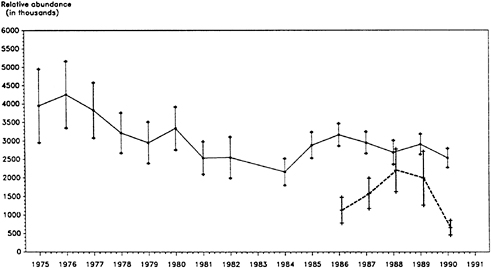
FIGURE 6-6 Relative abundance estimates for the northern offshore spotted dolphin. Solid line indicates estimates from TVOD (Anganuzzi and Buckland, 1989; Anganuzzi et al., in press, a; Anganuzzi et al., in press, b); dashed line indicates estimates from RVD (Gerrodette and Wade, in press, b). Vertical lines indicate estimate plus or minus one standard error.
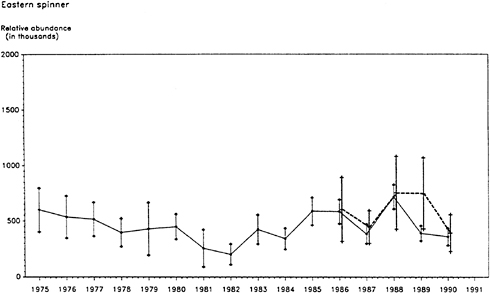
FIGURE 6-7 Relative abundance estimates for the eastern spinner dolphin. Solid line indicates estimates from TVOD (Anganuzzi and Buckland, 1989; Anganuzzi et al., in press, a; Anganuzzi et al., in press, b); dashed line indicates estimates from RVD (Gerrodette and Wade, in press, b). Vertical lines indicate estimate plus or minus one standard error.
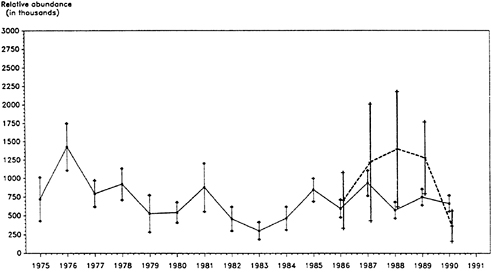
FIGURE 6-8 Relative abundance estimates for the whitebelly spinner dolphin. Solid line indicates estimates from TVOD (Anganuzzi and Buckland, 1989; Anganuzzi et al., in press, a; Anganuzzi et al., in press, b); dashed line indicates estimates from RVD (Gerrodette and Wade, in press, b). Vertical lines indicate estimate plus or minus one standard error.
Spotted dolphins, although they are the most frequent object of the seiners' efforts and suffer the greatest total mortality, seem not to have been depleted as much as the spinners, probably because their populations were much larger at the start of the fishery. The effect of the fishery seems thus far to have been of only modest importance for populations of other dolphin species of the region, although more information is needed, especially with respect to the common dolphin.
OVERVIEW: THE PAST, PRESENT, AND FUTURE
Historical Summary
Clearly, kill rates during the early years of the fishery were significantly reducing the populations of the most commonly caught dolphins. By the early 1970s, when the strictures of the MMPA were being felt, a decline in overall kill rates began under the guidance of NMFS, with the cooperation of the industry's fishery-research arm, the Porpoise Rescue Foundation. The reduction was achieved largely by training skippers to perform the backdown procedure; by helping quiescent dolphins from the nets; and by gear modifications, especially those which reduced tangling of dolphins in the net mesh.
By 1977, the mortality had declined substantially and remained low until the mid-1980s. As the overall kill rate dropped toward 25,000 per year (see Table 6-1 and Figure 6-1), other smaller factors began to be more important in producing year-to-year variations in kill than they were earlier. The El Ni ño years of 1982–1983 were especially important. As the fleet turned away from dolphin fishing, mortality rates dropped for a year or two, but rose again as oceanographic conditions returned to “normal” and the fishermen again fished on dolphins.
Then, as the majority of the U.S. fleet moved out of the ETP, responsibility for the attempts to reduce dolphin mortality moved primarily to IATTC. During this transition, kill rose at first as previously uncontrolled foreign vessels began to dominate the ETP fishery. IATTC developed a program to monitor and reduce the dolphin kill that began to take effect after the mid-1980s, and annual mortality again began to decline, to perhaps 25,000 in 1991. Education, the banning of sundown sets, and performance standards for skippers have been especially important in the more recent decline, and the mortality caused by the international fleet seems to be approaching those low levels again.
Maintenance and Recovery of Dolphin Populations
It is important to emphasize that the dynamics of dolphin populations under fishery pressure are different from those of the tuna caught with them. Yellowfin tuna are short-lived—5 years is old for a tuna —and each female produces millions of eggs each year. The dolphins involved live to be as much as 35 years old and produce only 12– 15 young in a lifetime. Largely because of these differences, tuna populations can sustain a harvest of 20–40% of the reproductive population in a year (Francis, 1986), while the maximum safe harvest for dolphins is probably much less than 10%.
One way to approach the question of how much mortality dolphin populations can sustain and remain stable or increase is to express harvest as a proportion of net recruitment, i.e., as a proportion of the number of animals added to the population each year minus those that died. Recent estimates of dolphin abundances in the ETP vary; the best —although still imprecise— seems to be that of Gerrodette and Wade (in press, b) and is about 8,000,000 animals, with eastern spinners estimated at 600,000. Recruitment is also inadequately known (Reilly and Barlow, 1986; Smith, 1983), but an estimate of 2–6% per year seems reasonable (Smith, 1979, 1983). The lower estimate of 2% would represent 160,000 animals per year (12,000 eastern spinners per year). A kill rate of 40,000 animals per year would thus represent a kill rate of 25% or less of recruitment, almost certainly low enough to permit current dolphin populations to be stable and perhaps to increase. An annual kill of 20,000 (12.5% or less of recruitment) would probably result in substantial
increases in dolphin populations. Similar calculations can be applied to individual stocks and species. Thus, with a small reduction in the 1991 mortality, it is reasonably certain that dolphin populations would increase.
It is important to note that very little is known of natural mortality in dolphins or their ability to compensate for fishing mortality as many fish populations are known to do. For example, infestation of nematode parasites in dolphins has been projected to increase natural mortality (Dailey and Perrin, 1973).
Remarkably, there is no evidence of major social disruption of dolphin populations as a result of seining and some evidence indicates that they have adjusted to it (e.g., experienced dolphins are less excitable in a tuna seine and less likely to become entangled than naive animals). Also, evidence from Hawaiian spinner dolphins shows that the membership of aggregations there can be quite variable from day to day, unlike the tight family units of many land-mammal societies (those dolphins live in “fission-fusion” societies; Norris, 1991). This means that precise membership of a herd seems not to be essential to its daily (i.e., nonreproductive) operation and that disruption by seining is less harmful than it would be if a tight social unit were being affected.
The effect of seining on dolphin reproduction is not clear. Dolphins give birth to large young that can swim rapidly soon after birth. But the young need assistance, which is provided by other members of the herd while the mother recovers from the birth. These helpers seem to fill a long-term societal role; they are not randomly chosen. Thus, disruption of a herd by seining at the time of reproduction might have adverse consequences (Norris et al., in press). Dolphins reproduce all year in the ETP but with a major peak in late spring and early summer and usually a secondary peak in early fall (Perrin et al., 1984).
The committee did not analyze different fishery-management options to conserve dolphin populations, but notes that if better information is obtained on the timing and distribution of dolphin reproduction in the ETP, time and area closures might be worth consideration. In addition, the committee notes that a complete ban on dolphin fishing or the purchase of tuna caught on dolphins is not required to ensure the survival and even the increase of dolphin populations. The committee did not attempt to judge the desirablity or validity of various management policy goals, but it is clear that any policy designed to reduce dolphin mortality or prevent it absolutely will be effective only if it is based on sound information and if most or all nations that fish for dolphin-associated tuna anywhere in the world participate in its implementation.


