
2
Understanding Our Active Planet
ESSAY: THE DYNAMIC EARTH
Understanding earth processes requires broad and eclectic thinking. The earth system is complex, with open channels between interacting boundaries the norm rather than the exception. Many researchers think of the solid-Earth as an engine driven by radioactive decay, while others expand this view to include the whole earth system and consider the added processes driven by solar energy. Others see the Earth as a system of geochemical cycles with interchanges spanning ranges of time and space that extend back to the birth of the solar system. Finally, some scientists regard the planet as a series of concentric domains with ill-defined layers distinguished by the transfer of mass and energy.
The Earth is all of these and more. The accelerated understanding of the earth system that characterized the past few decades is attributable to problem-solving strategies based on integration of these various interpretations. Contributions from geochemistry support theories developed from seismological data, structural geology depends on investigations in physics, and organic chemistry offers potential explanations for problems encountered in both resource extraction and waste management. Since their adoption of this expanded tool kit for investigating the implications of plate tectonics, earth scientists have made unprecedented progress.
The Earth began over 4.5-billion-years ago with the accretion of material orbiting around the Sun, supplemented by the capture of other bodies from intersecting orbits. Early in the process of consolidation, proto-Earth collided with a Mars-sized body and the material from both reorganized into the Earth-Moon system. Soon—in a geological sense—after that event, convection cells became established within the Earth's mantle, a crust developed, free water entered the atmosphere, plates diverged, ocean basins evolved, and mountains rose through tectonic forces at work along plate boundaries. These distinctive earth phenomena are both cause and effect in a multiscaled arrangement of interacting processes.
From the perspective of geochemical cycles, there are two end-member processes, differentiation and mixing; two end-member domains, the exterior Earth environment and the interior; and two end-member time frames, hundreds of million of years and the instant. Within each end-member pair, there is a continuum of possibilities. Generally, surface domain processes occur very quickly and interior processes endure over long intervals, although there are exceptions. Some continental material has endured for billions of years near the surface, and mantle plumes may erupt at the surface with no detectable warning, after migrating from the core-mantle boundary over mere millions of years. And while differentiation and mixing of large volumes continue for eons within the mantle, incremental changes within small volumes can take place quickly both at the surface and within the interior.
The domains that extend above and beneath the surface contain the Earth's fluid envelopes. Water vapor in the atmosphere condenses and falls as rain. At the surface, water weathers the rocks physically and chemically: physically by impact and by freeze-thaw action and chemically by solution and the introduction of ions that foster reactions with rock minerals. Particles and solutions from crustal rocks wash downstream and enter the great water reservoirs of river, lake, ocean, and groundwater—settling out as detrital sediment and as precipitates.
At ocean spreading centers and in volcanic environments, water may aid in the precipitation of mineral concentrations that become valuable resources when discovered in accessible terrain. Magmas and other fluids that move through the crust have the potential of becoming significant sources of minerals and energy. Along subduction zones, hydrated crust and water-saturated ocean-bottom sediments descend into the interior beneath a mantle wedge that extends over the sinking plate. At high-temperature and pressure these rocks dehydrate, which leads to melting. Volatile-rich magmas rise and interact with crustal rocks to generate the type of gas-charged magmas that erupt at the surface with devastating violence. The volatility is most pronounced along Cordilleran arcs of continents; the volcanoes along the South and North American Cordillera erupt in explosions that may literally blow them apart, as Mount St. Helens did in 1980.
Volcanoes that build over hot-spots, such as those in the Hawaiian Islands, erupt magmas that flow rather placidly because of their chemical makeup. They contain smaller proportions of silica, and gases escape readily. By the time the magma reaches the surface it is less explosive and sticky, so it flows easily. Eruptions from hot-spots produce large volumes of basaltic lava spreading over extensive areas in layered sheets that may accumulate to great thicknesses; the Hawaiian volcanoes reach heights over 9,000 m above the deep ocean floor and nearly 4,000 m above sea level.
Hot-spots originate deep within the Earth. They are the result of plumes that reach the surface after rising through mantle and crust. The source of these plumes may be within the mantle or from the mantle-core boundary. They may originate at both depths, and researchers are not yet able to recognize evidence that could characterize distinct sources.
Researchers are also investigating the possible causes of mantle plumes. Physical anomalies along the core-mantle boundary and chemical anomalies attributable to recycled surface material are two intriguing possibilities. Whatever the cause or the source of mantle plumes, they bring to the surface basaltic lavas with chemical clues about the deep mantle material from which they were extracted.
The movement of plumes through the mantle represents chemical and physical links between the interior and exterior. The mantle itself is flowing in a complicated pattern of convection. This pattern manifests itself at the surface as spreading centers and subduction zones, where vast slabs of lithosphere can be seismically traced along descending arms of the convecting system. The convection, which governs plate dynamics, may be limited to an outer layer of the mantle, possibly complementing another convection system delivering energy and material through an inner mantle. An alternative possibility suggests cells that convect through the whole of the mantle, directly linking the bottom boundary along the core to the surface characteristics of plate tectonics.
There are two layers to the Earth's core, recognizable from the distinctive behavior of seismic waves. The outer core is fluid. Only compressional waves propagate through it, while shear waves can be detected propagating within the inner core. The core is the nucleus of the internal domain, 2,900 km below the surface. Even from that remote depth it affects the crust and the atmosphere: the core is the source of the magnetic field.
Core, mantle, crust; lithosphere, hydrosphere, atmosphere, magnetosphere—every layer, every component of the earth system can be defined independently. But to understand the meaning of those definitions, the significance of the components, and the nature of the whole earth system requires consideration that transcends the specific. Exchanges between the innermost center and the outermost reaches of the earth system are ubiquitous and continuous. Earth scientists are discovering both explanations of the past and implications for the future by adopting this grand scale—the whole earth system—in their ongoing inquiries.
This expansive perspective solves old problems and presents new ones. For example, 25 years ago plate structure was recognized as a characteristic that specifically defined the lithosphere. Lately, motion of the lithospheric plates has gained a prominent position as a factor in processes that affect both mantle heterogeneity and global climate. Seismic studies have traced hot areas associated with spreading centers deep into the mantle and recently have detected slabs of cool lithospheric material descending deep beneath subduction zones. This cooler material persists over long periods; cool-temperature anomalies found in the mantle today are remnants of the breakup of the ancient continent of Gondwanaland about 150-million-years ago.
The breakup of Gondwana also caused drastic changes in climate patterns. As Africa, India, and South America drew away from Antarctica and encountered the landmasses of the north, the equatorial currents of the Tethys Sea were interrupted and deflected. After India collided with Asia 45-million-years ago, cold deep water began to accumulate off
Antarctica. Circulation around that continent became firmly established when the Drake Passage between South America and Antarctica was finally breached about 30-million-years ago, and glaciation advanced over eastern Antarctica. After Arabia collided with Asia 15-million-years ago, circulation of the warm saline waters southward out of the Indian Ocean ceased and the West Antarctic ice sheet grew. Finally, following the emergence of the Isthmus of Panama and complete interruption of extensive east-west equatorial ocean circulation, Arctic glaciation began and eventually grew to cover vast areas of North America and Eurasia. This modern glacial mode persists, despite the relatively small glaciated areas of the current interglacial period.
Climate changes result from ocean circulation changes. Ocean circulation in turn follows paths established by variations in plate distribution, according to the vagaries of plate tectonics. Evidence of plate tectonics is restricted to Earth, despite rigorous surveys of similar planets and planet-like bodies. The mantle convection that results in plate tectonics originated soon after establishment of the Earth-Moon system 4.5-billion-years ago. Whatever the source of this remarkable process that renews much of the Earth's surface every few hundred-million-years, the result is a surface environment supporting the only known life in the universe. Understanding this dominant earth process is essential for maintaining the surface environment.
ORIGIN OF THE EARTH
Any theory of the Earth should consider its origin, and any well-rounded program in the earth sciences should consider it a component of the solar system. This consideration addresses scientific issues such as the formation of the solar system, the processes causing evolution of the planets, and the relationship of these processes to its structure and history. Knowledge about the origin of the solar system comes from studies of astronomical data on forming stars and planetary properties as well as from meteorites.
We can expect advances in the application of chemical physics to the interpretation of change in cosmic material in its journey from the stars and the interstellar medium to its eventual resting place in the Earth, the planets, and other solar system bodies. This will require a multidisciplinary approach. Laboratory work using innovative experimentation and analytical techniques, observational astronomy, and theoretical efforts is involved. Geochemical and cosmochemical studies of meteorites, comets, or their analogs can become more intimately related to the origin of the Earth. The Earth formed some 4.5-billion-years ago. Its age is known from differences in its radiogenic lead isotope ratios from those of the Moon and meteorites.
Technical advances allow detailed computer simulations of early solar system evolution. The simulations apply the physical laws that control orbits, collision frequency, and accumulation mechanics as small objects grow to the size of planets. One conclusion of this work is that planet growth through the accumulation of small objects occurs relatively rapidly. To go from a multitude of dust grains in a solar nebula collapsing under its own gravitational attraction to a limited number of planets circling a central star requires only a few tens of millions of years. The most recently obtained isotopic dates from meteorites suggest that this process happened about 4.55-billion-years ago in our solar system.
The simulations also indicate that as the size of colliding bodies grows, more kinetic energy from the incoming body is deposited deep in the planet. For a planet like the Earth, which grows to full size in only tens of millions of years, this heat cannot be transferred to its surface, and then into space, fast enough to keep the interior from reaching very high-temperatures.
Recently, attention has focused on the hypothesis that a collision between the proto-Earth and an
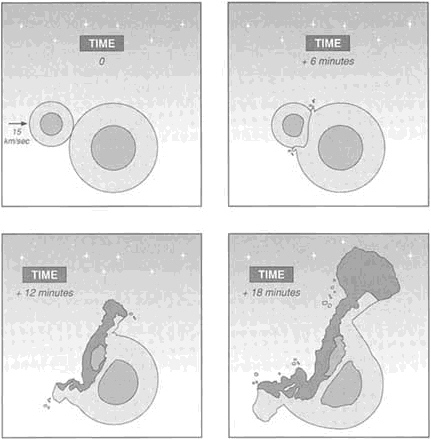
FIGURE 2.1 Model of the origin of the Earth's Moon by impact of a Mars-sized object on Earth.
object roughly the size of Mars, approximately one-tenth the mass of the Earth, may have been responsible for the formation of the Earth's moon (Figure 2.1). This impact would have been sufficiently energetic—comparable to a trillion 1-megaton atomic explosions—to propel material into Earth orbit, forming the Moon. The giant-impact origin for the Moon seems capable of explaining both the large relative size of the Moon and the geochemical similarities between it and the Earth that have been deduced from analyses of lunar samples returned by the Apollo missions.
Experiments on and calculations of the effects of impacts during accretion should lead to better understanding of the early history of the Earth, the role of a magma ocean in differentiation, and the history of outgassing and its relationship to the formation of the atmosphere and oceans.
Comparative Planetology
Many processes of the solid-Earth must also occur on other planets but may frequently have rather different consequences. The proposal that the extinction of dinosaurs and many other species near the Cretaceous-Tertiary boundary was caused by the catastrophic impact of a 10-km asteroid or comet has sparked heated debate among geologists. But cosmochemists and solar system dynamicists argue that such events are probable, and researchers studying impact craters on the Moon, Mars, and Mercury say it is consistent with their data.
Study of lunar samples has led to new insights into the evolution of Earth. The earliest history of the Earth has been destroyed by plate tectonic processes. Early Earth history must be deduced from analyses of lunar and meteorite material and from exploration of other planets.
Detailed chemical analyses of lunar samples suggest that a largely molten Moon crystallized to form a thick crust composed of the low-density aluminum-rich mineral-plagioclase-overlying a dense magnesium and iron-rich interior. The lunar crust appears to have been formed by gravitational sorting according to the relative density of the minerals crystallizing from an original magma ocean. Age determinations show that much of the chemical differentiation of the Moon was complete by 4.35-billion-years ago, or within 200-million-years of lunar formation.
Debate continues about many issues concerning the evolution of the Earth. These issues include the degree of outgassing, the cooling of the planet, the heterogeneity of the mantle, the conditions necessary for plate tectonics, continental growth and crustal recycling, the creation and persistence of stable continental cratons, and the generation of the magnetic field. In the face of this array of questions, it would help greatly to have at least one other planet to use for comparison.
The planet Venus differs less than 20 percent from the Earth in mass; in mean density; and, as far as can be detected, in content of chemically active volatiles. Yet in secondary properties related to its interior, it is very different from the Earth. Radar imagery from the recent Magellan probe reveals a planet surface scarred by volcanic activity and bombardment from space, as well as deformation, but plate motions are not evident and the mountain-building processes contrast greatly with those of the Earth. Faults can be traced, and broad elliptical areas spanning hundreds of kilometers may represent mantle plumes rising beneath the Venerian lithosphere. With no apparent plate tectonics, heat may have to escape from deep within Venus in other ways. The comparative study has just begun, and it should be greatly enhanced by continuing analyses of data from the Magellan project.
Early Earth Evolution and Great Impacts
Obviously, any extraterrestrial impact capable of creating the Moon would have major consequences for the early evolution of the Earth. Computer simulations of giant impacts indicate that the energy released is sufficient to raise the temperature of the whole Earth by 3000 to 10000°C—more than enough to cause total melting of the planet.
Recent advances in high-pressure instrumentation have made possible studies of phase equilibria and element partitioning at pressures as high as 500 Gigapascals—5 million times atmospheric pressure—and temperatures up to 6000°C. These new limits allow experimental analyses over pressure and temperature ranges covering the entire interior of the Earth. In the next decade, integration of high-pressure experimental studies of earth materials and enhanced theoretical understanding of the dynamic behavior of the planet should provide dramatic advances in understanding these earliest stages of the Earth's evolution.
A hot early Earth accommodates speculations about formation of the Earth's large iron-metal core. Compared to the silicate minerals that make up the major portion of Earth, iron metal has a relatively low melting point. During the growth of the early Earth, the molten iron coalesced into masses of increasing size that eventually began to sink toward the center because of their high densities. The excess heat energy stored in the core is released slowly as the molten core crystallizes. At the present time, only about 5 percent of the core has crystallized, which indicates that continued crystallization of the liquid outer core may be a significant source of heat within the Earth. In addition, the heat released as the outer core crystallizes, and the transfer of that heat into the overlying mantle may provide the driving force for the convection in the outer core that is responsible for producing the magnetic field.
During their early histories, the Earth and Moon were subject to a high flux of relatively large impactors. Because the Earth is an active planet, no record of this flux is recorded, but evidence from the Moon suggests that the flux had died away by about the time of preservation of the oldest rocks exposed on Earth. The discovery of high iridium contents in some rocks a few hundred-million-years younger than the 3.8-billion-year age usually considered to mark a sharp drop in impactor flux indicates that this question may need reexamination.
Since that time in the earliest recorded history of the Earth, the flux of impactors has been slow, although the record of impacts is too poor to show whether it has been anything other than steady. Roughly 100 craters more than 1 km in diameter have been identified on the continents. The precise count depends on which criteria are regarded as strong evidence of impact. Some impacts are as old as 2-billion-years, and the largest craters are 100 km or more across, perhaps indicating the impact of a 10-km-diameter object. Both asteroids and comets are likely to have been involved.
The distribution, characteristics, and possible consequences of impact in the more recent geological record are all active topics of research. The innovative suggestion about a decade ago that the great biological extinction 66-million-years ago, which included extermination of the dinosaurs, resulted from impact has proved very stimulating. Evidence of impact at that time in the form of widespread high iridium concentrations, shocked quartz, and wildfire is persuasive. The giant crater at Chixulub in Yucatan is a strong candidate for the main impact. The possibility that other large craters, such as that at Manson in Iowa, are associated
with the same event may require a cometary rather than an asteroidal encounter.
Current astronomical estimates of the flux of impactors make it clear that the number of impacts recognized on most continents is improbably low. This is also true of the number of impacts recognized within the continental stratigraphic record. Thus, much remains to be done in locating and studying ancient impact craters.
STRUCTURE AND DYNAMICS OF THE SOLID EARTH
One of the most significant advances in understanding the solid-Earth took place within the past 30 years with the general acceptance that the solid interior is in motion and that movement of the surface plates is an expression of that motion. Everyday experience suggests that rocks are solid, but geological investigations reveal that earth materials behave very differently on long time scales and on human time scales. On a geological time scale, the solid mantle behaves like a fluid and convects. It is convection, not conduction, that is the main means of heat transfer within the Earth. This is the process by which heat is most effectively transported from the deep interiors of planets.
With this realization, it was no longer possible to view earthquakes, volcanic activity, mountain belts, sedimentary basins, or the general division between oceans and continents as isolated surficial phenomena. Temperature variations within the Earth control the convection that ultimately produces the magnetic field, surface topography, and active geology. Interactions between the rigid surface plates cause earthquakes and the majority of volcanic activity and provide the stresses leading to mountain building and basin formation. The plates are driven by the slow convective processes of the mantle. There is little question that subducted oceanic crustal plates penetrate at least a third of the way through the mantle to depths of 670 km. Some lines of evidence suggest that these plates may travel all the way through the mantle to form a layer around the core. Heat flowing out of the core may disturb the thermal boundary layer separating it from the convecting mantle to produce narrow plumes of uprising solid material that produce surface volcanism in settings like Hawaii and Iceland.
The exact style of convection is a subject of active research. Advances in understanding this process are being made through three-dimensional seismic imagery, increasingly sophisticated computer models, and laboratory simulations. Several avenues of research promise major breakthroughs in understanding the thermal state and evolution of the interior. It is now clear that the surface characteristics of the Earth originate in, and are being continually modified by, a complex interplay between the mobile surface plates and the dynamic interior of the planet.
Seismic Determinations of Earth Structure
The structure of the interior has been examined in detail for over 50 years, through the application of seismology—the study of natural and artificially generated vibrations traveling through earth material. The emphasis has been on determining the variations in physical properties, especially velocity, refraction, and reflection behavior, as a function of depth. These variations reveal major changes in composition with depth. For example, the core, an iron-rich alloy, is more than four times denser than the crust, which is made mainly of aluminosilicates. Because of advances in seismic instrumentation and analysis, the interior can be viewed in three dimensions from the surface to the center. Thus, the processes underlying near-surface geological phenomena can be mapped and understood.
A primary feature of present-day models of the interior (Figure 2.2) is the asthenosphere, a region of low seismic shear wave velocity in the upper few hundred kilometers of the mantle, where materials approach their melting point and where mantle flow may be concentrated. At a 400-km depth the first of the deep mantle discontinuities in seismic wave velocity occurs, followed by an even larger discontinuity at the 670-km depth. Current debate centers on the nature of these discontinuities.
One view is that they represent phase changes in a mantle of constant composition. In this scenario the increasing pressure causes silicate minerals to convert to more dense crystal structures (Figure 2.3) with depth. Other evidence suggests that these seismic discontinuities mark more than phase transitions and may be regions where the chemical composition of the mantle changes. If only the phase and not the composition changes, the discontinuities would not necessarily be barriers to convection. If, however, the discontinuities reflect compositionally induced density differences of sufficient magnitude, they would inhibit flow across them. In this case convection would be confined to a series of layers within the Earth. These two distinct types of convection have drastically different implications for the compositional and thermal evolution of the interior.
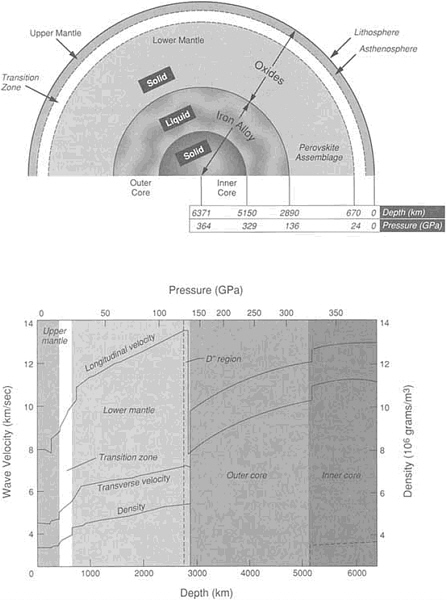
FIGURE 2.2 Cross sections of the Earth and its properties. The upper panel shows the seismologically determined regions and pressures as a function of depth (100 GPa = 1 Mbar = 1 million atmospheres). The bottom panel shows the average elastic parameters as a function of depth as determined by seismological analyses.
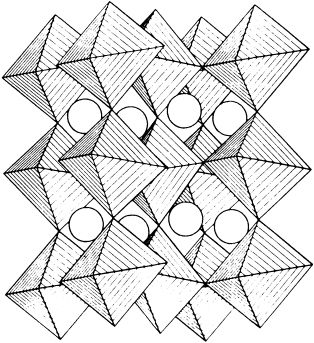
FIGURE 2.3 The bulk of the material making up the lower mantle is believed to have the perovskite structure.
At present, most physical property measurements have been carried out at room temperature and pressure. Extrapolation of these measurements to appropriate pressures and temperatures for seismic discontinuities carries sufficient uncertainties to allow either explanation for their origin. Only recently, with the development of several new approaches for high-pressure and high-temperature experimental apparatus, has it become possible to provide precise measurements of parameters such as density, compressional and shear wave velocities, and seismic wave attenuation. A new effort in mineral physics at high-pressure and temperature, coordinated with interpretation of high-resolution seismic images of the mantle from advanced seismic instrumentation programs, such as those administered by the Incorporated Research Institutions for Seismology (IRIS), is enabling earth scientists to better understand the structure of the mantle.
Seismologists have used a wide variety of techniques to create three-dimensional images of the Earth's interior structure. One method is tomography, based on the same principle that is exploited in medical x-ray and ultrasonic imaging devices. It concentrates on small variations in the observed arrival times of seismic waves following earthquakes. A limitation of this technique is that it requires extremely dense arrays of seismic recording stations to provide high-resolution images.
This limitation has led to the development of sophisticated methods that utilize more of the complicated signals arriving at seismic stations during and after earthquakes. Large earthquakes excite free oscillations that are sensitive to the largest scales of heterogeneity and give direct constraints on lateral variations in density. Surface wave arrivals give good lateral resolution of upper-mantle structure but need to be augmented with other data to give good depth resolution. Body wave arrivals provide the best resolution in depth and can be used to map the topography of internal discontinuities.
Present-day images of the interior are of low resolution and uncertain accuracy. They reveal distinctive heterogeneities over horizontal distances extending thousands of kilometers. The heterogeneity is strongest near the top and bottom of the mantle, decreasing from 2 to 10 percent in the upper mantle to about 1 percent throughout the bulk of the lower mantle. The lowermost 100 to 300 km of the mantle, called the D'' (D double prime) layer, is also significantly variable, by 5 percent or more.
Thus, the strongest lateral variations in physical properties are associated with the major boundaries of the Earth: the surface and the interface between the mantle and the core. This result supports the assumption that the top and bottom of the mantle are two regions in which material moves horizontally, with little vertical motion. From a dynamic perspective, the seismically produced images suggest direct associations between these heterogeneities and the mantle's convective flow. The instability of these boundary layers ultimately produces crustal deformation through the forces of subduction and plumes. Thus, seismic tomography in principle can map out the underlying motions that drive plate tectonics at the surface.
One dramatic example of this type of mapping inside the Earth is the detection of cold slabs of lithosphere, the crust and uppermost mantle, sinking into the mantle beneath subduction zones. Because the slabs are cold, they appear as regions with anomalously fast seismic velocities relative to the velocities in the hot surrounding mantle. The presence of slabs in the mantle has been used to explain the existence of deep-focus earthquakes along the postulated extensions of near-surface subduction zones. Now actual images defining the dimensions of thermal anomalies—cold slabs—are being produced by tomography. Therefore, it is possible to detect subduction at depth, even in places where a slab may be seismically quiet. The present location of cold slabs at depth is an indication of past subduction because rock changes temperature very
slowly. For the first time, observers can determine how far the slabs penetrate into the mantle, providing first-order information on the deeper aspects of the convection patterns associated with plate tectonics.
In addition, the shape of the slab is a direct reflection of the tectonic forces associated with convection. Observations of significant distortion of slabs in certain regions give evidence for variations in rock properties with depth and for background flows in the mantle convection pattern. This conclusion is supported by evidence of changes in the distribution and focal mechanisms of earthquakes with depth. All indications are that tectonic forces do vary along subduction zones, but the patterns are still indistinct.
Mantle Convection
Although many aspects of mantle convection are reasonably well understood, major scientific questions remain unresolved. These include the vertical structure and multiple scales of mantle convection and the efficiency of mantle mixing.
Plate tectonics is the surface manifestation of mantle convection. The rigid plates are the uppermost thermal boundary layers of mantle convection. These cool layers are rigid on geological time scales and behave as plates. But the plates become denser because of thermal contraction. Eventually, they become gravitationally unstable and founder into the mantle at subduction zones, defined by the ocean trenches. The weight of descending plates is a major force driving plate tectonics.
There is direct seismic evidence that the slabs of material subducted into the mantle at ocean trenches descend to depths of 670 km. An unresolved question is whether the downward limbs can penetrate this depth. The evidence is contradictory, and the views of experts are divided. If thermal convection penetrates this density barrier, whole-mantle convection occurs. If convection does not penetrate, then separate convection cells develop in the upper and lower mantle and mantle convection is layered. If mantle layers do not mix, significant variations in chemical composition and temperature could characterize the interior. There is also the possibility that both styles of convection can coexist. The amount of material transported across the entire mantle is currently the single largest uncertainty in understanding the Earth's thermal and chemical evolution.
Just as the plates are thermal boundary layers at the top of the convecting mantle, there should be boundary layers at the base of the convecting system. For layered mantle convection this boundary layer would be the result of heat transfer from the lower mantle; for whole mantle convection, it would be the result of heat transfer from the core. The gravitational instabilities in these lower boundary layers may generate ascending mantle plumes that are responsible for intraplate volcanism, such as that in Hawaii.
The fate of plates that founder into the mantle at ocean trenches has also been a subject of controversy. These plates are layered. The basaltic ocean crust extends to a mean thickness of about 6 km. Beneath that crust is a zone that has been depleted of basalt and is primarily composed of the refractory mineral olivine. This layer, which has a thickness of approximately 50 to 100 km, is gravitationally buoyant. Simple mass balance calculations show that ocean crust must be recycled through the mantle on a time scale of about 1.7-billion-years or less. Therefore, present-day basaltic ocean crust has been processed through the plate tectonic cycle several times.
One hypothesis for the fate of the subducted ocean crust is that convection stirs it into the bulk of the mantle until it is nearly homogenous. Another hypothesis suggests that significant density differences between the basaltic ocean crust, which transforms to a dense phase called eclogite at depth, and the olivine-rich mantle result in gravitational segregation, with the depleted mantle rock overlying the crustal rock. The essential question that must be answered is whether convective mixing can homogenize the mantle before the buoyancy differences can cause layering.
The effect of an increase in temperature is to decrease the density of rock by a fractional amount—a few percent per 1000°C. Density variations caused by lateral temperature variations drive mantle convection. By the same token, the convective flows induce temperature differences. The flow field and temperature field are coupled.
Assuming that lateral variations of seismic velocities in the deep mantle can be ascribed to temperature variations, laboratory measurements of the changes in acoustic velocity with temperature can be used to infer the density variations in the mantle. In this way the buoyancy forces associated with mantle convection are obtained directly from seismic tomography.
Variations of the external gravity field can be calculated from the inferred density variations, taking into account not only the density distribution within the convecting mantle but dynamic topog-
raphy as well. Dynamic topography is the deformation of the surface and internal boundaries, such as that between the mantle and core, that occurs because of convective flow in the interior.
By comparing the calculations with the observed variations in gravity determined from the analysis of satellite orbits, it has been found that the large-scale features of the Earth's external gravity are reproduced closely by the convection patterns deduced from seismic tomography. On a scale of 1,000 km, therefore, the seismic heterogeneity appears to be caused largely by temperature variations driving flow in the mantle. This analysis suggests that the large-scale pattern of convection and the associated buoyancy forces are being accurately imaged by seismic tomography.
Flow in the mantle is dominated by viscous forces, so inertially dominated turbulence is absent. The convective flow is amenable to both numerical and experimental modeling. Numerical models of mantle convection have improved with advances in the speed of computers and in computational techniques and with better understanding of the processes governing creeping flow in the Earth. Two-dimensional calculations now include temperature and pressure dependence as well as chemical and phase boundaries with realistic values for mantle parameters. Three-dimensional cartesian and spherical calculations with constant-property material have recently been completed. In the atmospheric sciences, general circulation models (GCMs) have become credible enough to be used for routine simulations by researchers in atmospheric chemistry and climatology—subjects far removed from solid-earth fluid dynamics. But within the next decade, mantle convection models should reach this level of acceptance, and applications should become widespread.
Core Dynamics and Geomagnetism
The outstanding geophysical problem involving the Earth's core is the generation of a magnetic field. The magnetic field is a product of dynamo action in the electrically conducting fluid outer core. A majority of planets in the solar system and an overwhelming majority of stars possess magnetism, and all of these magnetic fields are a consequence of dynamo action.
Despite this universality, our understanding of the Earth's dynamo remains rudimentary. Several key theoretical issues remain unexplained, including the physics of magnetic field equilibration and proper characterization of the energy sources in terms of fluid motions. Core convection may be driven by thermal buoyancy produced by heat loss to the mantle or by crystallization of the inner core. Core fluid dynamics is characterized by a wide spectrum of frequencies and spatial length scales. Filtering by the mantle allows only the lowest-frequency variations in the magnetic field to reach the surface. Thus, even the most informed theories are based on a heavily filtered, and therefore distorted, image of core processes.
At the present time it is not possible to develop consistent models of the geomagnetic dynamo. The relatively simple flows that are computed in numerical convection models generally do not work as dynamos. The successful theoretical dynamos strongly suggest that large-scale magnetic fields are produced by a broadband spectrum of fluid velocities that are chaotic and turbulent. In short, the difficulty is that simple flows do not produce simple dynamos—they produce no dynamo. Complex flows are required to produce dynamos; therefore, models of the dynamo process are necessarily complex.
The flow in the core required to produce the dynamo must be complex. An analogy with the winds in the atmosphere that determine weather patterns may help in comprehending core flow complexity. Scaling analyses show that 1 year of flow in the core corresponds to about 1 hour in the atmosphere; researchers are just now able to see the equivalent of 1 week's worth of weather in the core. To understand the magnetic field on a geological time scale requires the equivalent of understanding long-term climatic patterns in the flow of the outer core.
One outstanding question is why the magnetic field varies with time. A suitable solution must explain the reversals in polarity that have occurred frequently—at roughly 1-million-year intervals—throughout geological history. These variations have proved useful for applications in geology and geophysics, most notably in paleomagnetic documentation of tectonic motions of the crust. Mapping magnetic orientations of rocks has illustrated continental growth by the assembly of preexisting blocks.
Among the most exciting results of the past few years are the first reliable observations of changes in the magnetic field during a polarity reversal. Both the pattern and the strength of the field appear to change rapidly over 10,000 years, the duration of a single reversal. In fact, observations of the same reversal, as recorded in rocks from widely separated locations around the globe, are just becoming avail-
able. The data tentatively suggest a much more complex magnetic field configuration during a reversal than had been expected.
Studies now in progress concentrate on the nature of the field at the beginning and end of a transition, the idea being to document exactly how reversals are triggered. Such data may become important in light of a recent theoretical breakthrough in understanding the origin of reversals. This breakthrough postulates that polarity reversals result from the interaction between two separate time-varying components of the magnetic field. Detailed configurations of the entire field are now known for the past several hundred years, based on historical records. This configuration is extremely important because it reveals the flow pattern in the fluid outer core, where the geomagnetic field is created by magnetic and hydrodynamic processes.
Geomagnetism offers one of the only tools for exploring the nature of the deep interior far into the geological past. Effective documentation of long-range trends in field intensity and in reversal frequency could provide important constraints on the geological evolution of the core and core-mantle system. It should be emphasized that these advances depend on developments in the study of mineral and rock magnetism. Only with a thorough understanding of how magnetic remanence is acquired, and how it can subsequently be altered, can reliable determinations of the paleomagnetic field be made.
Core-Mantle Boundary
The boundary (see Figure 1.12) between the Earth's mantle and core is the most significant interface within the planet in terms of the contrast in materials and properties. The changes in density and seismic wave velocities across this boundary are larger by far than those across the boundary between the mantle and crust. The heterogeneity of the lowermost mantle rivals the geological heterogeneity observed in the crust. The time scales on which the heterogeneities in the core-mantle boundary layer are disrupted and at least partially mixed back into the overlying mantle are a matter of great interest.
The development of a new broadband digital network of seismometers and increased computational capabilities to interpret such seismic data markedly improves prospects for deciphering the current nature of the core-mantle boundary. High-resolution, three-dimensional images of this region, combined with the results of geodynamic modeling and ultra-high-pressure laboratory simulations, should provide revelations about the dominant structures and processes of this dynamic region. Researchers anticipate that geomagnetic anomalies may be associated with seismological heterogeneities found at the base of the mantle. If so, this would open up the exciting possibility of documenting changes in the core-mantle boundary structure through the geological past. Documenting such changes, through paleomagnetism or other approaches, is important because thermal, mechanical, and electromagnetic coupling across this boundary cause the geological evolution of both the core and the mantle and, ultimately, of the crust.
EARTHQUAKES: CONSEQUENCES OF A DYNAMIC MANTLE
Earthquakes are recurrent demonstrations that the Earth is indeed an active planet. Earthquakes occur over a large range of areas and vary by more than 20 orders of magnitude in energy release. Close study of their geographic distributions, their depths and associated geological settings, and their various magnitudes has provided some of the most basic clues to plate tectonic theory and subsequent insight about the dynamics of the solid-earth. Earthquakes are among the most destructive of natural hazards, and as such their nature and predictability are considered at length in Chapter 5 on hazards.
Geographic Distribution
As the surface jigsaw puzzle of major plates shifts in association with convective motions of the interior, the relative plate motions are accommodated by episodic slips along major faults, discontinuities in the Earth's crust. A familiar example is the San Andreas Fault in California (Figure 2.4), which separates the Pacific and North American plates. The two plates are moving horizontally relative to one another at a rate of about 5 cm/year. The motions in the deep Earth proceed as slow and continuous flow because the rocks there are hot. Near the surface, however, the rocks are cold and brittle, and here the faults respond to the plate motions in one of two possible ways. The less violent is a continuous creep, without earthquakes. The other response is the building of elastic strain that is released abruptly by frictional sliding of the rock along the fault—an earthquake.
The San Andreas Fault is called a strike-slip fault because here the plates are sliding past each other horizontally. Along other major plate boundaries the crust is either spreading apart, as in ocean ridges
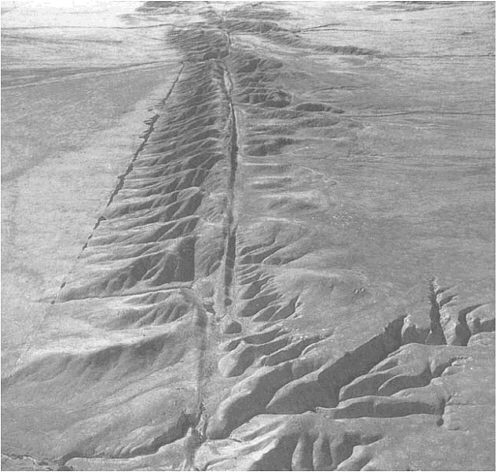
FIGURE 2.4 The San Andreas Fault on east edge of the Carrizo Plain. Rugged, dissected terrain west (right) of the fault trace is the Elkhorn scarp. Photograph courtesy of R.E. Wallace, U.S. Geological Survey.
or continental rifts, or is converging, as in subduction zones and continental collisions. At these boundaries the faults range in angle from horizontal to vertical. Understanding the diverse types of fault motion in each of these three environments—strike-slip, spreading, or converging—was critical to reconciling the global distribution of earthquakes to large-scale plate tectonic processes.
North of the San Andreas Fault, in the Pacific Northwest, the major plate boundary is convergent, and the ocean crust plunges under the continent. Associated with this subduction zone is a linear chain of active volcanoes extending from British Columbia to Mount Lassen in northern California. The largest earthquakes that have occurred around the world in this century have been located in subduction zones, including the 1964 Alaskan event that devastated Anchorage. Events of comparable size may well occur in the Pacific Northwest.
Seismologists routinely determine the kinds of faulting associated with all large earthquakes almost as they happen. This composite information gives a picture of the ongoing tectonic motions, which is critical to understanding the dynamic Earth system. Earthquakes occur as deep as 670 km in regions where cold ocean plates sink into the mantle. Study of the faulting involved in deep earthquakes sheds light on the process of subduction and on the fundamental nature of mantle convection.
Understanding Earthquakes
While seismologists have made progress in characterizing the global distribution of earthquake activity and the types of faulting involved, a basic understanding of the physics of earthquake rupture is still lacking. Without this it is difficult to assess seismic hazard, and for this reason little progress has been made on the short-term prediction of earthquake occurrence. A concerted interdisciplinary effort is under way in an attempt to achieve a better fundamental understanding of the fault mechanisms that produce earthquakes. Established ideas are being reexamined, and new questions such as "Why do earthquake fault surfaces appear to have so little friction?" are being posed.
Although characterizing the physical behavior of an earthquake fault remains a challenge, local studies of earthquake distributions in space and time have permitted improved estimates of the probability of earthquake occurrence in specific regions. As a result, administrators have been able to develop response plans to reduce the disastrous effects of earthquakes. Operational prediction of earthquakes is at present a distant goal, but it could eventually become one of the primary means of earthquake hazard mitigation.
Seismological approaches to understanding earthquake rupture processes are expanding dramatically. Creating high-resolution images of active faults is one approach. This is accomplished by determination of fault orientations for earthquakes of all sizes. It is now recognized that faults are remarkably complex, with many undulations and intersecting branches. One of the most important advances in the past decade has been the expansion of the record of large earthquakes beyond the limited historical record to tens of thousands of years of prehistoric time, through the new subdiscipline of "paleoseismology." By geological means, including the evaluation of stratigraphic records in excavations made across suspected active faults, and by quantitative geomorphic analysis of the ages of fault scarps, many previously unknown large earthquakes have been identified around the world, and knowledge of the global patterns and timing of large earthquakes has been greatly enhanced. Another of the dramatic advances in the past decade involves the ability to map a rupture in space and time as it expands during an earthquake. This information provides insight into the physical processes, such as stress accumulation, that govern initiation and termination of earthquake rupture. The degree of ground shaking produced by a given earthquake is influenced by the detailed nature of the rupture process. The field of strong ground motion seismology involves quantification of the shaking induced by an earthquake as rupture spreads over the fault. Predicting strong ground motion also requires an understanding of the interaction of seismic radiation with complex crustal structure, and a major effort is under way to develop the necessary three-dimensional wave propagation capabilities.
Laboratory studies of rock physics and rock mechanics help in understanding the nature of earthquakes. Rocks are three-dimensional aggregates of mineral grains containing a complex assemblage of defects such as dislocations, grain boundaries, and fractures, which often contain impurities or fluids. Researchers in rock physics strive to understand how the properties, proportions, and arrangements of the component phases interact to determine the overall properties of the rock bodies.
Theoretical modeling and laboratory measurements of friction have been used in studies of earthquake instabilities, orientation, and distribution of faults and rupture mechanisms. The effect of fluid pressure in promoting brittle fracture and frictional sliding of faults is being addressed by a variety of experiments. An essential question in understanding the behavior of strike-slip faults like the San Andreas involves the absolute stress levels on the fault. The absence of a high heat flow anomaly, along with low average seismic stress drops, suggests that the mean stress level is low. But laboratory friction studies indicate that high stresses are needed to cause the fault to slide. High fluid pressures on the fault may reconcile these observations, or perhaps a better understanding of stress levels during rupture will be needed.
Earth Deformation
Many technologies are developing for measuring regional strain on both local and global scales. Two color laser-ranging techniques, small trilateration nets, level lines, and stretched-wire creepmeters are
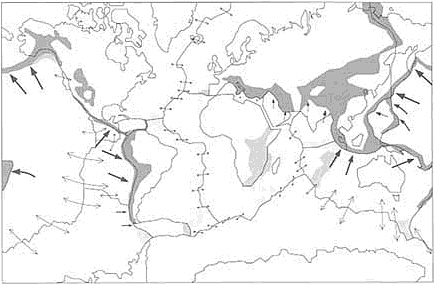
FIGURE 2.5 Map showing idealized plate boundaries, velocities between plates, and regions of deforming lithosphere. Plate velocities are shown by arrows; the length of the arrows shows what the displacement would be if the plates were to maintain their present relative angular velocity for 25-million-years. Plate separation rates are shown by symmetrical diverging arrows; plate convergence rates are shown by asymmetrical bold arrows. Stippled areas are those areas of deformation.
used to measure localized deformation along faults. For example, the pattern of tectonic strain throughout California and the western United States has been delineated by laser-ranging surveys during the past 20 years. Tiltmeters, linear strain meters, and volumetric strain meters are among instruments currently used for studying tectonic strains on both the continents and seafloor. Recently developed techniques using very-long-baseline radio interferometry (VLBI), satellite laser ranging (SLR), and the global positioning system (GPS) provide the capability to measure larger-scale motions. In fact, these measurements have directly confirmed the theory of plate tectonics, by resolving relative plate motions, and these measurements offer the potential of detecting departures from the motions predicted by rigid plate models (Figure 2.5).
As geodetic measurement precision and global coverage increase, it will become possible to directly monitor surface deformation, which is an important component of the dynamic Earth system. For example, in many subduction zones the cumulative slip that can be accounted for seismically is a small fraction of the convergence indicated by plate tectonic rates. Quantifying the nonseismic component, and determining whether it proceeds episodically or continually, will contribute to our understanding of earthquake occurrence and the nature of the large-scale dynamic system. Already, new seismological techniques are being developed to search for silent earthquakes, which involve nonsteady creep events that do not excite seismic waves. With this development, the spectrum of Earth motion measurements from seismology and geodesy will become continuous.
VOLCANIC ACTIVITY: CONSEQUENCE OF CONVECTING MANTLE
Volcanism is another expression of the interaction between the dynamic interior and the surface of the planet. About 1,000 potentially active volcanoes dot the Earth's surface. For the past several years, an average of 50 eruptions per year have occurred at some 85 volcanoes. This activity not only reflects the continuing activity of the inner Earth, it also furnishes an intimate physical and chemical probe into Earth's magmatic life cycle. Molten rock—magma—migrates to the surface because it is hot, fluid-like, and of low density. The magmas record the temperature at depth, the chemical composition of deep-seated source rocks, the physical and chemical nature of the magmatic plumbing system, and the dynamic conditions that result in volcanoes.
Recently, manned and remotely controlled submersibles and new high-resolution sonar images of the seafloor have enhanced our understanding of the most active volcanic system on Earth, the ocean ridges. Also, satellite and aircraft remote sensors can monitor eruptions and track volcanic gases and aerosols around the globe. Synoptic satellite-borne instruments provide the means of obtaining regional views of the distribution of volcanoes and volcanic activity and for making quantitative measurements of thermal and volatile emissions from volcanoes.
Unraveling the mystery of the causes and consequences of volcanism depends on understanding the details of the physics and chemistry of the origin and evolution of magma. Research on volcanism is discovering more about the physics of magma pro-
duction, accumulation, and eruption. This research asks seemingly simple questions: How and why does rock melt? How does melt escape from partially molten rock? How does magma rise? How long does it take? Is there a chamber of magma a short distance below every volcano? Do the magmas in these chambers flow turbulently or are they stagnant? Will the eruption be a catastrophic explosion or a quiescent extrusion? What is the cause of huge ash flows from some volcanoes?
Volcanism at the surface is caused by flow in the interior as it tries to rid itself of the heat of Earth formation and the heat generated by radioactive decay. The patterns of flow in the mantle, however, may be controlled or determined by events outside the mantle, such as enhanced heat flow from the core or changes in the motion of the rigid surface plates. The realization that the core, mantle, and crust interact to determine the surface characteristics is an outgrowth of the plate tectonics paradigm.
Geographic Distribution, Style, and Scale of Eruptions
Volcanoes are not randomly distributed about the Earth's surface. Like earthquakes, volcanic activity is concentrated primarily along the edges of tectonic plates. Along the ocean ridges, the most active volcanic setting on Earth, mantle material rises slowly to fill the gap created by plate separation. As the mantle material ascends to the surface, it melts. When it reaches the surface it creates the ocean crust—a thin veneer of layered lava flows about 6 km thick, which separates the oceans from the mantle. On a worldwide basis, volcanism at ocean ridges produces approximately 20 km3/year of lava.
Another concentration of volcanism is found above places where the plates are being returned to the interior at subduction zones. The arcuate shape of these tectonic features is well displayed by the ring of fire around the Pacific Ocean margin. This ring traces patterns of volcanic activity along all of western South America, the Cascades, Alaska, the Aleutians, Kuriles-Kamchatka, and Japan, as well as extending into New Zealand, Fiji-Tonga, and the New Hebrides in the southwest Pacific. The volume of lavas erupted at arcs is less than at ocean ridges, with estimates of total arc magmatism, including intrusive magmas, of about 2 km3/ year. The composition of the rock produced in arc volcanism is distinct from that of the ocean ridges. It is somewhat closer to the estimated average composition of the continental crust. This chemical similarity, coupled with the survivability of thick buoyant arc crust, has led to the suggestion that the continents are constructed from a patchwork quilt of assembled arc fragments.
A large fraction of volcanism is concentrated near plate boundaries. However, there are examples of volcanic activity well removed from the boundaries of the surface plates. Hawaii, in the middle of the Pacific plate, is one example of intraplate volcanism. The origin of this type of volcanism was poorly understood until the late 1960s, when it was proposed that major isolated centers of intraplate volcanism, such as Hawaii, originate over narrow ascending plumes of deep mantle material. This plume, or hot-spot, model successfully explains many features of intraplate volcanism, from their age progression to their geochemistry.
Most continental volcanic activity can be related to either plume, rift, or convergent margin processes. Melts generated in the mantle pass through the continental crust, sometimes exchanging material with continental wall rocks to cause changes in the ultimate composition of the erupted product. Continental rift valleys produce unusual lavas with high alkali content, although basalts and rhyolites also occur in the same tectonic environments. These lavas are formed by partial melting of the mantle beneath the continents, with the involvement of high concentrations of volatile components, water and carbon dioxide. A melt of related composition is kimberlite, which is noteworthy because its explosive eruption brings diamonds into the crust from depths greater than 150 km, as well as fragments of the mantle through which it came. Study of these mantle fragments confirms that the upper mantle has been modified chemically by the passage of fluids in the form of melts or dense vapors.
Flow and Storage of Magma
An interesting problem in volcanology addresses how magma, once separated from its source, travels through solid rock to erupt at the surface. A number of external parameters will influence the basic process. These parameters include the composition of magma relative to wall rock, the stress state of the area of magma intrusion, the mechanical behavior of wall rock—especially its permeability and its ease of fracture—and the rate of magma supply relative to eruption.
Because rocks are a mixture of mineral components, melting occurs over a broad temperature range, in some cases over several hundred degrees centigrade. Consequently, the melting process must not only provide the heat necessary to induce
melting but also that necessary to continue raising the temperature of the partially molten assembly to melt the more stable components. As a result, total melting seldom, if ever, occurs within the Earth. Instead, magma is produced as interconnected tubules, or as thin skins of liquid along grain boundaries. Even at high degrees of melting, the mixture of solid and liquid rock probably never exceeds a crystal-dominated mush.
The relatively low density of the liquid rock results in separation, with the liquid rising toward the surface. The magma may ascend along grain boundaries like liquid flowing through a porous solid. At the confining pressures within the Earth, a liquid cannot move unless replaced by some other material; gaps do not remain within rocks of the interior. Liquid must be kneaded, or squeezed, out of the solid component of magma-producing rock. This occurs through recrystallization that fills gaps left behind as the liquid travels upward along grain boundaries. This process allows the liquid to coalesce into accumulations of increasing size. At some stage the pressure from accumulating magma forms veins and cracks in the overlying rock. The flow of magma through rock shares many similarities with the movement of other fluids, such as groundwater and petroleum. A better understanding of the physical processes of fluid flow through the Earth could provide answers to a wide variety of problems in the earth sciences.
Extensive geophysical observations of Hawaiian eruptions carried out by the Volcano Observatory of the U.S. Geological Survey have produced tremendous improvements in our understanding of magma transport and storage (Figure 2.6). This work is a major advance in volcanology because it has established a predictive framework for eruptive activity in a volcanic system such as Hawaii's. The nearly continuous volcanism occurring in Hawaii offers a rare opportunity to study geological processes operating on human time scales.
Hawaii represents only one of the many types of volcanic systems active on Earth. Many evolutionary steps in Hawaiian volcanism are similar to those that occur in other settings, but the distinct end products erupted at the surface testify to different evolutionary paths for magmas produced in different tectonic settings. Continental volcanism almost invariably involves longer storage times in larger intermediate-depth magma chambers, resulting in the production of more chemically mature volcanics.
Volcanic Eruptions
Once a magma has been produced within the Earth's interior, the likelihood that it will erupt on the surface depends strongly on its chemical composition. Silica-rich magmas are more viscous than those low in silica. In other words, the lower the silica content, the more easily the magma flows. Consequently, basalt—the common silica-poor lava—erupts in great abundance on the surface to form the ocean floor, islands like Hawaii and Iceland, and large flood basalt provinces on the continents, such as those of the Columbia River Plateau and the Deccan Traps of India. Basaltic magmas also tend to have relatively low concentrations of volatiles, which, along with their low viscosities, generally allow basalts to be erupted quiescently. As a result, basaltic eruptions rarely cause loss of life because the flow paths are easily predicted and the flow velocities generally are slow enough to allow effective evacuations. Destruction of immovable objects, however, can be significant because relatively low viscosities allow even small-volume flows to cover substantial areas. The largest basaltic provinces can be devastating in this respect. For example, the Columbia River basalts cover an area of about 200,000 km2, an area roughly equal to Virginia, Maryland, West Virginia, and Delaware combined.
As the silica content of the magma increases, eruption becomes less likely. This is because the high viscosity of silica-rich magma makes it susceptible to heat loss and crystallization during its slow ascent through the crust. Consequently, high-silica subsurface intrusions, which cool to become granite, are abundant, while low-silica intrusions are rarer. However, granitic magmas that do reach the surface erupt violently and may cause widespread destruction.
Eruptions of silica-rich magmas devastate because they are driven by the explosive exsolution of volatiles, particularly water. Even small eruptions, such as that at Mount St. Helens, can be accompanied by tremendous explosions that destroy life and landscape over a wide area. The 1883 eruption of Rakata, on the Indonesian island of Krakatoa, was a moderate-sized event that exploded with the energy equivalent of 20,000 Hiroshima-sized atomic bombs. The explosion ejected approximately 80 km3 of rock into the atmosphere. Some of the finer-grained dust, ash, and vapor circled the globe and stayed in the atmosphere for several years. The explosion left a crater 6 km in diameter and induced tsunamis that killed more than 36,000 people.
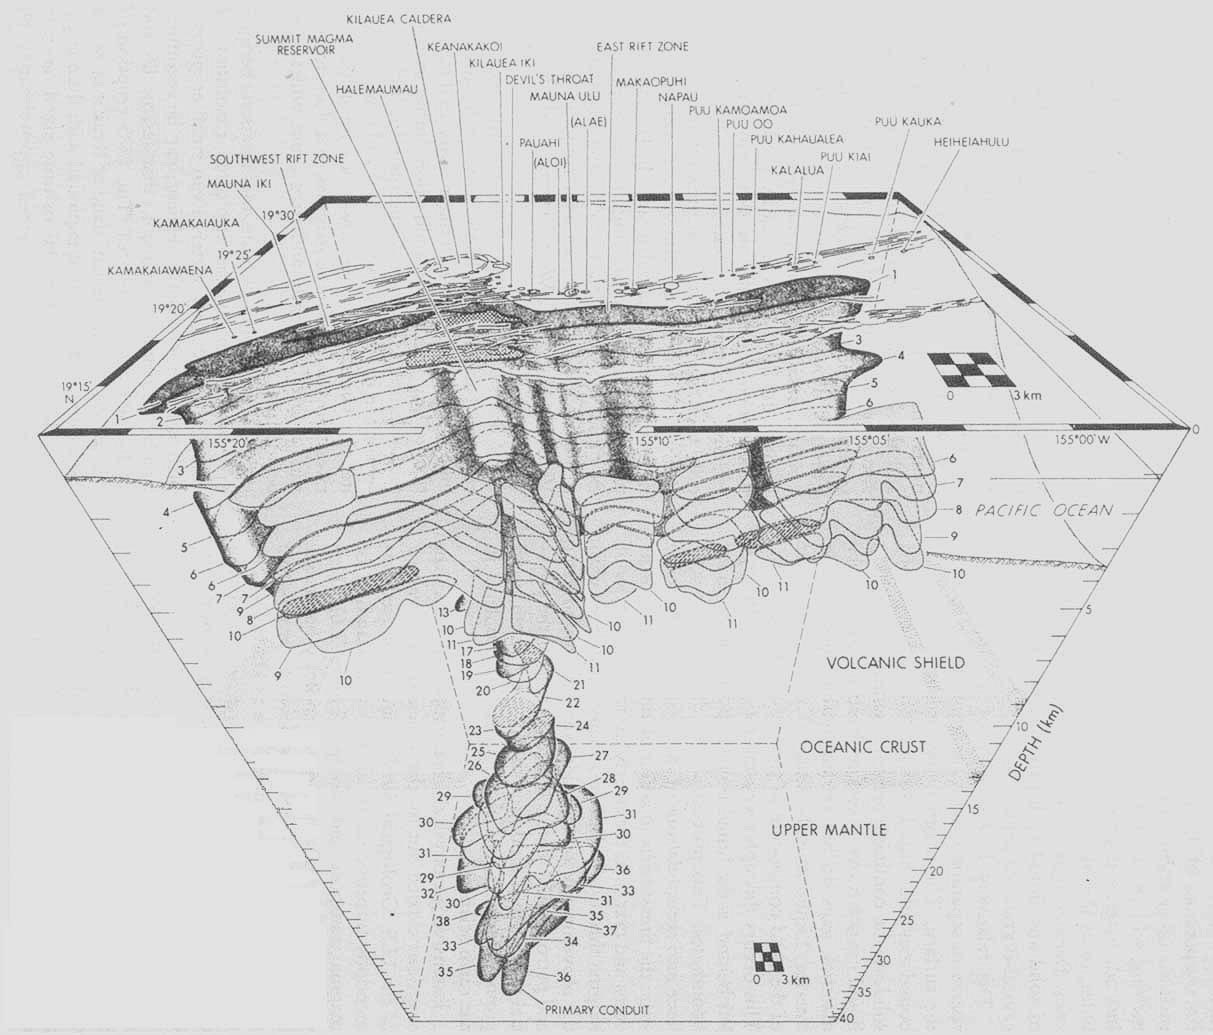
FIGURE 2.6 Three-dimensional internal structure of Kilauea volcano in a north-directed view from above, as constrained by three-dimensional distribution of earthquakes within and beneath the volcano, and by an analytic mechanics of rift-zone intrusion. Influxes of magma within the summit reservoir occurs by buoyant rise of melt parcels within primary conduit. Figure from M. P. Ryan (1987), USGS Professional Paper 1350.
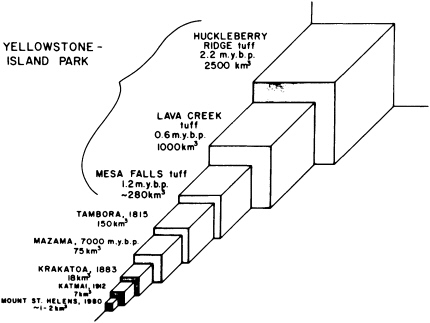
FIGURE 2.7 Relative volumes of some well-known volcanic eruptions. Figure from R. B. Smithand L. W. Braile (1984), in Explosive Volcanism, National Academy Press.
The largest explosive eruptions have left craters 10 to 50 km in diameter. Fortunately, such eruptions predate human experience, but their occurrence in the future is a certainty. For example, large caldera-forming eruptions occurred in the Yellowstone volcanic area of Wyoming about 2.2, 1.2, and 0.6-million-years ago (Figure 2.7), leading to the not unreasonable expectation of another major eruption within the next few hundred thousand years. The latest Yellowstone eruption created sizable deposits of ash as far away as Kansas. The first caldera explosion at Yellowstone, 2.2-million-years ago, has an identifiable volume of ash of about 2,500 km3. It is estimated that the total volume erupted was about twice this value and represented only 10 percent of the magma chamber. Therefore, a magma chamber of between 20,000 and 40,000 km3 was involved.
Direct observations of volcanic eruptions generate estimates and measurements of ascending columns of steam and ash, duration of eruptions, and rates of dome growth, of magma production within the dome, and of lava flow. Space-based observations are capable of locating eruptions that otherwise would not be detected. Satellite-borne sensing devices also provide a clear image of interaction between volcanic emanations and the atmosphere by tracing the global dispersal of gas and dust following an eruption. A new appreciation of volcanic activity's effect on climate has been realized. Clear evidence from historic and contemporary eruptions is now available to show that significant global decreases in temperature accompany the injection of large volumes of volcanic aerosols into the upper atmosphere.
A better understanding of the interactions of volcanic emissions and the atmosphere and hydrosphere is critical. The Krakatoa eruption is only one of the historic events that have dramatically modified the Earth's climate for several years by introducing large volumes of dust and gas into the atmosphere. Recent speculation suggests that large submarine eruptions along ocean ridges may alter ocean temperatures, establishing the El Niño condition with its subsequent implications for climatic variations. Further understanding will come from global monitoring of volcanism, most likely through satellite-based remote sensing and a better theoretical grasp of the relationships dictating climatic response to heat and mass transfer from the Earth's interior to the hydrosphere and atmosphere.
The large-scale effects of volcanism on the atmosphere, climate, and ecosphere have been recognized as a component of the earth system and of cooperative activities such as the International Geosphere-Biosphere Program (IGBP) and the International Decade for Natural Disaster Reduction (IDNDR). Precursor activity of Lascar Volcano, Chile, was first recognized from thermal measurements taken by Landsat, while several stratospheric volcanic plumes containing sulfur dioxide have been discovered and measured by means of the total ozone mapping spectrometer (TOMS) instrument onboard the Nimbus 7 spacecraft. In addition to the use of satellites to assess volcanic hazards, such
programs will include several interdisciplinary investigations that incorporate the effects of volcanism within climate modeling, the analysis of different ecosystems, and the investigation of sea-surface/atmosphere interactions.
The energy of a major volcanic eruption is well beyond what can reasonably be expected to be controlled by engineering. Consequently, for the foreseeable future, humanity can best deal with volcanic phenomena by supporting programs aimed at predicting the occurrence and understanding the likely consequences of an eruption.
OCEAN BASIN PROCESSES
During the middle and late 1960s, widespread recognition of the lithosphere's plate structure crowned 20 years of postwar research in the oceans. Since then, research efforts have driven the investigation of the dynamic Earth in two directions: downward, to discover how plate activity relates to the deep mantle, and laterally outward onto the continents, to establish how the continents are involved in today's plate activity and how earth dynamics operated in the past. There have been surprises, such as the discovery of the black smokers, and there have been breakthroughs, such as the establishment of the age of the ocean floor. There have also been new puzzles, such as the significance of the huge oceanic plateaus representing the eruption of vast volumes of basalt over short intervals. The intellectual momentum provided by plate tectonic theory continues to affect the research directions of many earth scientists, including those who study the interior-driven oceanic processes that appear particularly important to the overall system.
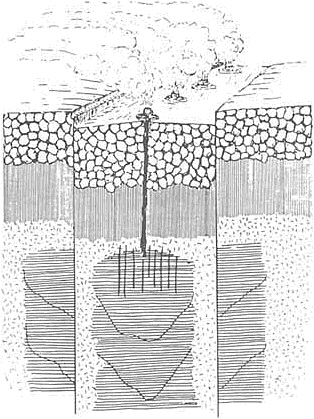
FIGURE 2.8 After crystallization of the oceanic ridge magma chamber, tectonics or late magmatic activity breaks open the plated barrier layer at the top, and water actively penetrates into the hot cumulates. This is the stage of high flux geothermal activity, where high-temperatures can be attained even in very permeable rocks. Figure from The Mid-Oceanic Ridge: A Dynamic Global System (1988), National Academy Press.
Ocean Spreading Centers
Ocean basins open along axes where the crust is torn by the force of plates moving away from each other. Basins spread along centers where partial melting of the shallow mantle generates basalt that ascends toward the surface and is solidified as ocean crust (Figure 2.8). New plates are continuously created. On average, spreading centers lie about 2.8 km below the ocean surface, where they can be detected as topographically high, elongated areas, often with valleys at their crest. A wide range of methods has been applied to the study of spreading centers. They include surface and ocean-bottom geophysical techniques, manned and remotely operated submersible observation, and direct sampling by dredging and drilling. Samples of rocks and fluids have been analyzed physically, chemically, and isotopically. The highly specialized biota that characterize ocean spreading centers have also been studied in detail.
Detailed sampling along ocean spreading centers shows that the intensity of melting is inversely proportional to depth below sea level. The depth of a spreading center, and any accompanying ridge, can be taken as an indication of the average mantle temperature beneath it. High-temperature material will produce a higher degree of partial melting and thus a thicker oceanic crust. The relatively narrow range found in the composition of spreading-center volcanic products worldwide strongly suggests that melting beneath an ocean spreading center occurs through a straightforward process of decompression melting. This conclusion is based on a rela-
tively small sample—ocean centers and their ridges are not easily accessible for direct study.
Recent studies of the ocean volcanic system show that an assumption of uniform magma production along the axis of a spreading center is too simplistic. Close examination of ocean spreading centers and ridges shows them to be segmented at finer scales. Within each segment is a topographic high that is thought to reflect the center of an isolated magma chamber. These chambers feed magma to the remainder of the segment but not beyond the segment boundaries. The spacing of these magma chambers is quite regular—each is on the order of 50 to 70 km long.
The regular spacing of ocean ridge segments is one case in which theoretical understanding of a phenomenon preceded its observation. Fluid mechanical models for melt separation from a large partially molten zone indicate that the melts are drawn from the host rock to coalesce into local concentrations of magma. These local concentrations begin to rise toward the surface because, compared to the surrounding rock, they are low in density and are buoyant. The rising magma bodies are fed by melt extracted from a much wider area than that represented by the bodies themselves. The regular spacing of the globules, and of the volcanoes they eventually create, can be thought of as the optimal size of the melt feeding zone for the globule. Globules formed too close together would not have enough magma available for them to grow large enough to rise efficiently through the overlying rock. Globules formed too far apart are not capable of extracting magma from the midpoint between the globules. Widely separated globules leave behind a source of magma that eventually will create another globule between the original two.
The observed segmentation of ocean spreading centers conforms to this model and suggests that there is a continuous melt zone at depth feeding the isolated volcanoes of each segment. Researchers are attempting to identify and understand the effects of segmentation. They are especially interested in the cooling and chemical fractionation history of magmas erupted along the spreading centers.
The discovery of black and white smokers—vents of very hot, mineral-laden seawater—in the late 1970s clearly showed that the high heat of volcanically active spreading centers drives hydrothermal circulation of ocean water. This circulation allows extensive chemical exchange between water and newly formed crust, leading to concentration of rare metals, significant modification of seawater composition, and maintenance of the giant clam and tube-worm populations around the vents of hot water (see Plate 6).
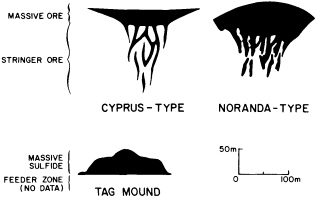
FIGURE 2.9 Cross sections showing the shapes of undeformed Cyprus-type and Noranda-type massive sulfide deposits and the massive sulfide mound at the TAG hydrothermal field in the rift valley of the mid-Atlantic ridge. The age of the Cyprus deposits are about 70-million-years and of the Noranda deposits about 2.6-billion-years. Figure courtesy of Peter Rona, NOAA.
Remnants of submarine black smokers were initially observed in submarine massive-sulfide deposits found on the continents. These ancient representatives had been tilted on their sides and planed off by nature, which permitted detailed examination of these deposits in cross section (Figure 2.9). The active black smokers have two features rarely observed in the ancient ones. One is the peculiar biota able to grow in the dark by feeding on sulfur-metabolizing bacteria, and the other is the chimney form, which has since been identified in some ancient examples.
Researchers now model aspects of spreading centers that incorporate the variables of rift propagation, magma chamber size, spreading rate, and rock flow. They can also run models experimenting with variables of (1) chemical composition, (2) temperature of partial melting, (3) depth of equilibration, and (4) isotopically distinct sources. All of these computer-aided techniques should contribute to successful explanations of variation along the 40,000-km length of the ocean spreading centers.
Intraplate Volcanism: Hot Spots and Oceanic Plateaus
Enormous amounts of volcanic material erupt at hot-spots such as Hawaii. Unlike that at spreading centers, however, the rise of mantle beneath hot-spots is not a passive response to movement of the overlying plate. Rather, hot-spot volcanism appears
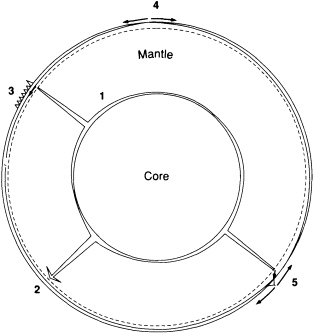
FIGURE 2.10 Various types of mantle plumes are shown. A thermal boundary layer (1) is produced by heating from the core (plumes arise where the boundary layer is thick); the conduit of the plume tapers upward because viscosity decreases upward; new plumes (2) start with a large head; hot-spot chains (3) are generated as a plate moves over a plume and hot material is entrained from the asthenosphere by a plate; normal spreading centers (4) tap the adiabatic interior; and plume material is entrained into hot-spot ridges (5).
to be actively triggered by plumes of mantle material that penetrate the general convective circulation patterns of the Earth's interior. The amount and composition of mantle melt relate closely to the temperature and pressure of melting. This correlation has focused new interest on Hawaii and on other hot-spots, including one at an ocean spreading center—Iceland.
Researchers have been able to model the fluid dynamics of plumes that generate hot-spots. Integrated models that incorporate trace element and isotopic data, such as the high proportion of 3He compared to 4He at hot-spots, address previously intractable questions. Numerical modeling and experimental simulations of mantle convection suggest that plumes arise from unstable boundary zones between convective layers. The most likely source for the largest plumes, such as those under Hawaii and Iceland, is the boundary separating the core and mantle (Figure 2.10). Another possibility places the source at a hypothetical boundary separating the upper from the lower mantle, which would result in layers with distinct convective systems. Hot-spots are so diverse that some could come from each boundary. Surface occurrences of hotspot volcanism correlate with several large-scale geophysical features of the deep Earth. These features include gravity field anomalies and zones of low seismic velocity, suggesting that hot-spots may be a direct link between surface activity and events occurring in the deep interior, perhaps even within the core.
The lazy L-shaped track of the Hawaiian hot-spot (Figure 2.11) shows that the Pacific plate changed direction about 45-million-years ago as it moved over the plume. The track's concentricity with other hot-spot tracks on the Pacific plate confirms plate rigidity and indicates as well that hot-spots do not move very fast with respect to each other. Hot-spots and their tracks are very useful in interpreting plate rotations and in attempts to search for a component of true polar wander in the relative motions between continents and geographic poles.
Plateaus are extensive areas of above-average
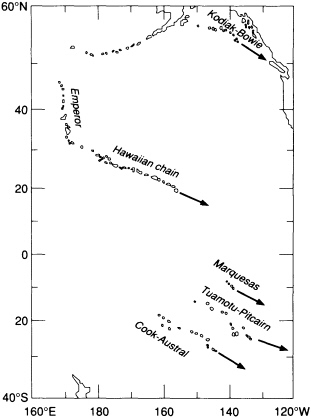
FIGURE 2.11 Some linear volcanic chains of the Pacific with arrows showing directions of propagation about a rotational pole.
elevation, and oceanic plateaus are areas largely or wholly flooded by the waters of the ocean. Some oceanic plateaus are known to be fragments of continental crust such as the Seychelles plateau in the Indian Ocean, the Rockall plateau in the Atlantic, and the Campbell plateau southeast of New Zealand. But most appear to be giant analogs of Iceland or Hawaii, up to 1 million km2 in area and tens of kilometers thick, representing an enormous amount of partial melt from the mantle. The largest group of these oceanic plateaus, including the Shatsky, the Manihiki, and the Ontong Java plateaus, lies in the western Pacific Ocean. Most appear to have been erupted about 110-million-years ago, in some cases over intervals as brief as 20-million-years or less. Magnetic anomaly patterns show that some of these oceanic plateaus were formed at ocean spreading centers, indicating that complementary features—plateau twins—may have formed on symmetrically growing plates that have since been subducted. There are no representatives of the western Pacific type of oceanic plateau within the continents, so it can be inferred that they, like the plates they formed on, subduct into the mantle. Distinctive slivers in rocks marking ancient convergent boundaries within the continents suggest that this has indeed been the case. Oceanic plateaus may record sporadic and episodic events in mantle convection, so closer scrutiny could help to answer some questions about time dependence of mantle processes.
Plate Kinematics
The creation of new ocean crust at spreading centers is an essential feature of the plate tectonic theory. The general details of the formation, evolution, and destruction of ocean basins are now relatively well understood. Ocean basins form with the splitting of an arc or of a continent in the process of rifting. The basin increases in size by additions of volcanic crust on each side of the spreading center at rates ranging from 1 to 10 cm/year along the entire spreading center's length, increasing the width of the ocean basin by up to 200 km every million years. At the same time the ocean deepens away from the ridge crest, the ocean crust and lithosphere become more dense and less buoyant.
Development of plate tectonic theory led to determination of the rates and directions of motion on the largest plates (see Figure 2.5). The motions of plates are calculated with respect to each other and with respect to various slowly moving reference frames. Using earthquake mechanisms, plate boundary geometry, and the youngest ocean-floor magnetic anomalies, researchers can estimate plate velocities in the general range of centimeters per year. These velocities, which represent averages for the past 3-million-years, have been steadily refined. Now, with a small number of local exceptions, plate velocities are well established. Space geodesy shows that over intervals of years plates move at about the same speeds as they are estimated to average over millions of years. Over longer intervals, as much as 100-million-years, estimates of ancient plate motions have been steadily refined with mapping and remapping of magnetic anomalies and fracture zones. The challenge of the next decade is to resolve the motion in small plates and in complex plate boundary zones and to track irregularities in plate motion that appear over short intervals and locally within plates.
The plate tectonic cycle and seafloor spreading can explain the general evolution of ocean basins, so attention has focused recently on the specifics of the spreading process. These specific problems include propagation of spreading centers, reorganization of plate structure, formation of new plates, and amalgamation of older plates. An important result has been to show how changes recorded in rocks and continental structures relate to changes in plate structure recorded in the ocean. The crowning success in this field was the recognition that the strike-slip motion in California, which has produced the complexity of the San Andreas Fault system, began when the East Pacific Rise spreading center reached the convergent margin of North America. Refinements in understanding continental tectonics will continually refer to the structural history of the oceans. The most obvious needs are in less-well-known areas such as the Arctic, the South Atlantic, and the Indian oceans.
Ocean Convergent Plate Boundaries: Island Arcs
The plate tectonic cycle is completed when the ocean floor subducts at an ocean trench. The ocean floor material returns to the mantle along subduction zones, which are often associated with island groups, such as the Marianas and the Lesser Antilles and in the Central Aleutian, Scotia, Vanuatu, and Tonga arcs. Early plate tectonic researchers recognized that volcanoes in oceanic island arcs erupted some rocks that are similar in chemical composition to the average outcrop of continental crust. So, theorists suggested, a plausible origin for the continents might have been assembly by the sweeping
together of island arcs. Island arc volcanism is accompanied by igneous intrusions. If these arcs swept together, the underlying intrusions could eventually form the huge batholiths that form the roots of cordilleran mountain ranges characterizing ocean-continent convergent plate boundaries. This is the process going on today in Southeast Asia, especially the Philippines and Indonesia.
Detailed study of oceanic island arcs, and especially the Central Aleutians, has cast doubt on this simple picture. The average composition of the arcs differs significantly from that of the continents. For example, silica contents average 50 percent rather than the 60 percent typical of continental crust. A likely explanation appears to be that the upper parts of the oceanic arcs, which are richer in silica, are concentrated in the continents during the process of continental assembly. If this suggestion proves valid, it has far-reaching implications for the evolution of both crust and mantle. Earth scientists have generally considered that the bulk of the buoyant material of island arcs and continents remains at the Earth's surface once it has formed. It is a new and challenging concept that some fraction of this material is being returned to the mantle.
Volcanism along convergent margins is a perplexing subject of debate. The problem is compounded by lack of theoretical and observational information on the temperature and flow structure in the mantle beneath convergent margins. The premise is that the subduction process injects a cold surface plate into the mantle. Intuitively, this should cool the mantle that surrounds the subducting plate, but somehow the subducting plate instigates volcanism.
Two distinctive features of volcanism in the environment are the involvement of volatile components and the eruption of andesite in addition to basalt. Melting seems to be aided by the transport to depths greater than 90 km of water and carbon dioxide held within the subducting plate. Water-and carbon-dioxide-rich fluids may be released from the subducting plate as it becomes heated. These fluids then rise into the overlying mantle to act as fluxes that trigger melting. Trace element and isotopic analyses of arc lavas have shown that the sediment coating of the subducted oceanic crust indeed is transported to the sources of the volcanoes to play a role in initiating magma genesis.
Experimental studies of magma source materials at appropriate temperatures, pressures, and varying fluid contents have outlined possible melting conditions under a variety of thermal conditions. Geochemical studies of the volcanic products have described their variability in volcanic products and have identified the physical processes that contribute to determining magma composition. But these studies have not identified a unique origin or a differentiation path for arc magmas.
The current initiatives to establish a global network of broad-dynamic-range seismometers and abundant portable seismometers will produce detailed seismic images of the mantle beneath arcs. Some work already has been done on this topic, particularly in Japan, which has provided new information on the temperature distribution beneath arcs. Additional information on the character of mantle flow beneath arcs may derive from studies of anisotropic seismic wave propagation in these areas. Seismic waves passing through olivine, the dominant mineral in the upper mantle, travel at different speeds, depending on their orientation with respect to the crystal growth axes of the olivine. The crystals can be preferentially oriented by the stresses associated with mantle flow. This orientation causes detectably different transit times for seismic waves passing parallel and perpendicular to the flow direction. Because of this anisotropic behavior of olivine, seismic data may possibly be used to determine the direction of mantle flow beneath arcs. Detailed seismic studies of the subarc mantle, especially with the improved resolution expected from the next generation of digital seismic sensors, may provide much clearer images of these inaccessible regions.
Volcanism at convergent margins may be unique to the Earth, and understanding the process is particularly important for several reasons. Arc volcanism may be the primary means by which the continents are formed. If that is true, the continents ultimately owe their origins to subduction and the volcanism it instigates. Subduction returns surface materials to the mantle, which keeps the interior fertile for continued volcanism. If it were not for subduction, continued crustal formation would have removed most of the easily meltable components from the mantle, leaving a residue immune to melting and hence incapable of driving the plate tectonic cycle.
Arc magmas often are very rich in dissolved volatile components that interact with hydrothermal circulations, resulting in economic concentrations of certain elements, particularly copper, but also gold, silver, and molybdenum. This same characteristic makes arc magmas likely to result in dangerously explosive eruptions when they near the surface—explosions driven by the violent boiling of the gases that were dissolved in the magmas at greater depths. Arc volcanism, consequently, rep-
resents one of the prime volcanic hazards to human populations.
Important and difficult questions challenge investigators of subduction zones. These questions address the controls over subduction and magma genesis; the fate of subducted slabs; and the proportions of converging plates that remain near the surface, that descend only to reemerge as volcanic material, and that sink far into the mantle to affect the convecting material at great depth. Because of the complex nature of subduction zones, answers to these questions are likely to come slowly and only by integration of a wide variety of data. As with many areas of the earth sciences, understanding the causes and consequences of subduction zone volcanism and the history of the assembly of the continents from volcanic arcs will result from integration of the increasingly detailed data provided by geological, geochemical, and geophysical observations with powerful numerical models.
CONTINENTAL STRUCTURE AND EVOLUTION
The other terrestrial planets lack the surface division into continental and oceanic crust that is a distinctive feature of the Earth. The continents may owe their existence to another distinctive characteristic: the Earth's abundance of free water. As described in preceding sections, oceanic water forms submarine hydrothermal vents at oceanic ridges, where associated hydration of the juvenile ocean-floor basalt forms minerals such as chlorite, serpentine, and amphibole with water bound into their structures. The subsequent dehydration of these minerals when they are subducted provides a flux of solutions into the overlying mantle wedge that initiates arc magmatism and causes the distinctive geochemistry of the magmas that build the island arcs. Parts of these in turn provide the raw material that is built into continents.
Studies of the continental crust and its margins will be a prime focus of geological research in the twenty-first century. Deciphering the complex interplay between tectonism, volcanism, climate change, sedimentary deposition, and geomorphic processes is vital for understanding the nature of global change. The development of this field will have a major influence on the intellectual development of the solid-earth sciences as well as on exploration for material resources. A large variety of investigatory methods will be applied.
Seismic Imaging of the Crust
In the early 1960s an active program of seismic investigation gathered data about the continental crust. As a result, the general characteristics of the continental crust in North America and the relationship between crustal structure and tectonic features were recognized. However, the usefulness of the seismic data was restricted by the limited capabilities of existing instrumentation and the absence of sophisticated processing and modeling techniques for interpretation. A rejuvenation of seismic crustal studies occurred in the 1980s with the availability of modern digital recording instruments and powerful computers.
Seismic information on the structure of the continental crust has been provided by three primary types of experiments—deep seismic reflection profiling, refraction and wide-angle reflection methods, and analyses of earthquake network and array data. A stimulus in understanding the present structure of the continental crust has come from the work of the Consortium for Continental Reflection Profiling (COCORP) and other deep reflection profiling efforts, both in the United States and abroad. Their mission was to extend the methods of seismic reflection profiling, which had been developed with great sophistication for shallow depths in oil exploration, to depths of tens of kilometers. In this way the structure of the continental crust, which is normally between 30 and 50 km thick, could be analyzed. This technique produces images detailing intrusions, shear zones, complex configurations of faults, boundaries between rocks of different composition, and reflectivity associated with variations in physical properties such as porosity. Deep reflection has mapped areas of ancient continental collision and located many dormant rifts, both within continents and along Atlantic-type margins.
The long-range capabilities of refraction and wide-angle reflection profiling techniques make these methods particularly suitable for studies of the deep structure of the continental crust and upper mantle (Figure 2.12). These capabilities have led to the discovery that crustal velocity structure, thickness of the crust, depth to the crust-mantle boundary, and the configuration of reflective interfaces within the crust are most strongly related to the nature and timing of the most recent major tectonic event to have affected the continental crust. Scientists had assumed that these properties were determined by the characteristics of the crust at the time of its origin. For example, profound changes in the seismic structure of the crust are produced by
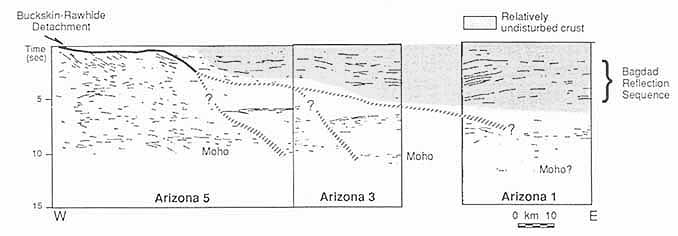
FIGURE 2.12 Interpretive line drawing from seismic reflection data. The upper crust where the Bagdad Reflection Sequence is observed has remained relatively intact throughout Tertiary deformation, limiting the location of significant deformation associated with detachments. From R. K. Litak and E. C. Hauser (1992), Bull. Geol. Soc. Am. 104, 1315-1325.
rifting, extensional events, thermal events, and volcanic activity. Therefore, detailed seismic studies of these features provide information not only on present characteristics but also on the geological and tectonic evolution of the continental crust.
Substantial amounts of new information are generated nearly continuously by the recording of earthquake-generated seismic signals on network and array stations. These data are being used to locate and study earthquake sources and to map crustal structure variations beneath the network of stations.
Higher-than-average velocities for seismic shear waves are observed in the upper mantle beneath continents to depths of at least 150 km. Though diminished in amplitude, the high velocities locally appear to extend down as far as 400 km, as in Canada's 2.7-billion-year-old Superior geological province. This evidence for continental roots suggests that the mineralogical constitution, and hence bulk chemical composition, of the upper mantle beneath ancient continental crust differs from that of the surrounding mantle. One explanation for the origin of this distinct mantle beneath continents is that it represents the residue left behind when partial melts were removed to form overlying crust. Melt removal leaves a residue that is less dense than the original material. Therefore, a melt-depleted mantle root could be buoyantly stable beneath a continent even though it might eventually cool to lower temperatures than the surrounding mantle. The presence of the anomalous mantle material may help to protect the overlying continental block from the effects of convection at greater depth. Indeed, old continental crust may owe its long survival in an otherwise very active and changing surface environment to the distinctive composition of its underlying mantle.
Direct samples of the subcontinental mantle reach the surface as fragments torn off conduit walls of certain types of explosive volcanic eruptions. Pressure- and temperature-dependent changes during eruption have left their signature in differences between certain minerals in these rocks. Recognition of the signatures allows the depth of origin and original temperature of these materials to be determined. Based on this type of information, a well-catalogued sample suite spanning a depth range to 200 km is available in many areas, particularly southern Africa. Results of the analyses of coexisting minerals in these xenoliths have provided estimates of temperature as a function of depth down to 150 to 200 km, giving a fossil geotherm for the date of the eruption, tens of hundreds of millions of years ago. This remarkable geophysical result from mineral analyses is a good example of the interdependence of different approaches to the earth sciences. Field and petrological studies identified the rocks as samples derived from the mantle, experimental calibrations and thermodynamic calculations defined the mineral compositions in terms of pressure and temperature, and refinement of the electron microprobe facilitated analyses of sufficient accuracy that the calibration could be applied to the rocks. These samples of subcontinental mantle are depleted of their easily meltable component but, curiously, are enriched in a number of trace elements that also would be expected to be depleted by melt removal. The pattern of trace element enrichment of subcontinental mantle mirrors that of the continental crust. This suggests that the subcontinental mantle may serve both as the ultimate source
of the magmas that form the continents and as a filter that selectively passes incompatible trace element-rich fluids rising from below.
Mountain Building: Metamorphism and Deformation of Continents
Convergence of tectonic plates causes contraction in the crust, resulting in mountain ranges with many folds and faults. The formation of mountain ranges transports rock masses through changes of pressure and temperature. The rock masses respond by changing texture, structure, composition, and mineralogy as they approach equilibrium with the new conditions. During the complex changes, dissociation reactions release volatile components and solutions migrate through the rock masses. Study of these metamorphic changes enhances information about the thermal structure of the continental lithosphere and of mountain ranges, the time scales for mountain building, and the mechanisms and scales of fluid flow through the crust.
A long-term approach of metamorphic petrologists to understanding mountain-building processes has been to calibrate naturally occurring mineral assemblages in terms of the depth, a pressure equivalent, and the temperature at which they last equilibrated. This approach is complemented by the forward approach, in which the thermal response of the rocks to tectonism is determined by computer modeling of the transient temperature distribution in a rock mass having specified properties, as it is depressed into warmer regions or uplifted toward the surface at specified rates. Combining these two approaches promises greater understanding of processes. Experimental determination of mineral reactions as a function of pressure, temperature, and different volatile components—such as H2O, CO2, and O2—provides a depth-temperature framework, or grid, of reaction boundaries for the location of many common mineral assemblages. Reactions in various rock types were initially modeled in terms of phase diagrams, using observations of natural mineral assemblages. A second generation of grid models was derived through the combination of petrological observations and experimental results on selected mineral reactions. Sufficient thermodynamic data are now becoming available for the calculation of a third generation, allowing the whole family of grids to be calculated once the thermodynamic parameters have been chosen. Predictions of mineral reactions and compositions, based entirely on thermodynamic data, agree well with petrological observations, but additional experimental work is required before further refinements can be made.
The application of temperature and pressure estimates—called geothermometry and geobarometry—to certain rocks in the European Alps yielded the surprising result that these continental rocks had been buried to a depth of at least 100 km, at a temperature of 800°C or more. It had been assumed that light, relatively buoyant continental rocks had not been buried very deeply. The explanation of how these rocks returned to the surface from such depths without completely recrystallizing is another challenge for structural geologists. In recent years investigations in mountain ranges on other continents have suggested that similar occurrences are not uncommon.
The principles of geothermometry and geobarometry, when applied to zoned minerals or to incompletely reacted mineral assemblages, help to define the paths of depth, or pressure, and temperature (P-T paths) followed by the individual rocks. These paths represent part of the tectonic history of the whole rock mass, or mountain range, and provide important insight into geological processes. Interpretation involves unraveling details of crustal thickening, folding, uplift, and local heating by igneous intrusions. Chemical data on the zonation of minerals can provide a wealth of information on the thermal processes that took place during mountain building as well as on details such as the growth history of minerals. Future work coupling inverse theory, experimental diffusion, and crystal growth data with new high-technology measurements of chemical zonation in minerals will provide an exciting revelation of the kinetic history chemically preserved in rocks that have undergone a wide variety of tectonic excursions in the Earth. This information will open a new window into the internal workings of the crust and upper mantle and will help to test our current views on the workings of plate tectonics. Improvements in analytical instruments have recently produced a highly significant advance. Ion-microprobe measurements of ages within a single zoned garnet in a rock provide, in addition to the P-T path, information about time (t). The newly developed laser probe dating technique produces results accurate enough to discriminate between several episodes of mountain building by measurements made on a single crystal.
Rates of mountain building can be estimated as well. For example, when measurements of radiometric ages are matched with the geobarometric and geothermometric evidence, P-T-t paths are derived that yield rates of geological processes associated
with mountain building. The focus of metamorphic petrology today is shifting from a static mode, which reports the mineral assemblages found in the field, to a much more dynamic mode, aimed at working out the processes involved in metamorphism. This shift emphasizes not only the thermodynamic variables but also nonequilibrium aspects and the kinetics of metamorphic processes. In particular, kinetic study has been extended to the generation, motion, and characterization of metamorphic fluids. There are several processes that must be quantified in describing the results of metamorphic reactions between rocks and fluids so as to provide answers to questions about heat transport processes, both conductive and convective; fluid mass transfer processes; solute mass transfer processes—convective and diffusive; mineral surface reaction processes, both dissolution and growth; and nucleation of new minerals.
The P-T-t histories of rocks commonly include extensive expulsion and migration of fluids. These fluids usually move near the surface, but problems emerge with fluid movement much deeper in the Earth. For example, at depths near 6 km the fluid pressure approaches lithostatic pressure. It is difficult to understand convective fluid flow, potential for channelization, or flow rates and volumes at such high-temperatures and pressures.
The chemical reactions taking place involve moving fluids. Progress has been made in obtaining thermodynamic data for minerals and fluids, but the behavior of fluids as a function of composition over a wide range of pressure and temperature conditions and the equilibrium description of solid solutions needs more data. Models need to be developed that account for the dissolution, transport, and precipitation of chemical components during the flow of fluids through a series of rock units. The quantitative treatment of isotope exchange between minerals and fluids needs to be elaborated further to make use of the increasing isotopic data base on reactions. An understanding of the chemical evolution of the crust must be based on knowing the transport properties of the fluid, such as whether flow is diffusive or convective, as well as the complex heterogeneous kinetics taking place at every mineral surface in contact with the fluid.
Extensional Deformation of Continental Lithosphere
Deformation in mountain belts is dominated by contraction. It is possible to simulate the great folds of the Alps, Himalayas, and Rockies by pressing on the leaves of a book or by pushing a napkin along a table. Although the rheology is very different, there are resemblances to what happens in nature, both in the flat layering of the original material and in the detachment at the base of the deforming layers from the material beneath. Analyses of rock deformation in a contractional regime on mega, macro, and micro scales have become very sophisticated, and environments can be satisfactorily modeled, especially where complementary data on metamorphic state are available.
The concept of converging tectonic plates that contract the crust and produce mountains fits well with our understanding of plate tectonic theory. Within the past decade researchers have emphasized another process that actively deforms vast tracts of continental crust. That force is extensional deformation, and its widespread effects have come as a surprise. Contraction and extension are both characterized by detachment of the crust from the underlying mantle; in the case of extensional deformation the detachment occurs in the form of normal faults.
Surface expression of extension commonly occurs in the form of rifts, and active rift zones can be seen in many continental areas. The character of the modern rifts, however, shows considerable variation. The rift of East Africa spans almost the entire continent from north to south. At its northern end, extension and volcanism have been considerable, leading to the formation of the Red Sea basin that now separates the once-connected Africa and Arabian peninsula. Through central Africa, rifting has been less successful in splitting the continent. Volcanism in this area is rarer, and the rift also contains a higher proportion of peculiar alkali-rich lava types than the northern rift. In the United States the Rio Grande rift that splits the Colorado Plateau from eastern New Mexico is only tens of kilometers wide, whereas the Basin and Range province exhibits continental extension and rifting over a zone more than 600 km wide. Volcanism is widespread in each of these rifts but generally consists of isolated, relatively small volume eruptions.
The rifting of continental material can evolve in one of two ways: either the extension in the rift can develop until new ocean floor forms at the rift site (such a rift is called a ''successful" rift), or extension can cease before a new ocean forms and the rift can become inactive within the continent (such a rift is called a "failed" rift). The former course represents a progressive step in the cycle of the opening and closing of the ocean basins, while the latter represents only one more episode within the evolution of
the continental lithosphere. Whether a rift system "succeeds" or "fails" is presumed to be controlled by the disposition and sum of the plate-driving forces at some critical time in rift evolution.
The "successful" course of rifting is typically represented around the shores of the Atlantic Ocean and other similar margins attributable to continental rupture. A considerable research effort is developing on what has happened in the earliest stages of ocean formation in these areas. Stimuli include the lessons learned in the Basin and Range province and the recognition that the typical dog-leg shape of the shorelines of the Atlantic resembles the shape of the East African rifts. As in East Africa, nodal (hotspot) volcanic areas are concentrated at the dog-leg bends in the Atlantic shore. Marine geophysics calibrated by the drilling of research holes of the Ocean Drilling Project is revealing that enormous amounts of basalt were erupted onto the young ocean floor at the dog-leg bends. In some cases much smaller volumes of lava continued to be erupted as the ocean continued to grow, forming hot-spot tracks that lead to active hot-spots such as Iceland, Jan Mayen, Reunion, and Tristan da Cunha.
More than 100 ancient rift systems have been recognized within the continents. The oldest go back to nearly 3-billion-years ago, indicating that ancient continents behaved rather like their modern counterparts. Regional extension of ancient continents is also indicated by the preservation of parallel swarms of hundreds of narrow vertical dikes occupied by basalt, all emplaced at the same time, that extend for distances of 1,000 km or more across the ancient continents.
The cause of the variations in volcanic output and degree of crustal extension in continental rifts is not understood at present. Significant advances can be made on this topic through detailed field studies employing modern techniques of remote sensing, chemical and chronological analyses, and paleomagnetism, in addition to traditional field mapping. Scientifically oriented drilling into continental rifts can do much to illuminate their structure and the sequence of volcanism and sedimentation that records their evolution. Combined with the increasing resolution of geophysical techniques capable of providing images of subsurface structure, computer modeling and laboratory simulation of the response of rigid crust to extensional stress may illuminate the underlying causes of continental rifting. The Basin and Range province is proving a marvelous area in which to study extension. Detachment systems in that region are the subject of integrated geological, geophysical, and geochemical study.
The detachment systems accommodate extension by the separation of relatively undeformed crustal blocks, with individual faults transecting the upper 15 km or so of the crust and having displacements typically measured in tens of kilometers. The end products of extension are often exposures of wide tracts of middle crustal rocks veneered with patches of upper crustal rocks and subsequently eroded material. Such extended domains have been identified throughout the Basin and Range province. They are on the order of 100 to 200 km wide and are interspersed with relatively unextended upper crustal blocks (Figure 2.13).
Paradoxically, the topography of these tracts, as well as gravity anomalies and reflection seismic data, indicate that despite the vast area and substantial heterogeneity of upper crustal strain-large enough in some cases to form an ocean basin-the crust maintains a near-constant thickness across the boundaries. These observations have led to the recent suggestion that the upper crust may be floating on a deeper layer within the crust. This differs from the usual assumption that the thickening and thinning observed in the upper crust are accommodated at depth by flow in the upper mantle. It appears that the upper crust and upper mantle are probably strong, while the lower crust is generally weak and ductile in this environment. Multidisciplinary studies of the lithosphere in these regions promise major advances in understanding deformational processes in the continental lithosphere over the next decade. Particular advances are anticipated in understanding the bulk rheology, strain field, and deformation mechanisms of the deep crust. These advances will construct a framework with the potential to unify a broad range of disciplines, including petrologic and isotopic thermobarometry, geophysical imaging, geochemical studies, physical modeling, and field geology.
Evolution of the Continents
The plate structure of the lithosphere was accepted in the 1960s. Soon afterward came the realization that plate tectonic processes represented the dominant way in which the Earth dissipates its internal heat. The next question addressed the length of time that plate tectonics has played a major role in earth processes.
There is no strong evidence, even in the oldest rocks, of any processes that were radically different from those of modern plate tectonics. There is
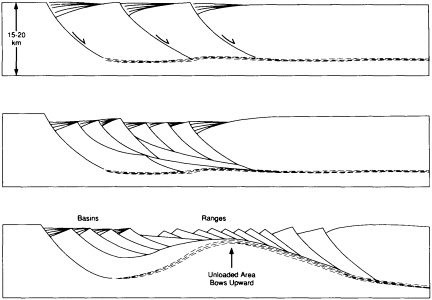
FIGURE 2.13 A conceptual model of a migrating zone of isostatic uplift during extension; although the detachment surface is originally subhorizontal, its ascent through the brittle crust occurs along a relatively steep zone.
persuasive evidence, however, that some processes were not exactly the same. For example, because the Earth was hotter when it was young, a larger proportion of the mantle melted at higher temperatures. This produced magnesia-rich lavas that are abundant in rocks formed between 3.8 billion and 2.5-billion-years ago but are very rare in the more recent rock record.
Direct evidence of rigid plate rotation across the surface of the Earth extends no farther back than the formation of the oldest preserved ocean floor—only about 170-million-years ago. From this evidence, the dominance of plate tectonics during that interval—5 percent of earth history—is essentially proven. For earlier times indirect inference becomes necessary. The record of older earth history must come from the continents because ocean floor is subducted back into the mantle. Geologists establish what has happened to the continents during the past 170-million-years of earth history and then project those assumptions to earlier intervals.
The world map indicates that plate tectonic processes have led, over the past 170-million-years, to the operation of a global cycle in continental evolution. Continents rupture, as in East Africa, and open into new ocean basins such as the Red Sea. Ocean spreading centers expand the basins until they reach at least the size of the Atlantic. Eventually the basins shrink when subduction eats away at their edges. Finally, oceans close, as the Mediterranean is closing. The ocean basins disappear, their location marked by sites of continental collision, as in the Himalaya and Tibet.
Within this broad cycle, complexity develops. Arcs break away from continents, as the Japanese arc rifted from Asia about 30-million-years ago. Elsewhere, arcs collide with continents, as have Taiwan, Panama-Colombia, and Timor. Along the Andean cordillera, mountains and volcanoes were built at the convergent boundary, were rifted into the Pacific ocean, and were swept back into the South American continent. Further complexity results when spreading centers slip beneath continents—slivers of material slide along the edge of the continent, and associated elevated areas form as continental rifting develops. This is the origin of the San Andreas Fault system in California and the neighboring Basin and Range province (Figure 2.14).
Projections of this complex cycle to earlier intervals suggest that similar tectonic forces have dominated since Earth's early history. The geological record shows evidence of suturing where ancient ocean basins closed and continents collided. It also contains the arc and continental fragments that collided and contracted and have been assembled into the continents.
No known continental lithosphere is older than 3.9-billion-years, and the oldest sedimentary rocks date to about 3.8-billion-years. But detrital grains as old as 4.2-billion-years have been discovered in western Australia in rocks that date to 3.6-billion-years ago. This discovery supports the assumption that continental crust of even greater age once existed but has been destroyed.
All the continents contain fragments of material that is older than 3.0-billion-years. The best examples are preserved in extensive areas of Greenstone belt terranes in the Canadian, southern African, and
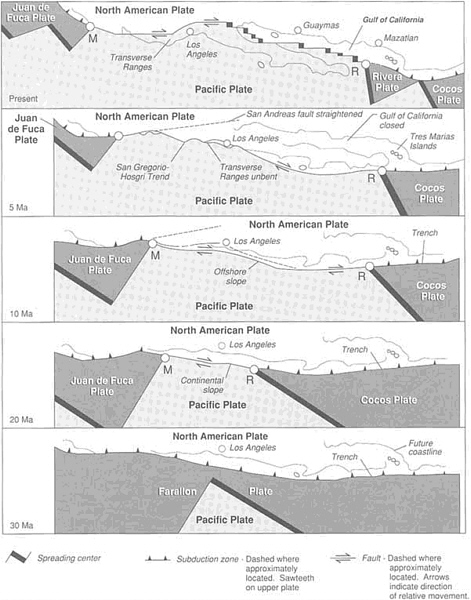
FIGURE 2.14 Sequential diagrams showing plate-tectonic evolution of the San Andreas transform fault system. Early transform faulting was west of the present-day San Andreas Fault and presumably separated young oceanic rocks of the Pacific plate from rocks of the North American plate. Over time, the transform faulting has stepped eastward, and virtually all of the present fault is now in rocks of the North American plate. Figure from USGS Professional Paper 1515.
West Australian shields. This old crust represents material assembled from island arcs in ancient ocean basins. Those primeval island arcs were surprisingly similar to the modern Marianas, Central Aleutians, or Lesser Antilles.
The mantle lithosphere beneath these greenstone belt terranes is unusually cold, and the lithosphere is twice as thick as elsewhere. This may be explained if ocean spreading centers of the early Earth operated at higher temperatures than they do today. Higher temperatures would have extracted more material from the mantle to form a thicker ocean-basin floor. During subduction the thicker ocean floor would produce a larger proportion of light material that would accumulate beneath the old continents as they were constructed by the assembly of colliding island arcs.
Sedimentary Basins
Rocks above sea level, particularly those forming the mountain belts of the continents, weather from reaction with the atmosphere, biosphere, and hydrosphere. Streams carry the weathered material downslope until it is deposited in low-lying areas forming the world's sedimentary basins. Sedimentary basins form by long-term subsidence of the crust through sediment or tectonic loading and by thermal subsidence. Many sedimentary basins have a subsidence history that covers about 100-million-years and characteristic horizontal dimensions of several hundred kilometers. They are of particular interest because they are the source of fossil fuels and many mineral deposits. (Sedimentary basins are covered in more detail in Chapter 4.)
Over long time scales, sedimentary basins (see Figure 1.13) provide a record of the geological processes active in the crust. Their structure is often attributable to flexure of the crust. Other sedimentary basins are attributable to displacements on major faults. Examples of this latter type include both rift and foreland basins.
Reconstructing time-temperature histories for sedimentary basins is of direct economic application to the petroleum and mineral industries but also is of interest to the general geological community. Seismic stratigraphy of the sedimentary deposits in basins has provided a wealth of data on the variations of sea level with time. Models that use variations in the volume of mid-ocean ridges to displace water appear to explain long-term (~100-million-year) variations in sea level. Some short-term variations can be explained by episodic glaciation. However, many observed variations in sea level remain unexplained. Models that include sea level change, subsidence, and sediment supply can be used to obtain synthetic stratigraphic sections, and inverse modeling has been used to determine the role of these factors from observed seismic sections. Changes in the Earth's orbit influence sedimentary deposition. Evidence of this can be discerned in sediments, particularly during glacial epochs.
The broadest sedimentary basins are the oceans themselves, and thick deposits of sediment collect along continental slopes and on continental shelves. When rivers flow directly into open oceanic currents, their sediment loads disperse over wide areas. When they flow into protected gulfs and small seas, rivers deposit their sediment loads as soon as they reach relatively quiescent waters and the sediment accumulates into deltas, such as the Nile, the Mississippi, and the Ganges. When a river carries very large quantities of sediment, extensive deltas develop even if they flow directly into the open ocean as in the Amazon system.
During certain periods of earth history, when ocean spreading centers were very numerous and broad, water was displaced from ocean basins, and high seas flooded extensive tracts of low-lying continental crust, creating inland seas. Both inland seas and deltas may subside beneath the weight of accumulating sediments until thicknesses reach thousands of meters and lower layers consolidate under the pressure. Long after the inland seas have disappeared and the rivers have changed course, these buried porous sandstones, siltstones, and limestones act as reservoirs for groundwater and petroleum resources. Smaller expanses of lake beds and river valleys also serve as sedimentary basins that accumulate deposits and later serve as reservoirs for fluid concentration. Finally, when continental crust rifts or collides with other plates, the thick deposits in sedimentary basins are subjected to forces of extension, compression, and intrusion. They are deformed and metamorphosed. Sometimes they are carried down into subduction zones at convergent plate boundaries and recycled into the overlying crust. When the rocks of sedimentary basins are thrust to the surface during mountain building, they are exposed once again to weathering processes and to the sedimentary cycle.
Continental Collision
Because the volume of the Earth has varied little since its earliest history, the operation of plate tectonic processes on the global scale must have always involved complementary plate making at
spreading centers in the oceans and plate destruction at convergent plate boundaries. The cordilleran process that characterizes convergence between oceanic and continental plates involves the rifting of fragments hundreds of kilometers long from the continent and the collision and lateral motion of objects of comparable size. At times in earth history, plate motion has inevitably led to collisions between objects of continental dimensions.
The huge Alpine-Himalayan mountain chain represents the site of an ongoing continental collision between Eurasia and three fragments of the former continent of Gondwanaland: Africa, Arabia, and India. An earlier large-scale continental collision involved Gondwanaland itself, which collided with Laurasia 300-million-years ago to form the short-lived supercontinent of Pangea. Comparable collisions may be vaguely discerned in the older rock record—for example, in the original assembly of Gondwanaland about 600-million-years ago.
In the Mediterranean area the Alpine-Himalayan chain shows some of the complexities of continental collisions. Continental fragments collided tens of millions of years ago to form the Alps, the best studied of all mountain ranges. Crustal rocks were locally carried to depths of 100 km during this mountain-forming process, and they have been intensely deformed during several episodes. Widespread collapse of the elevated mountains is evident, a process also encountered at present in western North America. Collapse of mountain ranges by extension may be as general and as significant a part of their history as their construction by shortening. The kinds of integrated geological and geophysical approaches applied in western North America suggest that the mountain belts of the Alps and the Mediterranean region are uncoupled from the underlying mantle and are moving independently. Lateral movement, perhaps in response to the collision of the Arabian continental protuberance, is accommodated by the earthquake-generating faults in Turkey. This lateral motion may play a major part in the collision that is closing the Mediterranean. For example, over the past 25-million-years west-to-east movement of most of the Italian peninsula has pushed up the Apennine and Dalmatian mountains and, in its wake, has opened a small basin now filled by the Tyrrhenian Sea.
Perhaps the most distinctive feature of the collision of Arabia with Asia, in the sector of the Alpine-Himalayan belt immediately east of the Mediterranean, is the role it has played in forming the enormous accumulation of oil and gas in Saudi Arabia, the Gulf states, Kuwait, Iran, Iraq, Syria, and Turkey. This remarkable resource accumulation has depended on the association of the collision along with a number of other special circumstances; these are considered in Chapter 4, Resources of the Solid-Earth. As a first approximation, oil generated on the old continental margin that was the northern edge of Arabia appears to have been driven up-slope at the collision by shortening in front of the collisional Zagros Mountains.
The collision between India and Asia represents the most advanced stage of continental collision on Earth at this time. Phenomena associated with this collision include elevation of the highest mountains, the Himalaya; formation of the world's largest sedimentary body, the Bengal fan; and generation of violent earthquakes, including the most deadly earthquake in recent decades at Tangshan, near Beijing, China. The collisional zone in Pakistan and India has yielded far less oil and gas accumulations than that in Arabia. This is, at least in part, because the Indian continental margin formed at high latitudes where the accumulation of organic material was less abundant.
The study of continental convergence between Eurasia and fragments of Gondwana serves to unite scientists as well as science. Researchers from India, Nepal, Pakistan, the Commonwealth of Independent States, China, and the countries of Southeast Asia, in cooperation with each other and with solid-earth scientists from Europe, Australasia, and North America, are suggesting solutions to questions concerning the ongoing collision. They conclude that India is dipping under Asia, but how fast and by how much are unknown. Recent investigations considering earthquake mechanisms and Landsat imagery propose that China is bulging eastward into the Pacific to escape the squeeze of the collision. And innovative interpretations speculate that the Tibetan Plateau, unable to escape the squeeze, has reached a limit of thickness and is now beginning to collapse.
The Himalayan/Tibetan area stands 5,000 meters above sea level over an area of more than 1,000,000 km2, which is as large as the lower-standing mountainous area of western North America. Researchers propose that this mass of continental crust has become detached from its underlying lithospheric mantle, which has foundered into the convecting mantle layer. If recycling of continental crustal material and its roots is indeed happening on such a grand scale beneath the Himalaya, the Alps, and perhaps the American cordillera, current ideas about continental crustal growth and processes of recycling should be reexamined.
The extreme elevation of Tibet has affected atmospheric circulation over much of Asia, perhaps influencing not only the development of the Asian monsoon but also the formation of the Sahara and even the onset of Northern Hemisphere glaciations. The extensive high ground in western North America may have played a similar role, but other tectonic events, such as the closing of the Panama Isthmus and the Zagros Ocean, have modified oceanic circulation and may have been more significant. Both kinds of major barriers to warm equatorial circulation would have generated profound climatic and environmental changes within the past 15-million-years. Recognition of tectonic influences on the evolution of the Earth's climate demonstrates the potential for intellectual breakthroughs resulting from the study of the earth system.
Continental collision is a major research interest in the solid-earth sciences. Although most attention focuses on the active Alpine/Himalayan belt, older collisions, especially those recorded in the ancient Precambrian rocks, yield complementary information. Rocks from high-temperature and high-pressure environments buried deep within the modern mountain chains are preserved and well exposed for study at the surface in the old belts. Traditionally, these provocative exposures provide both information and inspiration to earth scientists.
Growth of the Continents Through Time
Much research remains to be undertaken to test and modify the simple picture of continents assembled by the process of arc collision and modified by the cordilleran, continental collisional, impact, hotspot, rifting, flooding, and erosional processes. Establishment of the history of the continents through time will provide an important test of how they have evolved.
Additions to the continental crust are known to have occurred throughout recorded geological time, from about 4-billion-years ago to the present. With the average age of continental surface rocks around 2-billion-years, and with a wide variety of ages spanning most of recorded time, it seems possible that the continental crust has grown in volume through the history of the Earth. However, the details of this growth are still uncertain, and determination of a crustal volume versus age curve is of considerable importance for understanding the Earth's evolution. There is geological and geochemical evidence suggestive of periods of enhanced crustal growth, although this picture may be clouded by the geographically patchy distribution of the data. Large volumes of continental crust give isotopic signatures indicating that the material from which they formed became fractionated from the mantle (by the processes of partial melting that take place at divergent plate boundaries and beneath volcanic arcs) relatively recently. For example, much of the crystalline basement of Arabia, Egypt, and eastern Sudan formed from the mantle some 600 million to 900-million-years ago. Estimates of the present-day rate of crustal addition in island arcs fall short of the rate of average growth of the continents (about 2 km3/year, a figure obtained by dividing the present volume of the continents by the age of the Earth). If island arc addition has been the main way of making continents, rates must have been far higher in the past.
We have a clear picture of the present distribution of continental material today in the large bodies of Eurasia, Africa, North and South America, Australia, and Antarctica and in smaller objects like Greenland, New Zealand, Madagascar, Japan, and the Seychelles. The motions of these fragments over the past 200-million-years since Pangea began to break up are reasonably well known from the history of the intervening ocean basins. Some idea of how continental fragments were assembled into Pangea, between the assembly of Gondwanaland about 600-million-years ago and its final collision with Laurasia about 290-million-years ago, has also emerged, but no clear picture has yet been obtained of how continental material was distributed about the surface in earlier times. Ancient latitudinal indicators for these older times have provided a confused picture.
Determining when and how all the pieces of all the continents were formed and how they came to be in their present positions is proving a substantial research exercise. It looks as though the greater part of North America was assembled into one piece by 1.7-billion-years ago, but Asia is a continent put together only within the past 600-million-years. We do not yet know whether these temporal and geographic differences record stochastic operation of plate tectonic processes or whether they reflect systematic changes in the Earth's behavior in space and time.
The central part of North America—with perhaps 75 percent of the present continental area—was put together long ago. Establishing a subsequent history dominated by the peripheral addition of relatively small exotic blocks and fragments is an active research frontier. Questions such as where the blocks came from and how they were incorporated into North America are rendered more challenging
by the violent changes wrought on these objects at and after collision. Only the western side of North America has wholly escaped episodes of collision by major continents over the past billion years. These huge collisions and subsequent ruptures have made the story even harder to unravel in such areas as the Canadian Arctic, the Appalachians, and the Ouachitas.
One intriguing idea is that the cycles of ocean opening and closing that have operated throughout earth history have caused the continents to have episodically come together to form a huge single landmass. After a few hundred-million-years, these supercontinents have been torn apart into fragments that drifted away from each other, much as the modern continents were dispersed from Pangea. One hypothesis for why this occurs is that the cold thick continental fragments are pushed away from areas of active upwelling of the underlying mantle, much as the skin on a pan of heated milk moves away from violently boiling areas. Eventually, this retreat from hot mantle brings the continental fragments together where they collide and weld again. At a certain size, however, the thick continent hinders heat transport out of the mantle that underlies it. Eventually, the underlying mantle heats up to a point at which it forms uprising plumes, which, if of sufficient size, break through the overlying continent. If continued, this plume activity evolves into a general upwelling of the mantle, which again causes the breakup of the supercontinent and the formation of an ocean basin.
Determining long-term feedback relations between the elements of mantle convection, including plate formation and subduction as well as mantle plumes, and the elements of surface geology, including sea level change, continental assemblies, and continental rupture, is a major interdisciplinary challenge. Regional geology, mantle geophysics, and geochemistry need to be used together in a new way. The identification of cold regions in the mantle, interpreted as subducted slabs over 100-million-years old, marks an important step in this new direction.
GEOCHEMICAL CYCLES
Only some 20 to 25 years ago was it realized that surface materials could be returned to the Earth's interior through the process of plate subduction. The importance of recycled crustal materials in modifying mantle composition has been revealed only in the past 5 to 10 years. The consequences of crustal recycling and the involvement of crustal material in mantle convection are still being worked out (Figure 2.15). The crustal material includes water, carbon dioxide, and elements that are significant in the biogeochemical cycles occurring at and near the surface, and the interchange between biogeochemical cycles and the deep interior needs to be established. Cycling of material from the reservoirs of the deep interior through the Earth's surface systems typically occurs on time scales ranging from tens of millions to billions of years, but cycles in the near-surface systems driven by solar energy can be as short as a year or as long as hundreds of millions of years. Interchanges have to be recognized as happening on a large range of time scales. With realization of the significance of the interchange, it has become clear that the Earth as a whole—its interior, crust, oceans, and atmosphere—all interact through chemical cycling. To understand the characteristics of one reservoir, the nature of the exchange with the other components of the earth system must be understood and taken into account. The near-surface cycles are dealt with in Chapters 3 and 4. Here, emphasis is on geochemical cycles in the mantle and crust with reference to their connections with the hydrosphere and atmosphere.
Extraction of the continents from the mantle has left an identifiable chemical imprint on the interior, causing the mantle, as sampled by the basalts erupted along the worldwide ocean ridge system, to be depleted of the same elements as those by which the continental crust is enriched. Isotopic data for oceanic basalts erupted throughout earth history show that the composition of their mantle source was modified early in earth history. The original modification could have been caused by the extraction of continental crust prior to 4.0-billion-years ago. Significant volumes of continental crust of this age, however, are not preserved. If the early chemical differentiation of the mantle was caused instead by removal of a crust more like oceanic than continental crust, it is possible that this ancient crust was subducted into the mantle and is no longer visible at the surface. An additional increment of chemical modification of the mantle would then have occurred when the majority of continental crust was formed, roughly 2.5 billion to 3-billion-years ago. This second step in chemical differentiation of the mantle, in fact, is observed in the isotopic record of mantle-derived rocks and crustal sediments.
One of the major recent achievements of mantle geochemistry has been the identification of recycled surface materials as an intrinsic part of the mantle. The first major consequence of crustal cycling is its
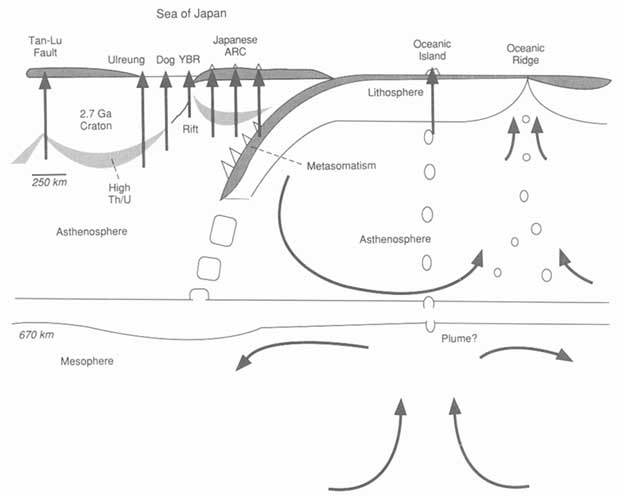
FIGURE 2.15 Schematic diagram illustrating plate recycling.
instigation of volcanism landward of subduction zones. Arc volcanic rocks display a chemical signature best explained by the contributions of subducted oceanic sediments and altered oceanic crust to their source regions in the mantle. The recent discovery of an isotope of beryllium in arc volcanoes, but in no other volcanic system on Earth, provides clear evidence that even the upper few meters of sediment on the ocean floor are transported to a depth of at least 150 km in subduction zones, the depths at which the processes of dehydration and perhaps partial melting initiate the generation of arc magmas. There is a direct link with cycles in the atmosphere and hydrosphere. The radioactive isotope, 10Be, is transferred from the upper atmosphere by rain and becomes concentrated in ocean sediments. The fact that it decays relatively rapidly places constraints on the time interval between raining from the atmosphere, subduction in sediments, and emergence at the surface in volcanic lavas.
A distinctive feature of arc lavas is their relatively high water content, which is largely derived from the rocks of the subducted oceanic plate. The combination of experimental-phase equilibrium studies on source rocks and lavas with geophysical modeling of temperatures at depth confirms that most of the subducted water is removed by dehydration or melting by a depth of 150 km or so, whence it returns to the surface for involvement in the shallow cycles. However, under some conditions there is opportunity for small amounts of water to escape the magmatic processes and to be transported to greater depths for long-term storage within the mantle. Recent theoretical and experimental studies at very high pressures have led to proposals that the lower mantle, deeper than 700 km, may contain water in significant quantities: at least 0.3 percent by
weight, the equivalent of about two masses of ocean water. The recent synthesis of iron hydride at high pressures corresponding to conditions within the Earth's core has raised the question of how much hydrogen and oxygen may be present within the core. Thus, water may be involved in earth processes all the way from the core to the atmosphere.
Another example of the depth of penetration of subducted material is provided by diamonds. Diamonds crystallize only at depths greater than about 150 km in the mantle. A significant fraction of diamonds have distinct carbon isotopic compositions, like that found for organic carbon-rich sediments at the surface. Thus, some diamonds may once have been living matter at the surface that was subducted with an oceanic plate to depths where the elevated pressure and temperature turned the dispersed carbon into diamond.
Small, but observable, heterogeneities in the chemical and isotopic composition of the mantle have been documented by detailed studies of the basalts erupted in the ocean basins. The important feature of this heterogeneity is that it appears to reflect mixing between a depleted residual mantle, formed by extraction of continental and oceanic crust, and two to three other more "enriched" components. Two of the enriched components are believed to be basaltic ocean crust and continentally derived sediments. These materials are injected into the mantle in subduction zones; are carried along by the general mantle circulation, during which time they partially mix with surrounding mantle; and eventually return to the surface beneath ocean ridges and in mantle plumes. Estimates of the time necessary to travel from subduction zone to ridge are on the order of 1.7-billion-years.
The complete implications of this process represent an area of active research that links geochemical and seismic observations of the mantle with theoretical treatments of the nature of mantle convection and the efficiency with which convective "stirring" can rehomogenize the injected components. What was once viewed as a one-way transfer of material from the mantle to the crust must now be seen as a continuation of global geochemical cycles, in this case including all of the planet. The ability to recycle surface components back into the mantle may be responsible for keeping the Earth's interior unexpectedly close to its original composition. Recycling of crust may be unique to the Earth as a consequence of its active plate tectonic system and may explain its continuing vigor.
Some of the key questions in chemical geodynamics or deep geochemical cycling include:
-
What is the mass balance of the cycling? Has all of Earth's interior once been at the surface, or is some material reaching the surface for the first time?
-
Can the age and geographical distribution of returning recycled oceanic crust be used to trace flow patterns and velocities in the mantle and provide clues for the locations of past subduction?
-
What is the balance of fluid transport? Are the oceans growing with time, or is water being subducted into the mantle faster than it is emitted at ocean ridges? What fraction of the water in arc volcanism is from the mantle, and what fraction is recycled from the oceans?
-
Is subduction responsible for continent formation? Are an active plate tectonic system and a liquid ocean necessary prerequisites for the development of Earth-like continents on a planet?
-
How has recycling of chemically differentiated material from the Earth's surface affected the composition of the mantle? Is the Earth still an active planet because its attempts at internal chemical differentiation were reversed by the rehomogenization accompanying recycling and convective mixing?
Key areas for understanding deep geochemical cycles, and their connections with the near-surface biogeochemical cycles, are the two tectonic environments where most material enters the interior and where most material emerges from the interior: subduction zones and oceanic ridges. Detailed multidisciplinary investigations of the fluxes of energy and matter in these and related environments (e.g., continental rifts) are of fundamental importance.
Major parts of the biogeochemical cycles involve material transferred relatively rapidly in and out of the biosphere and material transferred between rocks and the fluid envelopes during weathering processes.
INTERACTION BETWEEN THE SOLID EARTH AND ITS FLUID ENVELOPES
The surface water of the Earth and to a lesser extent the atmosphere play a critical part in the recycling of material that is one of the planet's most distinctive features. The outer layer of solid-Earth is in contact with the fluid envelopes of the hydro-
sphere and the atmosphere. Seventy-one percent of the solid surface is innundated by ocean water, and the remaining 29 percent, the continental surface, is flushed by water at intervals with a frequency governed by climatic zone. The crust can be thought of as a catalytic bed of minerals and fluids of great diversity consisting of several trillion square kilometers of surface area. Most of this surface consists of the interface between minerals and water. The reactions that occur at these interfaces, some of which are catalytic in nature, directly affect the planet we live on and the way we live. They play critical roles in determining the quality of our fresh water supply, the development of soils and the distribution of plant nutrients within them, the genesis of certain types of ore and hydrocarbon deposits, and the geochemical cycling of elements.
Mineral-water interface geochemistry is not a new field. For example, observations relevant to silicate mineral dissolution were made more than 150 years ago. However, it was not until the past 10 or 20 years that the instrumental means were developed to directly study mineral surfaces and the reactions that occur at mineral-water interfaces at the molecular level. Much of the technology needed has been provided by developments in the field of surface science, which has traditionally been in the domains of chemistry (heterogeneous catalysis, electrochemistry) and applied physics (semiconductors and integrated circuits). The transfer of this technology by geochemists is relatively recent (within the past few years), but it is already leading to new fundamental knowledge about how minerals dissolve and undergo reduction or oxidation, how chemical species partition from fluids to mineral surfaces, and how the hydrosphere interacts with crustal rocks.
An immediate application of this knowledge to a problem of societal relevance is the development of more robust and accurate models for predicting the transport of contaminants in groundwater. Certain contaminants can be strongly chemisorbed on mineral surfaces under certain conditions, thus removing them from the fluid phase. However, we must understand the molecular-level mechanisms for such reactions to model them properly; incorrect assumptions about the stoichiometry of sorption reactions can lead to errors of several orders of magnitude in predictions of the partitioning behavior of chemical species. Errors of this magnitude simply cannot be tolerated in predicting how a contaminant plume disperses.
Although the field of interface geochemistry is in its infancy, it is already leading to changes in the way we think about many geochemical and mineralogical processes. Continuing studies in this rapidly growing field will undoubtedly lead to a more fundamental understanding of the chemistry and physics of mineral-water interfacial phenomena and how chemical species are partitioned between minerals and aqueous fluids in the crust.
RESEARCH OPPORTUNITIES
The Research Framework (Table 2.1) summarizes the research opportunities identified in this chapter and in the relevant panel reports, with reference also to other disciplinary reports and recommendations. These topics, representing significant selection and thus prioritization from a large array of research projects, are described briefly in the following section. Processes operating near the surface are, for the most part, reserved for Chapter 3, although there is no sharp boundary between the deep-seated processes and surficial geology.
The research areas are interrelated. There is continuity between the processes occurring at the core-mantle boundary, mantle convection, the physical deformation of the lithosphere and mountain building in the crust, and the geochemical transfer of material from mantle to crust. In the crust the material is exposed to physical and chemical interaction with the atmosphere, the oceans, and the hydrosphere, which transgresses the two fluid envelopes and the crust. Research opportunities arise when methods are developed to explore new regions, such as the inaccessible ocean floor, continental lower crust, and the even more inaccessible deep interior.
Research Area II: Global Geochemical and Biogeochemical Cycles
Evolution of the Crust and Its Relationship to the Mantle
Examination of the Earth's crust through the use of isotopes, trace elements, and rare gases continues to be a fundamental frontier topic. Study of the growth rates of the continents can provide a long-term view of the Earth's evolution, and these rates should be investigated by a concerted effort that couples detailed field studies with high-precision geochronology and isotopic studies to determine mantle separation ages for different continental terrains. Within the continental rocks lies an historical record of mantle convection, changes in
TABLE 2.1 Research Opportunities
|
|
Objectives |
|||
|
Research Areas |
A. Understand Processes |
B |
C |
D |
|
I. |
|
|
|
|
|
II. Geochemical and Biogeochemical Cycles |
■ Evolution of the crust and its relationship to the mantle ■ Fluxes along the global rift system ■ Fluxes at convergent plate margins ■ Mathematical modeling in geochemistry |
|
|
|
|
III. Fluids in and on the Earth |
■ Mineral-water interface geochemistry ■ Role of pore fluids in active tectonic processes ■ Magma generation and migration |
|
|
|
|
IV. Dynamics of the Crust and Lithosphere |
■ Oceanic lithosphere generation and accretion ■ Architecture and history of continental rift valleys ■ Sedimentary basins and continental margins ■ Continental-scale modeling ■ Recrystallization and metasomatism of the lithospheric mantle and lower crustal metamorphism ■ Thermal structure, physical nature, and thickness of the continental crust ■ The lithosphere at convergent plate boundaries ■ Tectonic and metamorphic history of mountain ranges ■ Quantitative understanding of earthquake rupture ■ Rates of recent geological processes ■ Real-time plate movements and near-surface deformations ■ Geological predictions ■ Modern geological maps |
|
|
|
|
V. Dynamics of the Core and Mantle |
■ Origin of the magnetic field ■ Core-mantle boundary ■ Imaging the Earth's interior ■ Experimental determination of phase equilibria and the physical properties of Earth ■ Chemical geodynamics ■ Geodynamic modeling |
|
|
|
|
|
Facilities - Equipment - Data Bases |
|
|
|
|
|
■ Remote sensing of the continental unit from satellites ■ Global digital seismic array, with broadband instruments ■ Portable seismic arrays ■ Ion microprobes ■ Accelerator mass spectrometers ■ Ultrahigh pressure temperature instrumentation ■ Microscale, in situ analytical instrumentation ■ Synchrotron radiation facilities ■ Ocean-bottom seismometers and other geophysical instruments ■ Instruments for micromagnetic measurements ■ Deep continental drilling ■ Parallel-processing computers ■ Data storage and distribution facilities |
|||
crustal growth and destruction by recycling, temporal variations in the temperatures in the interior, variability in the nature of the plate tectonic process, and the compositional evolution of the mantle.
Fluxes Along the Global Rift System
The rift system transports energy and material from the interior to the lithosphere, hydrosphere, and biosphere. An important goal of research in
this area is understanding the geophysical, geochemical, and geobiological causes and consequences of this transport. The flow of mantle material, the generation of melt, its emplacement along spreading centers, and its transformation into crystalline oceanic crust are primary problems. Aspects relevant to magmas at hot-spots beneath oceans and continents are a significant related concern.
Fluxes at Convergent Plate Margins
Convergent plate boundaries are the sites of material transport from the surface to its interior. It is necessary to determine the relevant mass and heat fluxes, treating the generation and flow of vapors and melts as part of a dynamical system.
Mathematical Modeling in Geochemistry
Practically all theoretical treatments of geochemical cycles use overly simple models, with each box representing a chemically homogeneous reservoir and the transfer of material being represented by fluxes between boxes. Intense efforts are required to improve theoretical modeling. There is an urgent need to determine the connections between the relatively near-surface short-term biogeochemical cycles covered in Chapter 3 and the longer-term geochemical cycles extending deep into the Earth's mantle.
Research Area III: Fluids in and on the Earth
Mineral-Water Interface Geochemistry
This rapidly growing field uses technology transferred from the domains of surface chemistry and physics (catalysis and semiconductors). Continuing studies in this field will lead to a more fundamental understanding of the chemistry and physics of mineral-water interfacial phenomena, how chemical species are partitioned between minerals and aqueous fluids, and how the hydrosphere interacts with crustal rocks.
Role of Pore Fluids in Active Tectonic Processes
The fluid state may be most important in understanding the mechanics of deformation, including earthquakes, and insight can be gained from laboratory experiments of rock fracture and rock friction with fluids present. A program of continental drilling would greatly add to our empirical knowledge concerning pore fluids.
Magma Generation and Migration
Magma generation and migration are fundamental processes. Their analysis needs the coupling of phase equilibria and trace element partitioning data to fluid dynamical equations, with deformable solid matrices. Magma study provides research opportunities ranging from the thermodynamics and geochemistry of rocks in the molten state, through their role in chemical differentiation of the Earth, to their manner of emplacement in and on the crust. The physical processes associated with upward migration of the magma and the mechanisms of eruption are only partially understood. The transition from micro- to macropermeability is relevant. Magma-driven fractures are also likely to play an important role. Fractures are amenable to being characterized as fractal, and fracture geometrics is a promising area of active research.
Research Area IV: Dynamics of the Crust and Lithosphere
Oceanic Lithosphere Generation and Accretion
Continued interdisciplinary studies of ocean ridges, with their associated magmatic processes and interaction with the hydrosphere, promise excellent scientific returns. The global correlation of ocean ridge basalt geochemistry with axial depth and crustal thickness resulting from temperature variation in the mantle is an example of recent interdisciplinary successes. Patching together diverse results from three decades of geophysical surveys and geochemical analyses has led to the formulation of a model for the detailed structural and magmatic segmentation of mid-ocean ridge spreading centers.
Architecture and History of Continental Rift Valleys
Better comprehension of continental separation and the formation of continental margins, where natural resources are commonly concentrated is needed. There has been a revolution in our understanding of extensional tectonics with the discovery of basement-penetrating normal fault systems. Determination of the rheology of the lithosphere requires deep seismic profiling and laboratory experiments on rock strength. Isotope and trace element
analysis of rift valley magmas and xenoliths will test rift models deduced from independent data sets.
Sedimentary Basins and Continental Margins
Gravity data for many sedimentary basins, including both foreland and cratonic basins, indicates the presence of buried loads. The origin of these loads and their relation to thermal subsidence remain unexplained challenges. We need a better way of estimating the original masses of ancient sediments. Also, to improve modeling we need a much better inventory of sediments beneath present-day continental margins.
Continental-Scale Modeling
This area of computational tectonophysics has great potential. Its benefits would include the testing of qualitative hypotheses for orogenies, the discovery of new orogenic mechanisms (e.g., delamination, Moho buckling), and in situ determinations of the rheology of the lithosphere. Dynamical systems approaches (fractals, chaos) offer much promise for attacking major unsolved problems in crustal dynamics.
Recrystallization and Metasomatism of the Lithospheric Mantle and Lower Crustal Metamorphism
Intensive study should integrate the full complement of isotopic and trace element tools integrated with field work, geophysics, the study of deep crustal/upper mantle xenoliths—''meteorites from the mantle"—and the calibrations of experimental petrology, in terms of depth, temperature, and fluid compositions.
Thermal Structure, Physical Nature, and Thickness of the Continental Crust
These are key variables governing the state of stress and attenuation of seismic energy in the crust. Study of the ancient crust may help to establish the history of the thermal structure of the Earth. A fundamental area of research in active tectonics is the source, distribution, and propagation of the energy that drives tectonic changes. Heat flow studies, in situ stress measurements, and measurements of strain are among the elements in need of study. The opportunities range from field measurement of these elements to theoretical modeling of how they interact.
The Lithosphere at Convergent Plate Boundaries
Multidisciplinary studies of this environment are essential for understanding mantle dynamics and geochemistry as well as the chemical differentiation of the Earth.
Tectonic and Metamorphic History of Mountain Ranges
A new dimension, time, has recently been added to the depth-temperature framework provided by experimental petrology. Isotopic analyses yield ages for different stages of mineral growth, and another approach to "time" involves geophysical calculations on the thermal history of rocks.
Quantitative Understanding of Earthquake Rupture
The physical processes applicable to earthquake rupture can be approached by integrated seismological, geophysical, and geological studies of earthquakes and the faults on which they occur. Direct measurement of stress by drilling techniques for accessible faults is now feasible. Improvements in three-dimensional imaging capabilities are needed to map subsurface faults that are often nonplanar.
Rates of Recent Geological Processes
New insights into the rates at which processes take place can be expected, especially for those occurring over the less-than-1-million-year time scale. New and improved techniques for dating materials and events offer rewarding opportunities. There should be extensive dating of Quaternary landforms and sediments.
Real-Time Plate Movements and Near-Surface Deformations
The Global Positioning System (GPS), which is rapidly evolving into a powerful tool, is used to monitor these motions. Geodetic techniques, based on land and in space, provide some of the best direct evidence about short-term changes in the crust.
Geological Predictions
The revolutionary field of geological prediction in geological evolution within 1-million-year time frames requires increasing emphasis on surficial geology and neotectonics. The documentation and
understanding of rapid geological processes are an entirely new dimension for earth scientists to explore, with computers now making it possible.
Modern Geological Maps
Maps constitute an important data base in the solid-earth sciences. Field relations must be continually reexamined in the light of new theoretical concepts, and no substitute exists for continuing geological mapping and analysis of relations in the field. Maps should include three-dimensional data on geophysics and geochemistry and data from satellite-based remote sensing. Digitizing the different data sets that are to be used together is essential.
Research Area V: Dynamics of the Core and Mantle
Origin of the Magnetic Field
Magnetic field generation is one of the universal processes in the cosmos, and the outstanding unsolved geophysical problem involving the core is generation of the geomagnetic field. Important advances in the near future will concentrate on more limited problems such as (a) the origin of the dipole inclination, secular variation, and the westward drift; (b) the role of the mantle in influencing magnetic field structure; and (c) a determination of the power source driving the dynamo.
Core-Mantle Boundary
With the deployment of a new broadband digital network of seismometers, the likelihood of deciphering the nature of the core-mantle boundary is excellent. There is the prospect that geomagnetic anomalies can be associated with seismological heterogeneities found at the base of the mantle, leading to the possibility of documenting changes in the core-mantle boundary through the geological past.
Imaging the Earth's Interior
The new digital recording seismometers with broad wavelength sensitivity and large dynamic range include both portable varieties and permanent stations that will be applicable to global studies. The three-dimensional distribution of velocity anomalies in the mantle obtained through these data can then be used to infer relative temperatures and compositions within the mantle.
Experimental Determinations of Phase Equilibria and the Physical Properties of Earth Materials at High Pressure and Temperature
New high-pressure apparatus extends the range of experimentation. Properties of materials (e.g., density, seismic velocity, melting temperature) can be measured in situ using, for example, high-intensity x-rays produced by synchrotron sources. Comparison of the high-resolution seismic images of the interior with direct experimental determinations of the physical properties of earth materials at high-pressure and temperature will advance the understanding of the interior's temperature and compositional structure to an unprecedented degree. This can yield better insight into how the high-temperatures drive internal motions that in turn determine the geological history of the Earth's surface.
Chemical Geodynamics
The combination of geochemistry and geophysics continues to reveal the scale of heterogeneities within the mantle. Isotopic variations in mantle-derived rocks provide time-dependent information about the creation of mantle heterogeneities by partial melting or lithosphere subduction and about the efficiency of convection in remixing the mantle components. The nature and source of the mantle plumes responsible for generation of at least some volcanic hot-spots remain a tantalizing problem, one that may link phenomena at the core-mantle boundary to massive volcanic eruptions.
Geodynamic Modeling
The recent success in quantitatively relating geoid anomalies and the results of seismic tomography, at least on scales of thousands of kilometers, prompts similar investigations over smaller distances. The amount of material transported across the entire mantle by convection is currently the single largest uncertainty in our understanding of the Earth's thermal and geological evolution. This transport is part of the major geochemical cycles of the Earth.
FACILITIES, EQUIPMENT, AND DATA BASES
The earth sciences offer special opportunities for the development and application of new technologies, as exemplified by the instrumentation that has recently been created for use in the field and in the
laboratory. Technological developments in the earth sciences are at the forefront of research.
The emphasis in geochemical instrumentation continues to be on attaining higher spatial resolution while maintaining high sensitivity and accuracy in isotopic and trace element analyses. One of the greatest needs in the field of isotope geochronology is to bring more ion microprobe instruments into operation. New generations of instrumentation include the super high-resolution ion microprobe (SHRIMP) and the x-ray microprobe.
For cosmogenic nuclide geochronology the major goal is a better understanding of variations in production rates. Accelerator mass spectrometer measurements are especially well suited to studies of the interrelationships among the solid-earth, the atmosphere, and the hydrosphere.
The development of new ultra-high-pressure/ temperature instrumentation for simulating the deep interior remains a major goal. This high-pressure research requires additional development of techniques for microscale in situ analysis of small samples or of physical properties (e.g., elastic constants).
Continued access to synchrotron radiation facilities is important for precise crystallographic information as well as compositional data.
Ocean bottom deployment of geophysical instruments is an area generally in need of technological development. Until this becomes routine, achieving global coverage from satellite measurements will continue to be a major problem.
High-sensitivity, high-spatial-resolution analytical techniques are in demand for carrying out micromagnetic measurements on minerals and rocks as functions of temperature and field.
The increasing availability of massive computational capabilities provides opportunities for attacking complex problems. Parallel-processing computers hold much promise for a wide variety of simulations in the earth sciences. Less powerful special-task computers are seeing increasing applications in the field and the laboratory. There is an urgent need to improve the capabilities for communications and storage of data. Networking between computers will be necessary, particularly for large-scale data transfer and high-speed interactive computing.
BIBLIOGRAPHY
National Research Council Reports
NRC (1980). Studies in Geophysics: Continental Tectonics, Geophysics Study Committee, Board on Earth Sciences and Resources, National Research Council, National Academy Press, Washington, D.C., 197 pp.
NRC (1982). Studies in Geophysics: Climate in Earth History, Geophysics Study Committee, Geophysics Research Board, National Research Council, National Academy Press, Washington, D.C., 198 pp.
NRC (1983). Opportunities for Research in the Geological Sciences, Committee on Opportunities for Research in the Geological Sciences, Board on Earth Sciences, National Research Council, National Academy Press, Washington, D.C., 95 PP.
NRC (1983). The Lithosphere: Report of a Workshop, U.S. Geodynamics Committee, Board on Earth Sciences, National Research Council, National Academy Press , Washington, D.C., 84 pp.
NRC (1984). Studies in Geophysics: Explosive Volcanism: Inception, Evolution, and Hazards, Geophysics Study Committee, National Research Council, National Academy Press, Washington, D.C., 176 pp.
NRC (1986). Studies in Geophysics—Active Tectonics, Geophysics Study Committee, Board on Earth Sciences and Resources, National Research Council, National Academy Press, Washington, D.C., 266 pp.
NRC (1987). Earth Materials Research: Report of a Workshop on Physics and Chemistry of Earth Materials, Committee on Physics and Chemistry of Earth Materials, Board on Earth Sciences, National Research Council, National Academy Press, Washington, D.C., 122 pp.
NRC (1987). Geologic Mapping in the U.S. Geological Survey, Committee Advisory to the U.S. Geological Survey, Board on Earth Sciences, National Research Council, National Academy Press, Washington, D.C., 22 pp.
NRC (1988). The Mid-Oceanic Ridge: A Dynamic Global System, Ocean Studies Board, National Research Council, National Academy Press, Washington, D.C., 351 pp.
NRC (1989). Margins: A Research Initiative for Interdisciplinary Studies of Processes Attending Lithospheric Extension and Convergence , Ocean Studies Board, National Research Council, National Academy Press, Washington, D.C., 285 pp.
NRC (1990). Studies in Geophysics: The Role of Fluids in Crustal Processes, Geophysics Study Committee, Board on Earth Sciences and Resources, National Research Council, National Academy Press, Washington, D.C., 170 pp.
NRC (1990). Studies in Geophysics: Sea Level Change, Geophysics Study Committee, Board on Earth Sciences and Resources, National Research Council, National Academy Press, Washington, D.C., 234 pp.
NRC (1991). International Global Network of Fiducial Stations: Scientific and Implementation Issues, Committee on Geodesy, Board on Earth Sciences and Resources, National Research Council, National Academy Press, Washington, D.C., 129 pp.
NRC (1991). Opportunities in the Hydrologic Sciences, Water Science and Technology Board, National Academy Press, Washington, D.C., 348 pp.
Other Reports
Basaltic Volcanism Study Project (1981). Basaltic Volcanism on the Terrestrial Planets, Pergamon Press, Inc., New York, 1,286 pp.
Interagency Coordinating Group for Continental Scientific Drilling (1988). The Role of Continental Scientific Drilling in Modern Earth Sciences Scientific Rationale and Plan for the 1990's, 151 pp.
Interagency Coordinating Group for Continental Scientific Drilling (1991). The United States Continental Scientific Drill
ing Program, Third Annual Report to Congress, 35 pp. + appendices.
Inter-Union Commission of the Lithosphere (1990). International Lithosphere Program, International Council of Scientific Unions, 119 pp.
NASA (1991). Solid-Earth Science in the 1990s, Vol. 1. Program Plan, NASA Office of Space Science and Applications, Washington, D.C., 61 pp.
USGS (1987). Volcanism in Hawaii, U.S. Geological Survey Professional Paper 1350, R. W. Decker, T. L. Wright, and P. H. Stauffer, eds., U.S. Government Printing Office, Washington, D.C., 1,667 pp.
USGS (1990). The San Andreas Fault System, California, U.S. Geological Survey Professional Paper 1515, R. E. Wallace, ed., U.S. Government Printing Office, Washington, D.C., 283 pp.


