
9
Particle Fluxes in the Ocean and Implications for Sources and Preservation of Ocean Sediments
JACK DYMOND
Oregon State University
MITCHELL LYLE
Lamont-Doherty Earth Observatory
ABSTRACT
Measurements of the settling particle flux throughout the water column enable estimates of the rain and recycling of elements and biogenic compounds within the oceans. On 10 of 11 open-ocean sites the rain rate and burial rates of refractory elements (Al, Fe, and Ti) are approximately equal. Poor agreement between rain and burial of refractory elements at the Hatteras Abyssal Plain may be due to deep lateral inputs of particulate debris to the site. The balance between rain and burial of refractory elements suggests similar comparisons for the labile components should provide accurate estimates of their extent of recycling. The degree of preservation of organic matter, opal, and carbonate computed from the rain/burial comparison is highly variable at the different oceanographic settings. The percentage of organic carbon varies from less than 1 percent at a low productivity mid-ocean site to approximately 30 percent in a site adjacent to the continental slope. The preservation correlates with the accumulation rate of the sediments. Opal preservation varies in a similar manner; however, the degree of preservation appears to correlate with the opal rain rate. Carbonate preservation correlates most strongly with water depth and possibly to the ratio of organic carbon to carbonate in the raining particles.
Strong offshore decrease in carbon rain rate and preservation demonstrate the importance of the continental margin as a region of enhanced organic carbon burial. These effects produce a factor of 60 change in carbon burial rate over a 600 km offshore transect in the North East Pacific. Some transport of particles to the deep basins appears to take place by a sediment focusing processes whereby multiple resuspension events move material laterally and down slope from the continental shelf and slope.
Eolian inputs can be inferred from particle fluxes at sites distant from the continental margins. These studies demonstrate that the Equatorial Pacific, which is under the influence of Trade winds, has relatively low fluxes. Measurements from the Nares Abyssal Plain in the Atlantic, however, indicate that this site is receiving important inputs of aluminosilicate debris from African deserts.
INTRODUCTION
Measurements of settling particle flux not only clarify a variety of oceanic biogeochemical processes but also aid the interpretation of the sedimentary record. Particle settling is the primary mechanism for transferring dissolved and suspended materials from the water column to the sediments; however, scavenging and recycling alters the flux and composition of raining particles. Consequently, the burial rates of elements and compounds generally do not equal the particulate rain rate.
A major focus of this paper will be the comparison between the burial rate of materials that form the sediment record and the rain rate of particles that settle through the water column. From this comparison we can determine the rate of recycling or benthic flux of materials that settle to the seafloor. In effect, the benthic flux is the exchange rate of solutes between the sediment and the overlying water column. This exchange transforms raining particulate material into the sedimentary record. In its simplest form the benthic equation is:
Rain rate of any particulate component = Burial rate of that component + Benthic flux
The rain rate is the particulate flux that reaches the bottom for any component, and the burial rate is the preservation rate of that component in the sediment.
The direct measurement of particle flux has followed important developments in marine technology. Deployment and recovery of deep ocean moorings, which position particle collectors throughout the water column, are now routine. A variety of these particle collectors (commonly called sediment traps) are in current use (Soutar et al., 1977; Blomqvist and Hakanson, 1981; Dymond et al., 1981; Gardner, 1980; Honjo and Doherty, 1988). Most are cylinders or funnels in which particles enter through a baffle at the top and settle into a sample cup where a bactericide is maintained at a concentration capable of inhibiting decomposition of the sample. Many designs have timer-controlled sample changers that can collect a time series of settling particles over preset intervals.
Sediment traps work as collectors of settling particles because large, rapidly settling forms dominate the particle flux in the oceans (McCave, 1975). A number of recent studies have shown that these large particles are either amorphous aggregates of smaller particles commonly called marine snow (Alldredge and Silver, 1988) or zooplankton fecal pellets ((Urrere and Knauer, 1981; Pilskaln and Honjo, 1987). As a result of the rapid settling, a variety of sediment trap designs have similar efficiencies for collecting settling particles in the low current regime of the open ocean. These large particles settle through the entire water column of typical ocean depths (5000 m) in one to two months.
METHODS
In this study we will summarize and evaluate the particle flux measurements made with sediment traps developed at Oregon State University between 1980 and 1988 (Table 9.1). The OSU trap is a single-cone modification of a design originally developed by Andrew Soutar (Soutar et al., 1977). It features all plastic or fiberglass construction, a two-to-one height to diameter cone, a one cm by five cm baffle at the top of the cone, and a 10 cm wide lip at the top of the cone that limits turbulence at the mouth of the cone. The trap has evolved from a five-cup, sequential collector to the current model that has a 15-cup collector for enhanced temporal resolution of the particle flux. In
TABLE 9.1 Location and Date of Sediment Trap Experiments
|
Site |
Latitude (N) |
Longitude (W) |
Depth (m) |
Date of Experiment |
|
Atlantic |
|
|
|
|
|
HAP |
32.73 |
70.82 |
5400 |
6/7/82 – 4/28/83 |
|
NAP |
23.20 |
63.98 |
5847 |
8/21/83 – 9/27/84 |
|
Pacific |
|
|
|
|
|
MFZ |
39.49 |
127.69 |
4230 |
9/9/83 – 9/1/84 |
|
JDF |
47.97 |
128.10 |
2200 |
9/9/84 – 8/10/85 |
|
NS |
42.09 |
125.77 |
2829 |
9/22/87 – 9/16/88 |
|
MW |
42.19 |
127.58 |
2830 |
9/28/87 – 9/14/88 |
|
G |
41.55 |
132.00 |
3664 |
9/25/87 – 9/23/88 |
|
H |
6.57 |
92.77 |
3565 |
9/20/80 – 10/17/81 |
|
M |
8.83 |
103.98 |
3150 |
9/12/80 – 10/23/81 |
|
S |
11.06 |
140.14 |
4620 |
12/29/82 – 2/14/84 |
|
C |
1.04 |
138.94 |
4445 |
12/23/82 – 5/3/85 |
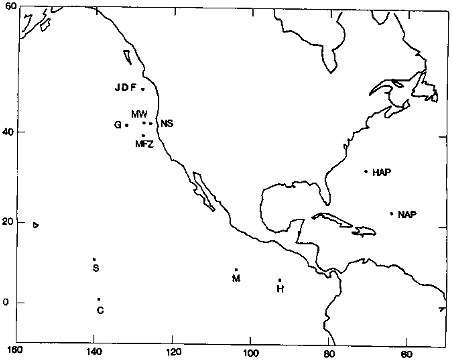
FIGURE 9.1 Locations of sediment trap moorings used in this study.
this study, however, we will report only average fluxes for the time intervals of the trap deployments. In general, the deployment periods are for one year (Table 9.1), the minimum deployment necessary to encompass the known seasonal flux changes (Deuser and Ross, 1980).
Sodium azide concentrations of 15 g/l in the sample cups preserve the trap samples. Azide is an effective bactericide, and because of the high alkalinity of the cup solutions, CaCO3 tests (even aragonite) are very well preserved. Fischer et al. (1983) discusses the sample preparation procedures in detail. Organic carbon and CaCO3 data were measured by acid evolution of CO2 and detection with a LECO carbon analyzer (Weliky et al., 1983). Atomic absorption spectrophotometry and instrumental neutron activation were used for all other analyses.
We report particle fluxes and burial rates for 11 sites (Figure 9.1; Tables 9.2-9.4). There are four equatorial Pacific sites (H, M, S, and C). Flux data from sites H and M have previously been reported in Dymond and Lyle, 1985; Murphy and Dymond, 1984; Fischer et al., 1986; Walsh et al., 1988a, b. Data from sites C and S have been reported in Dymond and Collier, 1988. There are five sites off the west coast of the United States. MFZ is a California Current site just north of the Mendocino Fracture Zone (Fischer et al., 1983). Nearshore (NS), Midway (MW), and Gyre (G) form a California Current transect (42° N) from very productive waters influenced by coastal upwelling to the relatively unproductive, central gyre. JDF is located on the Endeavour Segment of the Juan de Fuca Ridge, a site of present day, intense hydrothermal discharge. Although the primary purpose of this mooring was definition of processes effecting the hydrothermal particle flux (Dymond and Collier, 1988; Dymond and Roth, 1988; Roth and Dymond, 1989), three sediment traps were placed above the hydrothermal effluent plume. These data define the biological and upper water column inputs to this part of the ocean. Two sites are in the Atlantic. Hatteras Abyssal Plain (HAP) is approximately 300 km off the east coast of the United States. Particle flux data from this site have been reported in Heggie et al. (1987). Nares Abyssal Plain (NAP) is a deep water site in the western Atlantic (Thomson et al., 1984).
Definition of particulate rain rate to the sea floor requires data on the particulate flux variations with depth. Dissolution and decomposition of sinking particles remove labile components. Heterotrophic organisms consume the settling detritus, metabolize a portion of the organic matter, and repackage remaining inorganic and nonnutritious components into rapidly sinking fecal pellets. In addition, inclusion of clay-sized particles into large marine snow aggregates enhances the flux of fine particles and alters the composition of settling particles. Horizontal advection and lateral down slope transport from continental margins also modify the flux and composition of the settling material. Distinguishing between distal and local resuspension effects is necessary to determine the rain rate to the sediment. Distal resuspension by nepheloid transport, contour currents, or turbidity currents may be sources of biogenic and nonbiogenic components to a site. Locally resuspended material collected in a sediment trap, however,
TABLE 9.2 Bulk Sedimentation Data
|
Site |
Sedimentation Ratea |
Mass Accumulation Rateb |
Total Rain Rateb |
% Preserved |
Recycled Fluxb |
|
Atlantic |
|
|
|
|
|
|
HAP |
10 |
4,500 |
2000 |
225 |
-2,500 |
|
HAP |
1 |
650 |
1190 |
55 |
540 |
|
Pacific |
|
|
|
|
|
|
MFZ |
5.9 |
3,240 |
3,970 |
82 |
730 |
|
JDF |
1.6 |
840 |
2,500 |
34 |
1,660 |
|
NS |
19 |
9,690 |
19,010 |
51 |
9,320 |
|
MW |
11 |
4,440 |
6,050 |
73 |
1,650 |
|
G |
1.3 |
650 |
1,030 |
63 |
380 |
|
H |
0.66 |
110 |
2,550 |
4 |
2,440 |
|
M |
1.0 |
288 |
1,980 |
15 |
1,692 |
|
S |
0.1 |
32 |
1,030 |
3 |
998 |
|
C |
1.7 |
848 |
3,701 |
23 |
2,854 |
|
a Units of cm/1000 yr b Units of mg/cm2/yr. |
|||||
TABLE 9.3 Refractory Element Fluxes
represents an artificial flux. The trap intercepts the cycling of particles from the bottom into the water column and back to the bottom. This process increases the residence time of settling particles in the water column (Walsh et al., 1988b), but not the particulate flux to the bottom.
These difficulties cannot be overcome by mooring a single trap within the water column. Studies that involve deployment of 3-4 traps within the bottom 1000 m, however, indicate that local resuspension is not significant at elevations a few hundred meters above bottom (Dymond et al., 1981; Fischer, 1984; Walsh et al., 1988b). In this paper we will use particulate flux measurements from traps above the resuspension zone (Figure 9.2) to extrapolate the rain rate to bottom depths.
Temporal variations in the particle flux provide another complication to estimating the particulate rain to the bot-
TABLE 9.4 Biogenic Component Fluxes
tom. The scales of variation range from individual bloom events (Limpitt 1985) to seasonal (Deuser and Ross, 1980) and even interannual scales. Consequently, studies that are shorter than one year are likely to result in erroneous estimates of the average particulate rain rate. Moreover, data for a single year at any given site will not resolve the importance of interannual variability such as those caused by ENSO events (Dymond and Collier, 1988).
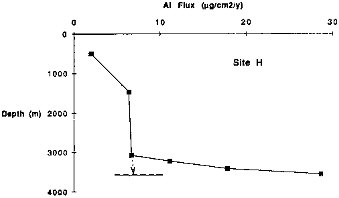
FIGURE 9.2 Particulate aluminum flux variations with water depth at site H in the eastern Equatorial Pacific. The very strong increase in flux below a depth of 3100 m is thought to be due to local resuspension of previously deposited sediments. The dashed horizontal line indicates the bottom depth at the site. The dotted arrow indicates the extrapolation procedure used to define the rain rate to the bottom at this site.
Determination of the accumulation rate of sediments may also have difficulties. Ideally, we would like to compare sedimentation rates measured in the uppermost portion of the sediment to bring the time scales of burial fluxes and sediment trap measurements more in accord. Although the best coring technology can sample the upper few centimeters of sediment, bioturbation is a consistent feature of the upper 10 cm of deep sea sediments. Consequently, dating techniques generally integrate over time scales greater than 104 yr and include perturbations due to the most recent glacial-interglacial transition. In this study we will use a variety of techniques (230Th,14C and oxygen isotopic stratigraphy) to define the sedimentation rate.
REFRACTORY ELEMENT RAIN AND BURIAL FLUXES
Certain elements found in the particulate load of the oceans are carried in unreactive phases. For example, aluminum, iron, titanium, scandium, and thorium are dominantly in aluminosilicate debris and oxide phases that undergo little dissolution or transformation between their entry to the oceanic system and burial in sediments. For these elements the burial rate should be equal to the rain rate.
At most sites fluxes of refractory elements increase with depth in the water column. Aluminum is an example (Figure 9.3); a similar pattern exists for other refractory elements (Fe, Ti, Sc, and Th). The cause of the increase in refractory element fluxes could be: (1) resuspension of sediments and down slope movement of particles or (2) aggregation of fine
clays and other aluminosilicates by settling organic matter. Probably both processes are important.
The conservative character of refractory elements provides a test for the validity of a comparison between rain rate measured by sediment trap fluxes and burial rates in the underlying sediments. If the burial rate of a refractory element does not equal its rain rate to the bottom, there is good reason to question the comparison of more labile elements as well. For all sites except HAP the burial fluxes of Al and Fe are within a factor of two of the rain rates (Table 9.3). We discuss reasons for the HAP discrepancies below. Except for HAP the small differences between rain and burial rates for refractory elements are probably a consequence of comparing rain rates from a single year to the 103 to 105 yr time scale that is integrated by sediment accumulation rate measurements. Some differences could be due to imperfect collection efficiencies by sediment traps. If this effect was important, however, it should produce consistently higher or lower rain rates compared to burial rates. Also, trapping efficiency estimates for traps similar to those used in this study approach 100 percent (Bacon et al., 1985).
The rain rate of particulate aluminum varies by a factor of 500 in our study (Table 9.3). Near shore sites generally have higher rain rates than more open ocean sites. Riverine aluminosilicate inputs could cause such a pattern. The Multitracers Transect (sites NS, MW, and Gyre) provides a clear demonstration of the decrease in flux with increasing distance from the continental margin. The total rain rate varies by a factor of 20 over the 600 km transect. Aluminum rain rates, which primarily indicate the extent of continental aluminosilicate input, vary by a factor of nearly 50 across this transect.
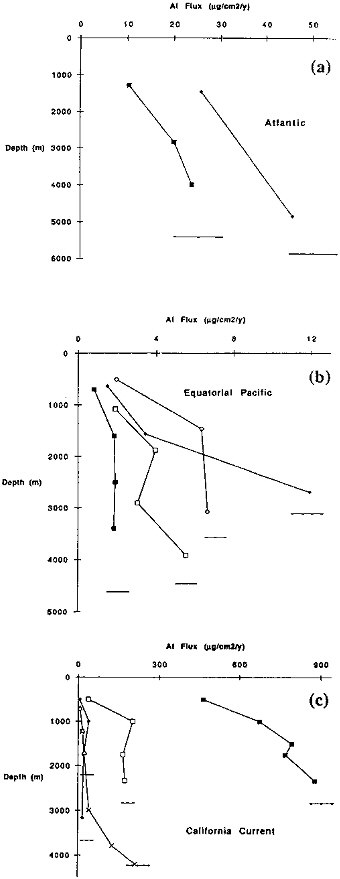
FIGURE 9.3 (a) Particulate aluminum flux variations with water depth at Atlantic sites used in this chapter. The squares denote the HAP site; diamonds indicate the NAP site. The horizontal lines mark the depth of the bottom for each site. (b) Particulate aluminum variations with depth at Equatorial Pacific sites. Open diamonds are for site H; filled diamonds are site M; open squares are site C; filled squares are site S. (c) Particulate aluminum flux variations with water depth at California Current sites. Filled squares are Nearshore; open squares are Midway; filled diamonds are Gyre; x denotes MFZ; open triangles are for ER.
BIOGENIC RAIN AND BURIAL FLUXES
At most sites biogenic debris dominates the settling particle flux. This is the case even for the particulate debris that reaches the bottom (Tables 9.2 and 9.4), despite the decomposition and dissolution that occurs throughout the water column. Assuming the biogenic fraction is composed of only carbonate, opal, and organic matter (2.5 times organic carbon), this fraction comprises 40 to 94 percent of the rain rate at the sites studied. Only at the relatively near shore sites in the California (NS and MFZ) is the total rain rate composed of less than 50 percent biogenic debris. The Equatorial Pacific sites, which contain 74 to 94 percent biogenic debris, are the most biogeneousrich of the 11 sites.
Several studies have attempted to relate rates of primary production to the flux of particulate organic carbon measured using sediment traps (Suess, 1980; Betzer et al., 1984; Pace et al., 1987). These results indicate that particle flux through the water column is a function of primary productivity and that this particulate flux decreases strongly with increasing depth. Presumably the decrease in particulate organic carbon with depth is a consequence of decomposition by bacteria and metabolism by zooplankton of carbon in of settling particles. The relationships exhibited by Figure 9.4 suggest that approximately 1 percent of the carbon fixed in the euphotic zone reaches depths as great as three kilometers. Recently, Silver and Gowing (1991) suggest that living organisms, which enter sediment traps (swimmers), can strongly influence the changes in carbon flux observed in the upper 1000 meters of the ocean and relationships such as shown in Figure 9.4.
The concept of ''new" productivity is particularly relevant to the magnitude of particulate flux. New productivity is that portion of the total primary production that results from influx of new nutrients to euphotic zone (Dugdale and Goering, 1967). If the input of nutrients to the euphotic zone by upwelling, stream input, and atmospheric sources is balanced by an export flux due to the settling of particulate organic matter (Eppley and Peterson, 1979), measurement of POM fluxes can be used to estimate new productivity within the ocean. Low productivity regions of the oceans appear to have a major fraction (>80 percent) of total primary productivity supported by organic matter recycling. In contrast, much of the primary production in highly productive continental margins (˜ 50 percent) is new production (Platt and Harrison, 1985). One consequence of higher ratios of new to total primary productivity in more productive sites is that the rain rates of organic matter magnify the pattern of primary productivity variations. Thus, all other factors being equal, the carbon burial rate in sediments underlying high productivity sites should
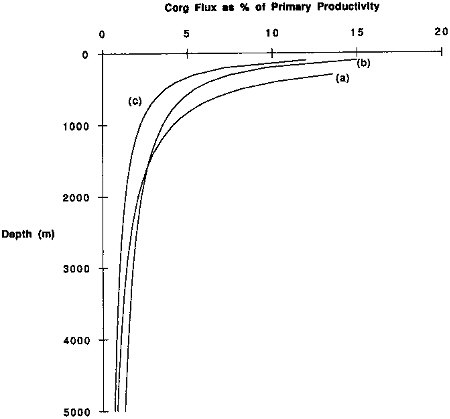
FIGURE 9.4 Particulate organic carbon flux as a percentage of primary productivity plotted against water depth. Curve (a) is from Suess (1980); curve (b) is from Betzer et al. (1984); curve (c) is from Pace et al. (1987).
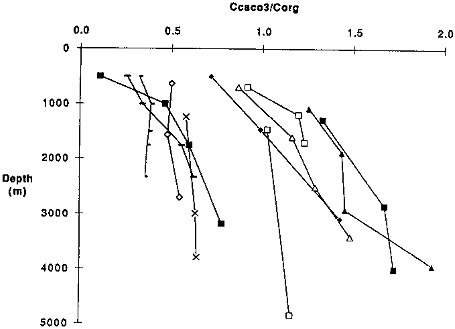
FIGURE 9.5 The ratio of carbonate carbon to organic carbon versus depth at all sites. Filled squares are HAP; open squares are NAP; filled diamonds are H; open diamonds are M; filled triangles are C; open triangles are S; x's are MFZ; small dashes are NS; large dashes are MW; filled squares are G; open squares are ER.
be a larger fraction of primary productivity than at unproductive sites.
Because temporal variations in new production are a consequence of changes in external forcing agents (wind intensity, continental erosional rates), particle flux and sediment burial fluxes can be used to define changes in oceanographic conditions over a range of temporal scales. Moreover, the flux of particulate organic matter settling from the euphotic zone is one mechanism by which carbon is transferred from the upper ocean to the deep ocean. This process is largely responsible for the low carbon dioxide content in the atmosphere relative to what would be expected for equilibrium with the ocean atmosphere system (Broecker and Peng, 1982). Berger et al. (1988) suggest this process transfers 4-5 gigaton of carbon each year to the deep ocean.
The composition of settling biogenic particles can also affect atmospheric CO2 (Dymond and Lyle, 1985). In particular the ratio of carbonate carbon to organic carbon influences the impact of the organic matter fluxes. This is because the settling of CaCO3 is an alkalinity flux that has the effect of adding CO2 to the atmosphere. Figure 9.5 summarizes the carbonate carbon to organic carbon variations at each site. In general there is an increase in this ratio with increasing water depth, an indication that organic carbon is recycled more rapidly than CaCO3.
ORGANIC CARBON PRESERVATION
Organic carbon preservation in the pelagic sites (greater than 500 km from a continental margin) is low (Table 9.4). For these sites the average burial rate of organic carbon is less than 5 percent of the extrapolated rain to the sea floor. The sites near continental margins, however, have much higher preservation, as can be observed in a profile combining all of the northeast Pacific moorings (Figure 9.6). For sites less than 300 km from the coastline, greater than 20 percent of the rain rate is preserved. Preservation at the more distant sites drops to levels we have observed elsewhere in our pelagic mooring locations.
Relatively high preservation levels may not be uncommon near continental margins. Jahnke (1986) observed approximately a 50 percent preservation of the organic carbon rain in Santa Monica Basin. Similar high levels of carbon preservation have been compiled for other Southern California basins (Emerson, 1985). High apparent preservation could be due to deep lateral inputs of particulate organic matter (Jahnke et al., 1990). Other possible explanations for high preservation near the continents include the presence of refractory terrestrial organic matter in the organic fraction, the loss of an extremely labile fraction of organic carbon from the sediment trap material after collection, or a coupling between sedimentary mass accumulation rate and the preservation of the organic carbon fraction.
We can test the possibility for a significant terrestrial component in the organic fraction for the Multitracers sites in the California Current. There we have analyses of the lipid fraction in the surface sediments and can use the abundance of terrestrial plant wax alkanes to estimate the total terrestrial input to each site. We achieve this through abundance measurements made by Prahl and Carpenter
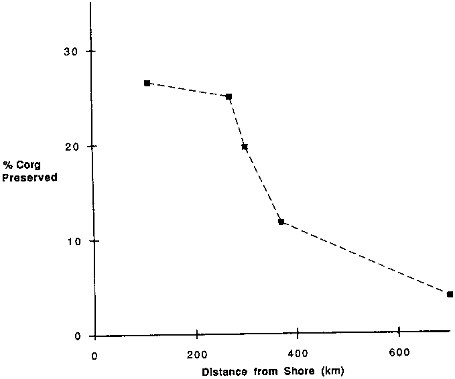
FIGURE 9.6 The percentage of the organic carbon rain rate that is preserved in the sediments versus distance from shore for the California Current sites.
(1984) of these biomarkers with respect to total terrestrial organic carbon carried in the Columbia River. Measurement of the biomarker in the sediment (F. Prahl, unpublished) can then be multiplied by this factor in order to get an estimate of the total terrestrial organic carbon in the sample. This approach suggests no variation in the proportion of terrestrial organic carbon along the mooring transect, from 100 km from the coast to 700 km. In each case, the organic fraction consistently had a model terrestrial organic carbon fraction of about 20 percent. Thus, variations in the terrestrial organic carbon fraction cannot explain the decrease in preservation offshore.
The high preservation rates of organic carbon might be a consequence of underestimating the rain rate to the sediments. One possibility of error is that a portion of the settling organic matter dissolves upon entering the trap cups. Significant fractions of particulate P, N, and organic carbon enter into the trap solutions (Knauer, et al., 1984; Karl, 1989; Dymond and Collier, 1989). Unfortunately, we cannot completely evaluate this effect because we do not have data on the dissolved organic carbon in most of our trap cups. Data that are available, however, suggest that the soluble fraction of the particulate organic matter is greatest at shallow depths (R.W. Collier, unpublished data). At depths of <1000 m the soluble fraction is approximately 50 percent of the total carbon flux and decreases to approximately 20 percent at greater depths (Dymond and Collier, 1989). Consequently, this effect could not account for the factor of 10 change in preservation observed on the Multitracers (NS to Gyre) transect. Moreover, the soluble loss of organic carbon would have to be greater in the near shore traps compared to central ocean traps to explain the observed gradient in preservation. There is no reason to suspect that near shore organic particles are more vulnerable to soluble loss than particles collected in the offshore traps.
High apparent preservation rates can be achieved near continental margins if organic material has been transported to the depositional site by deep lateral advection. A marked increase in the organic carbon flux with water depth would support this hypothesis. Data from the Multitracers transect, however, show relatively small increases of trapped organic carbon flux through the water column (Figure 9.7). Thus, if lateral transport has been important for the organic carbon flux, it must be occurring deeper than the deepest traps on our moorings, nominally 500 m above the seafloor. Because the measured rain rates of aluminum in NS and MFZ traps agree within a factor of two with the aluminum burial rates (Table 9.3), major near bottom inputs seem unlikely for these sites. Significant aluminosilicate contributions should accompany any deep inputs of particulate organic carbon.
Finally, as suggested by Heath et al. (1977), Muller and Suess (1979), Henrichs and Reeburgh (1987), and
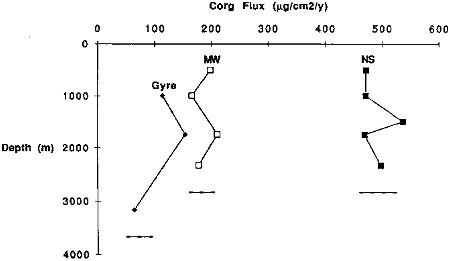
FIGURE 9.7 Variations in the particulate organic carbon flux with depth at the three sites comprising the Multitracers transect across the California current.
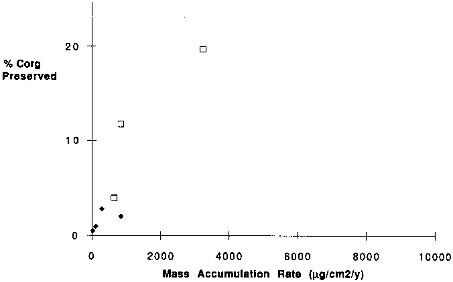
FIGURE 9.8 The percentage of organic carbon rain rate that is preserved versus the mass accumulation rate at that site. Filled square is Nares Abyssal Plain; open squares are California Current sites; diamonds are Equatorial Pacific Sites.
Ingall and vanCappellen (1990), variations in sediment accumulation may affect the preservation of organic matter in the sediments. Emerson (1985), however, has argued that the residence time for organic carbon is too short for sediment accumulation rates to have any effect on the organic carbon preservation. Nevertheless, the correlation between organic carbon preservation and mass accumulation rate of the sediments (Figure 9.8) is significant (R2 = 0.80). Perhaps these observations can be reconciled with the carbon degradation model of Emerson (1985) if organic carbon has a broad range of reactivities. If so, the relatively short residence time for organic carbon (˜ 100 yr) would be a consequence of a mixture of highly labile organic matter and refractory organic matter with degradation constants sufficiently large that the sedimentation rate has an influence on the extent of preservation. In a more recent paper, Emerson and Hedges (1988) state that if organic carbon rain to sediments has a refractory component with a residence time of thousands of years, its concentration in sediments would be sensitive to sedimentation rate. Alternatively, Emerson (1985) suggests that bottom-water oxygen content and bioturbation rates are important controls on organic carbon preservation. Although we would not expect much variation of bottom
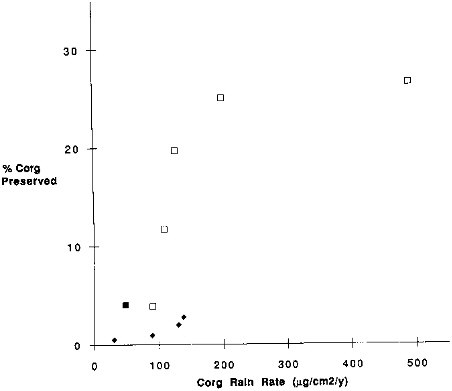
FIGURE 9.9 The percentage of organic carbon rain rate that is preserved versus the rain rate of organic carbon. Filled square is Nares Abyssal Plain; open squares are California Current sites; diamonds are Equatorial Pacific Sites.
water oxygen along the latitudinal Multitracers transect, there may be variations in the bioturbation rate. It seems reasonable that the abundance of benthic fauna (and thus, bioturbation) correlates with organic carbon rain rate, which decreases strongly offshore. If this were the case, one would expect the organic carbon preservation rate to show a relationship to the carbon rain rate. The correlation between these two variables is weaker (R2 = 0.55; Figure 9.9) than the correlation between carbon preservation and mass accumulation rate.
CALCITE PRESERVATION
Calcite preservation in sediments is most strongly affected by the depth dependent changes in calcite saturation in the oceans. The effect is apparent at the northeast Pacific sites where the water depth ranges from 2200 to 4200 m. Above about 2200 m roughly 1/3 of the total calcite falling through the water column is preserved. Below this depth less than 10 percent survives in the sediments. There is no significant correlation between mass accumulation rate and preservation of CaCO3 for these sites.
The CCaCO3/Corg of the raining debris may also effect the degree of preservation of CaCO3. The production of CO2 from organic matter decomposition (Emerson, 1981) will enhance CaCO3 dissolution within the sediments. The effects of metabolic CO2 production are a function of the CCaCO3/Corg of the biogenic particles reaching the seafloor. This effect may account for the relatively low preservation at the Nearshore site that has the lowest rain rate CCaCO3/Corg (Figure 9.5) and the lowest preservation of those California Current sites of similar depth (Table 9.4).
OPAL PRESERVATION
The percentage of opal preserved ranges from 1 to 20 percent at the sites shown in Table 9.4. Broecker and Peng (1982) have proposed an opal dissolution model in which the rain rate of opal provides an important control on the degree of preservation. With this model sites of high rain rate will not experience as large as fractional loss of the raining opal as sites with low opal rain rates. Thus, dissolution effects should enhance differences in the primary rain rate. Our data suggest higher preservation with greater rain rate of opal (Figure 9.10). The Broecker and Peng modeling of dissolution, however, assumes a constant rate of dissolution of pure opaline materials. This dissolution factor, which can be computed from the data in Tables 9.2 and 9.4, ranges from rates of 1000 to 12,000 µg/cm2/yr. The Nearshore site has the highest dissolution factor. Variation in the rate of dissolution is not surprising since the nature of opaline debris ranges from robust radiolarian and diatom forms to more easily soluble silicoflagellates.
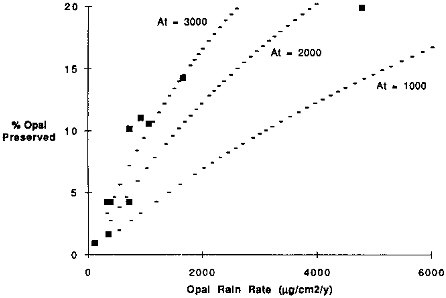
FIGURE 9.10 The percentage of opal rain rate that is preserved versus the opal rain rate. The dashed lines indicate the model opal preservation estimates of Broecker and Peng (1982). Their model suggests that the preservation is proportional to the opal rain rate, the dissolution rate of pure opal, and the burial rate of non-opal materials. The effects of different non-opal accumulation rates are shown (At = 1000, 2000, and 3000 µg/cm2/yr). For all of the model lines a pure opal dissolution rate of 3000 µg/cm2/yr was used.
THE RELATIONSHIP BETWEEN ALUMINOSILICATE AND BIOGENIC RAIN RATES
The aggregation of clays into larger, more rapidly settling particles is necessary to account for the discrete patterns of clay mineral distributions in deep ocean sediments. The direct relationship between the flux of organic carbon and aluminosilicate debris (Honjo, 1982; Deuser et al., 1983) indicates some biogenic aggregation mechanism. Indiscriminate filtering of zooplankton, which repackage fine-grained aluminosilicate debris into rapidly sinking fecal pellets, could account for the carbon-aluminosilicate relationship. Alternatively, organic-rich flocs or marine snow may incorporate fine, inorganic particles. Although correlation between aluminosilicate or alumi-
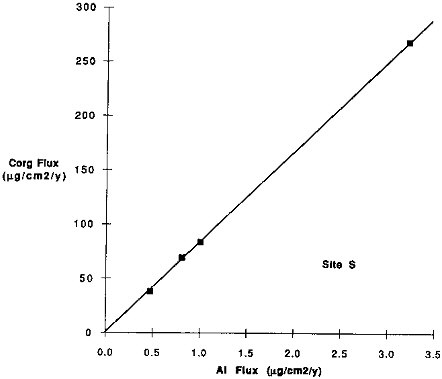
FIGURE 9.11 Organic carbon flux versus Al flux for site S samples. Only samples from the uppermost trap (700 m) deployed at this site were used. The different samples shown are the seasonal cups, which for S was only four samples.
nium fluxes and the flux of organic carbon (Figure 9.11) is apparent at any given site, a single relationship does not fit for all oceanic sites. Figure 9.12 demonstrates more than a factor of 100 range in Corg/Al values for settling particles in the oceans. Sites near continental sources have Corg/Al values that are less than one; in contrast, the ratio for Equatorial Pacific particles is approximately 100. These variations indicate that Corg and Al fluxes define a common carrier rather than a direct functional relationship. Zooplankton filtering or other aggregation processes may be responsible for the relationship, however, the available aluminosilicate debris is strongly dependent on location.
The strong correlation between the fluxes of particulate organic carbon and aluminum at any given site suggests an alternative means for computing the degree of preservation at the various sites. If the flux of aluminum to the bottom is conservative and the Corg/Al of the raining material remains constant over the time interval integrated by sediment burial rate data, the following relationship is valid:
% Corg preserved = ((Corg/Al)sediments/(Corg/Al)rain) x 100
Similar relationships can be written for any of the labile components of the particulate rain.
This approach overcomes problems that result from errors in the mass accumulation rate or trap efficiency. It is functionally equivalent to computing a correction factor for the rain rates that would make the rain rates of Al the same as the burial rate in sediments. Figure 9.13 demonstrates the change in the labile/Al ratio with depth for two sites and compares the ratio with that observed in the sediments. In Table 9.5 we have compiled the degree of preservation of Corg, CaCO3, and opal computed by this ratio-to-Al approach. In general, this means of computing the degree of preservation agrees very well with the preservation of biogenic component computed by comparison of the rain rate and the burial fluxes (Figure 9.14).
For the Hatteras Abyssal Plain site (HAP) the ratio and the flux method do not agree. The rain rate/burial rate comparison indicates 24 and 90 percent preservation of organic carbon and CaCO3 respectively (Table 9.3). In contrast, the preservation computed by the ratio-to-Al method is 4 percent for organic carbon and 11 percent for CaCO3 (Table 9.5). Since the burial and rain rates of refractory element at HAP do not agree, we suspect the ratio method provides more accurate estimates of preservation at this site.
At HAP the burial flux of Al, Fe, and Ti exceeds the rain rate of these elements by nearly an order of magnitude
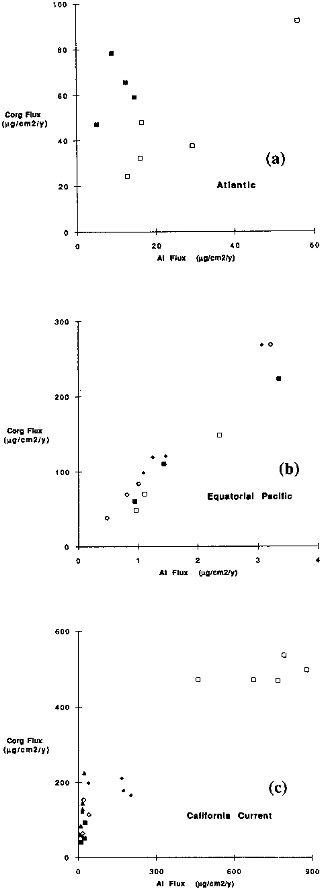
FIGURE 9.12 Organic carbon flux versus Al flux. (a) Atlantic sites; (b) Equatorial Pacific; (c) California Current. Only the uppermost samples at each site were used for this comparison and the trap depths range from 500 to 1500 m.
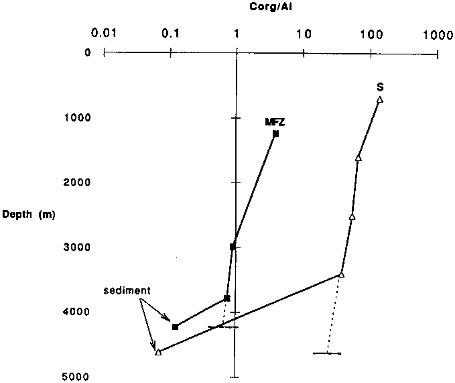
FIGURE 9.13 Changes in the particulate carbon to Al ratios with water depth for two representative sites. The deepest sample at each site is the ratio observed in sediments at the site. The horizontal dashed line indicates the bottom depth; the sloping dashed line indicates an extrapolation of the ratio to the bottom.
TABLE 9.5 Percentage of Rain Rate of Biogenic Components Preserved in the Sediment as Computed from Rations to Aluminim
|
|
ORGANIC CARBON |
CaCO3 |
OPAL |
||||||
|
Site |
Corg/A 1(rain) |
Corg/A1 (burial) |
% Preserved (ratio) |
CaCo3/A1 (rain) |
CaCO3/A1 (burial) |
% Preserved (ratio |
Opal/A1 (rain) |
Opal/A1 (burial) |
% Preserved (ratio) |
|
Atlantic |
|||||||||
|
HAP |
1.6 |
0.1 |
3.7 |
23.5 |
3.0 |
12.9 |
3.8 |
0.4 |
11 |
|
NAP |
0.9 |
0.0 |
3.5 |
9.2 |
0.6 |
6.7 |
2.0 |
0.0 |
0.83 |
|
Pacific |
|||||||||
|
MFZ |
0.6 |
0.1 |
17 |
2.5 |
0.2 |
9.0 |
3.9 |
0.4 |
10.4 |
|
JDF |
3.6 |
0.4 |
12.3 |
38.2 |
6.4 |
17 |
24 |
2.5 |
10.7 |
|
NS |
0.5 |
0.2 |
33 |
1.6 |
0.1 |
6.8 |
5.1 |
1.1 |
22.5 |
|
MW |
1.1 |
0.2 |
15 |
4.6 |
0.3 |
7.1 |
8.3 |
0.6 |
7.8 |
|
G |
4.5 |
0.1 |
2.3 |
21.0 |
0.6 |
2.8 |
17 |
0.6 |
3.9 |
|
H |
12.7 |
0.1 |
1.0 |
181.3 |
0.2 |
0.1 |
55 |
2.6 |
4.6 |
|
M |
9.1 |
0.3 |
2.9 |
43.6 |
3.0 |
6.8 |
47 |
2.1 |
4.5 |
|
S |
16.70 |
0.1 |
0.4 |
301.1 |
0.1 |
0.05 |
192 |
2.7 |
1.4 |
|
C |
24.0 |
0.5 |
2.2 |
386.9 |
133.8 |
35 |
198 |
24 |
11.9 |
(Table 9.4). In addition, the mass accumulation rate is more than a factor of two greater than the total rain rate (Table 9.2). Several possibilities can account for this observation: (1) near bottom, down slope sediment transport from the nearby continental margin is a major source of deposition at this site; (2) episodic inputs of sediments are not measured by short-term trap experiments; (3) major errors exist in the sediment accumulation rates at this site. The third possibility seems unlikely because the sedimentation rates at this site are very well constrained by 14C age determinations on several cores (Dickson, 1985). Neither of the other possibilities, however, can be elimi-
nated. At this site we also deployed some traps within 50 m of the bottom (Dymond, unpublished data). These traps had 10 to 20 times greater flux than the rain rates indicated in Table 9.2. Although this observation could be explained by local resuspension, the enhanced near bottom particle flux could also be due to lateral, near bottom advection, and thus, explain the rain rate/burial mismatch. Episodic flux events can not be ruled out. Turbidite inputs and benthic storms (Gardner and Sullivan, 1981), which occur in this general region of the Atlantic Ocean, could be a dominant source of sediments and yet not be observed in our short-term experiment.
An important implication of the observed mismatch between rain rate and burial rate of refractory elements is that labile components are probably also introduced by whatever process deposited the excess refractory elements. Thus, computations of the degree of preservation based on rain/burial comparisons are very likely to be erroneous. Computations of preservation based on the ratios-to-Al may be less effected by deep or episodic inputs since the labile-to-Al ratios in these sources are likely to be similar to the extrapolated ratios used in our calculations.
INFLUENCE OF THE CONTINENTAL MARGINS
The biogenic fluxes and preservation rates that we have computed indicate the importance of continental margins as a major removal site of biogenic material from the ocean. The large decrease in rain rate of biogenic material combined with the apparently greater preservation of these components (particularly organic carbon and opal) in sites near the continent result in very high burial rates. For example the burial rate of organic carbon and opal decrease by a factor of approximately 60 over the 600 km long Multitracers Transect (Table 9.4). The carbon burial rate at the Nearshore site is approximately 1000 times greater than that at site S, a central Pacific site that probably has organic carbon burial rates similar to red clay areas beneath the Pacific and Indian Ocean central gyre regions. These results are compatible with the global compilations of Berner (1982) and Romankevich (1984) that suggest more than 80 percent of the carbon burial in the oceans occurs at continental margins.
Because of the high rain rate of carbon near continental margins, these sites are also very important contributors of
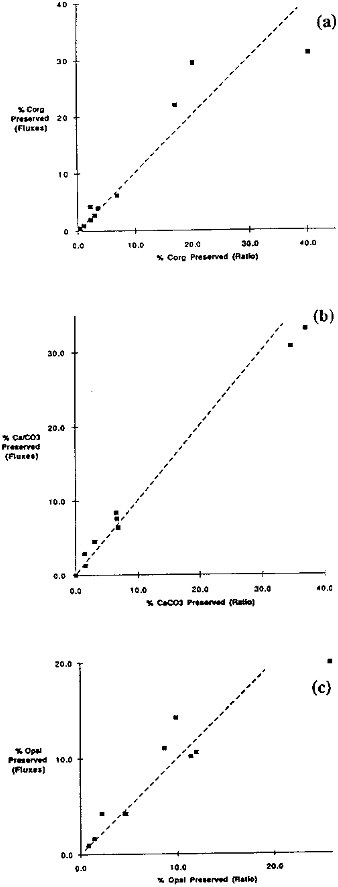
FIGURE 9.14 A comparison between the extent of preservation of (a) organic carbon, (b) CaCO3, and (c) opal computed by two methods. The fluxes method compares the rain and burial fluxes of carbon. The ratio method compares the carbon-to-Al ratio in settling particles and bottom sediments.
the benthic flux to the bottom waters, despite their better preservation. The benthic flux decreases by a factor of six along the 600 km transect from our Nearshore site to the Gyre site (Table 9.4). These trap estimates of benthic flux and the decrease offshore are similar to estimates made from bottom chamber experiments (Smith and Hinga, 1983) off the southern California margin.
Resuspension and down slope movement of particles may be an important mechanism for transporting materials from the continental margins to the deep ocean basins. Variations in the flux of Al with depth are evidence for such a sediment-focusing mechanism. For the sites far from a continental margin such as Gyre, S and C there is little or no increase in Al flux with increasing water depth (Figure 9.3). In the Nearshore, Midway, and the MFZ sites, however, the flux of aluminum increases one to two orders of magnitude more rapidly with increasing depth (Figure 9.3). Since diagenesis of raining particles results in enrichments of aluminosilicates compared to biogenic components, sediment resuspension and down slope transport will be most effective in transporting aluminum and aluminosilicate-associated elements.
There is evidence that resuspension of shelf sediments is an important process for those sites within the California Current. This high energy continental margin experiences frequent winter storms that are known to produce wave-induced ripple marks to a depth of 200 m water depth (Komar et al., 1972). Kulm et al., 1975 suggest silt and clay accumulate on the Oregon shelf in the summer months and are resuspended and transported offshore in the winter. Moreover, because of the high biological productivity stimulated by summer upwelling, the same process may be an important means of exporting carbon and other bioactive elements. Time series measurements at the Nearshore site demonstrate surprisingly high organic carbon fluxes in the winter months (Collier et al., 1989), a time expected to have low primary productivity. It is currently unknown whether this winter flux of carbon is the result of shelf resuspension or a winter productivity bloom. It is clear that the significance of shelf resuspension and off shore transport to the global carbon cycling is undefined and controversial (Walsh et al., 1981; Rowe et al., 1986).
EOLIAN SOURCES
It is probable that the source of particulate aluminosilicate flux observed at sites distant from continents is predominantly eolian. If we assume the eolian dust input has an Al content typical of igneous and sedimentary rocks, the total input can be compared to other estimates of the eolian fluxes. A variety of crustal rocks have Al contents of approximately 8 percent (Poldervaart, 1955), suggesting the estimated rain of aluminosilicate debris reaching the bottom at the Equatorial Pacific sites S and C is 23 and 77 µg/cm2/yr respectively. Possibly only fluxes measured in the upper water column represent eolian inputs. Consequently, for sites S and C the eolian inputs estimated from Al fluxes measured at a depth of approximately 1000 m (Figure 9.3) are approximately 20 µg/cm2/yr. This estimate is very similar to the Holocene atmospheric dust input determined by acid treating equatorial sediment cores (Rea et al.,Chapter 8, this volume). A similar computation for Gyre, another open-ocean site in the Pacific, suggests approximately 200 µg/cm2/yr of eolian debris reaches this location. This estimate compares favorably with the sediment-based estimate of Janecek and Rea (1983) for sites in the central and eastern North Pacific that lie beneath the Westerly flow from Asian deserts.
Data from the Nares Abyssal Plain suggest that eolian sources are more important here than for any of our Pacific sites. Although this site is more than 1000 km from the nearest continental margin, the aluminum rain rate is higher than that measured for the more near shore HAP site. The aluminum flux measured at a depth of 1465 m (Figure 9.3) suggests a total eolian flux of over 300 µg/cm2/yr. This site lies within the region of the Atlantic affected by Trade winds that sweep the African deserts and carry dust across the Atlantic Ocean (Prospero, 1981).
CONCLUSIONS
Biological debris dominates the settling particle flux in most open ocean sites. This flux of material is not only an important mechanism for transferring carbon to the deep ocean but also is linked to the removal of aluminosilicate material of continental origin. Comparison between the rain rate of aluminosilicates reaching the seafloor and their burial rate in the sediments indicates that sediment trap studies provide a valid approach for studying the recycling of biogenic elements at the seafloor.
The preservation of organic carbon appears to depend upon the sediment accumulation rate. The processes that account for this relationship are uncertain. Defining the factors that control the preservation of organic carbon is important for interpreting the sedimentary record and for estimating the extent of carbon removal from the ocean system.
Opal preservation appears to be related to the opal rain rate reaching the ocean floor. One consequence of this relationship is that burial rate patterns in sediments will magnify the patterns of opal production in the upper water column. In contrast, water depth strongly affects carbonate preservation.
Continental margins are sites of very high rain rates of biogenic and aluminosilicate debris, and the fluxes of these materials decrease very rapidly with increasing distance
from shore. This observation coupled with a decrease in organic preservation with distance indicates that continental margins are very important sites of carbon removal from the ocean. Some of the rain of carbon in the basins adjacent to margins may come from export of carbon that was fixed and temporally deposited on continental shelves and slopes.
REFERENCES
Alldredge, A.L., and M.W. Silver (1988). Characteristics, dynamics and significance of marine snow, Progress in Oceanography20, 41-82.
Bacon, M.P., C.A. Huh, A.P. Fleer, and W.G. Deuser (1985). Seasonality in the flux of natural radionuclides and plutonium in the deep Sargasso Sea, Deep-Sea Research32, 273-286.
Berger, W.H., K. Fischer, C. Lai, and G. Wu (1988). Ocean carbon flux: Global maps of primary production and export production, in Biogeochemical Cycling and Fluxes Between the Deep Euphotic Zone and Other Oceanic Realms, C. R. Agegian, ed., NOAA National Undersea Research Program, Research Report88-1, pp. 131-176.
Berner, R.A. (1982). Burial of organic carbon and pyrite sulfur in the modern ocean: Its geochemical and environmental significance, American Journal of Science282, 451-473.
Betzer, P.R., W.J. Showers, E.A. Laws, C.D. Winn, G.R. DiTullio, and P.M. Kroopnick (1984). Primary productivity and particle fluxes on a transect of the Equator at 153° W in the Pacific Ocean, Deep-Sea Research31, 1-11.
Blomqvist, S., and L. Hakanson (1981). A review on sediment traps in aquatic environments, Arch. Hydrobiology91, 101-132.
Broecker, W.S., and T.H. Peng (1982). Tracers in the Sea, Eldigio, New York, pp. 47-94.
Collier, R., J. Dymond, N. Pisias, and M. Lyle (1989). Effects of seasonal oceanographic cycles on the paleoceanography record: Initial results from the MULTITRACERS experiment. EOS 70, 365.
Deuser, W.G., and E.H. Ross (1980). Seasonal change in the flux of organic carbon to the deep Sargasso Sea, Nature283, 364-365.
Deuser, W.G., P.G. Brewer, T.D. Jickells, and R.F. Commeau (1983). Biological control of the removal of abiogenic particles from the surface ocean, Science219, 388-391.
Dickson, S. (1985). Late Quaternary evolution of the northern Hatteras Abyssal Plain. M. Sc. Thesis, University of Rhode Island, Kingston.
Dugdale, R.C., and J.J. Goering (1967). Uptake of new and regenerated forms of nitrogen in primary productivity, Limnology and Oceanography 12, 196-206.
Dymond, J. (1984). Sediment traps, particle fluxes, and benthic boundary layer processes, in Global Ocean Flux Study, Proceedings of a Workshop, National Academy Press, Washington, D.C., pp. 260-284.
Dymond, J., and M. Lyle (1985). Flux comparisons between sediments and sediment traps in the eastern tropical Pacific: Implications for atmospheric CO2 variations during the Pleistocene, Limnology and Oceanography30, 699-712.
Dymond, J., and S. Roth (1988). Plume dispersed hydrothermal particles: A time-series record of settling flux from the Endeavour Ridge using moored sensors, Geochimica et Cosmochimica Acta52, 2525-2536.
Dymond, J., and R. Collier (1988). Biogenic particle fluxes in the equatorial Pacific: Evidence for both high and low productivity during the 1982-1983 El Niño, Global Biogeochemical Cycles2, 129-137.
Dymond, J., and R. Collier (1989). The easily soluble fraction of the settling particle flux, in Global Ocean Flux Study, Proceedings of a Workshop, National Academy Press, Washington, D.C., pp. 84-85.
Dymond, J., K. Fischer, M. Clauson, R. Cobler, W. Gardner, M. J. Richardson, W. Berger, A. Soutar, and R.A. Dunbar (1981). A sediment trap inter-comparison study in the Santa Barbara Basin, Earth and Planetary Science Letters53, 409-418.
Emerson, S. (1981). Carbon fluxes at the sediment-water interface of the deep-sea: Calcium carbonate preservation. Journal of Marine Research39, 139-162.
Emerson, S. (1985). Organic carbon preservation in marine sediments, The Carbon Cycle and Atmospheric CO2: Natural Variations Archean to Present, E.T. Sundquist and W.S. Broecker, eds., American Geophysical Union, Washington D.C., pp. 78-89.
Emerson, S., and J.I. Hedges (1988). Processes controlling the organic carbon content of open ocean sediments, Paleoceanography3, 621-634.
Eppley, R.W., and B.J. Peterson (1979). Particulate organic matter flux and planktonic new production in the deep ocean, Nature282, 677-680.
Fischer, K.J. (1984). Particle Fluxes to the Eastern Tropical Pacific Ocean — Sources and Processes, Ph.D. Thesis, Oregon State University, Corvallis, 241 pp.
Fischer, K., J. Dymond, C. Moser, D. Murray, and A. Matherne (1983). Seasonal variation in particulate flux in an offshore area adjacent to coastal upwelling, in Coastal Upwelling, Part A., E. Suess and J. Thiede, eds., Plenum Publishing Corp., New York, pp. 209-224.
Fischer, K., J. Dymond, M. Lyle, A. Soutar, and S. Rau (1986). The benthic cycle of copper: Evidence from sediment trap experiments in the eastern tropical North Pacific Ocean, Geochimica et Cosmochimica Acta50, 1535-1543.
Gardner, W.D. (1980). Field assessment of sediment traps, Journal of Marine Research38, 41-52.
Gardner, W.D., and L.G. Sullivan (1981). Benthic storms: Temporal variability in a deep-ocean nepheloid layer, Science213, 329-331.
Heath, G.R., T.C. Moore, Jr., and J.P. Dauphin (1977). Organic carbon in deep-sea sediments, in The Fate of Fossil Fuel CO2 in the Oceans, N.R. Andersen and A. Malahoff, eds., Plenum Publishing Corp., New York, pp. 605-625.
Heggie, D., C. Maris, A. Hudson, J. Dymond, R. Beach, and J. Cullen (1987). Organic carbon oxidation and preservation in NW Atlantic continental margin sediments, in Geology and Geochemistry of Abyssal Plains, P.P.E. Weaver and J. Thomson, eds., Geological Society Special Publication No. 31, 215-236.
Henrichs, S.M., and Reeburgh (1987). Anaerobic mineralization of marine sediments organic matter: Rates and the role of anaerobic processes in the oceanic carbon economy, Geomicrobiology Journal 5, 191-237.
Honjo, S. (1982). Seasonality and interaction of biogenic and lithogenic particulate flux at the Panama Basin, Science 218, 516-518.
Honjo, S., and K.W. Doherty (1988). Large aperture time-series oceanic sediment traps: Design objectives, construction and application, Deep-Sea Research 35, 133-149.
Ingall, E.D., and P. vanCappellen (1990). Relationship between sedimentation rates and burial of organic phosphorous and organic carbon in marine sediments, Geochimica et Cosmochimica Acta 54, 373-386.
Jahnke, R.A. (1986). Pelletal phosphorite precipitation in Peru continental margin sediments, EOS 67, 1007.
Jahnke, R.A., C.E. Reimers, and D.B. Craven (1990). Intensification of recycling of organic matter at the sea floor near ocean margins, Nature 348, 50-54.
Janecek, T.R., and D.K. Rea (1983). Eolian deposition in the northeast Pacific Ocean: Cenozoic history of atmospheric circulation, Geological Society of America Bulletin 94, 730-738.
Karl, D. (1989). The measurement of total C, N and P flux, in Global Ocean Flux Study, Proceedings of a Workshop, National Academy Press, Washington, D.C., pp. 68.
Knauer, G.A., D.M. Karl, J.H. Martin, and C.N. Hunter (1984). In-situ effects of selected preservatives on total carbon, nitrogen and metals collected in sediment traps, Journal of Marine Research 42, 445-462.
Komar, P., R.H. Neudeck, and L.D. Kulm (1972). Observations and significance of deep-water oscillatory ripple marks on the Oregon continental shelf, in Shelf Sediment Transport, Swift, Duane and Pilkey, eds., Dowden, Hutchinson and Ross, Inc., Stroudsburg, Pa., pp. 601-619.
Kulm, L.D., R.C. Roush, J.C. Harlett, R.H. Neudeck, D.M. Chambers, and E.J. Runge (1975). Oregon continental shelf sedimentation: Interrelationships of facies distribution and sedimentary processes, Journal of Geology 83, 145-175.
Lampitt, R.S. (1985). Evidence for the seasonal deposition of detritus to the deep-sea floor and its subsequent resuspension, Deep-Sea Research 32, 885-897.
McCave, I.N. (1975). Vertical flux of particles in the ocean, Deep-Sea Research 22, 491-502.
Murphy, K., and J. Dymond (1984). Rare earth element fluxes and geochemical budget in the eastern equatorial Pacific, Nature 307, 444-447.
Muller, P.J., and E. Suess (1979). Productivity, sedimentation rate, and sedimentary organic matter in the oceans: I. Organic carbon preservation, Deep-Sea Research 26A, 1347-1362.
Pace, M., G.A. Knauer, D.M. Karl, and J.H. Martin (1987). Particulate matter fluxes in the ocean: A predictive model, Nature 325, 803-804.
Pilskaln, C.H., and S. Honjo (1987). The fecal pellet fraction of biogeochemical particle fluxes to the deep sea, Global Biogeochemical Cycles 1, 31-48.
Platt, T., and W.G. Harrison (1985). Reconciliation of carbon and oxygen fluxes in the upper ocean, Deep-Sea Research 33, 273-276.
Poldervaart, A. (1955). Chemistry of the Earth's Crust, in Crust of the Earth, A. Poldervaart, ed., Geological Society of America Special Paper 62, pp. 119-144.
Prahl, F., and R. Carpenter (1984). Hydrocarbons in Washington coastal sediments, in Estuarine and Coastal Shelf Science 18, 703-720.
Prospero, J.M. (1981). Eolian transport to the world ocean, in The Sea, Volume 7, The Oceanic Lithosphere, C. Emiliani, ed., John Wiley and Sons, New York, pp. 801-874.
Romankevich, E.A. (1984). Geochemistry of Organic Matter in the Oceans. Springer-Verlag, New York.
Roth, S.E., and J. Dymond (1989). Transport and settling of organic material in a deep-sea hydrothermal plume: Evidence from particle flux measurements, Deep-Sea Research 36, 1237-1254.
Rowe, G.T., S. Smith, P. Falkowski, T. Whitledge, R. Theroux, W. Proehl, and H. Ducklow (1986). Do continental shelves export organic matter? Nature 324, 559-561.
Silver, M.W., and M.M. Gowing (1991). The ''particle" flux: Origins and biological components, Progress in Oceanography 26, 75-113.
Smith, K.L., and K.R. Hinga (1983). Sediment community respiration in the deep sea, in The Sea, Volume 8, G.T. Rowe, ed., John Wiley and Sons, Inc., New York, pp. 331-370.
Suess, E. (1980). Particulate organic carbon flux in the oceans-surface productivity and oxygen utilization, Nature 288, 260-263.
Soutar, A., S.A. Kling, P.A. Crill, E. Duffrin, and K.W. Bruland (1977). Monitoring the marine environment through sedimentation, Nature 266, 136-139.
Thomson, J., M.S.N. Carpenter, S. Colley, T.R.S. Wilson, H. Elderfield, and H. Kennedy (1984). Metal accumulation rates in northwest Atlantic pelagic sediments, Geochimica et Cosmochimica Acta 48, 1935-1948.
Urrere, M.A., and G.A. Knauer (1981). Zooplankton fecal pellet fluxes and vertical transport of particulate organic material in the pelagic environment, Plankton Research 3, 369-387.
Walsh, I.K., G.T. Rowe, R.L. Iverson, and C.P. McRoy (1981). Biological export of shelf carbon as a neglected sink of the global CO2 cycle, Nature 291.
Walsh, I., K. Fischer, D. Murray, and J. Dymond (1988a). Evidence for resuspension of rebound particles from near-bottom sediment traps, Deep-Sea Research 35, 59-70.
Walsh, I., J. Dymond, and R. Collier (1988b). Rates of recycling of biogenic components of settling particles in the ocean derived from sediment trap experiments, Deep-Sea Research 35, 43-58.
Weliky, K., E. Suess, C.A. Ungerer, P.J. Muller, and K. Fischer (1983). Problems with accurate carbon measurements in marine sediments and water column particulates: A new approach, Limnology and Oceanography 28, 1252-1259.


