
Technological and Trade Competition: The Changing Positions of the United States, Japan, and Germany
PAOLO GUERRIERI
Deep technological changes in the past two decades have profoundly affected all the major economies of the world. Technological change has forced countries to make wide-ranging domestic adjustments and has continuously modified their competitive economic positions. In this respect, the major economies reacted according to different patterns and with different degrees of success.
This essay deals with the three technological leaders—Japan, the United States, and West Germany—and compares their international trade performance and specialization in the past two decades, providing empirical evidence of the differences in their technological levels and innovative capabilities. In effect, trade performance and specialization provide a relatively objective and convenient test of comparative efficiency of industries in each of the three countries.
This essay is in five sections. The first outlines an analytical framework and methodology, explaining why in comparing national technological performances and capabilities not only high-tech products but the entire industrial structure must be considered. A taxonomy of industrial sectors depicts the industrial system of a country not as a simple list of independent sectors but rather as a structure with its own internal hierarchy, characterized by a complex technological interdependence between its various component sectors. The empirical findings of this analysis are presented in the second, third, and fourth sections with an evaluation of changes in the relative competitive positions and technological capabilities of Japan, the United States, and West Germany in the past two decades. The final section provides some concluding comments on these findings.
TECHNOLOGY, INDUSTRIAL STRUCTURE, AND INTERNATIONAL COMPETITIVENESS
Technology is widely recognized as an important factor determining the trade performance and international competitiveness of a country. If we try to define and quantify such technological levels and innovative capabilities of single countries, however, many methodological and empirical problems arise. To face such problems it is helpful to rely on the results of the considerable volume of theoretical and empirical research that has been carried out over the past 15 years on the nature, determinants, and effects of innovative activities.1
In general terms, innovative activity may be viewed as the result of a long and complex process of accumulation and appropriation of a stock of knowledge (technical and managerial). Most of this stock of knowledge, however, cannot be equated with "information" that is generally applicable and easily reproducible. In fact, neither the means and channels for accumulation and appropriation of the stock of knowledge nor the resulting output is the same for all firms and product groups. Technology has a cumulative, firm-specific nature, because it is differentiated in both its technical characteristics and its market application (Cantwell, 1989; Krugman, 1987; Pavitt 1988; Teece, 1986). Processes of technological accumulation tend to assume varying sectoral features, through differences in technological opportunities, sources, and appropriability conditions (Levin, 1984; Scherer, 1986). It follows that the technological content of various product groupings and sectors can be differently defined and quantified according to the typologies and sources of technology being considered.
Technological change also affects a wide range of structural relationships linking different industries (Pavitt, 1984; Scherer, 1982; Schmookler, 1966). Some sectors will be more productive in terms of innovations while others will be users of innovations developed by others. So, the linkages among various parts of the production system can assume great importance, in terms of technological complementarities and interdependencies affecting competitiveness of each sector and hence of the industrial system as a whole (Chesnais, 1986; Dosi et al., 1990, Lundvall, 1988).
These features of technology have important implications for a comparison of technological capabilities and international trade performance of various countries. More traditional taxonomies divide industrial sectors into high and low (or high, medium, and low) technology-intensity groups of products on the basis of indicators of both technological input (R&D expenditures) and output (patents). Such taxonomies are unsatisfactory for evaluating a country's technological capability and international trade performance, because they ignore those prominent differences with respect to the mechanisms of introducing and diffusing technologies, already mentioned,
within and across industrial sectors. Therefore, they tend to reduce technological change to a physiological alternation of "growth" industries (high-tech sectors) and "declining" industries (low-tech sectors).
An alternative and more useful sectoral taxonomy is that developed by Pavitt (1984, 1988) at the Science Policy Research Unit of the University of Sussex, which represents the differences in the opportunities and mechanisms of appropriability of technological innovations characterizing various industrial sectors. In Pavitt's taxonomy, industries are divided into four major groupings according to a combination of sectoral technology sources, user requirements, and means of appropriation (see Figure 1).
The first group, so-called science-based sectors, includes industries such as fine chemicals, electronic components, telecommunications, and aerospace, which are all characterized by innovative activities directly linked to high R&D expenditures. Their product innovations generate broad spillover effects on the whole economic system, and a large number of other sectors heavily rely on them as capital or intermediate inputs.2
A second group—scale-intensive sectors—includes typical oligopolistic large-firm industries, with high capital intensity, wide economies of scale and learning, high technical or managerial complexity, and significant inhouse production engineering activities. Examples are the automobile industry, certain consumer electronics and consumer durables industries, and the rubber and steel industries.
The third group of industries—specialized suppliers—includes most producers of investment goods in mechanical and instrument engineering, such
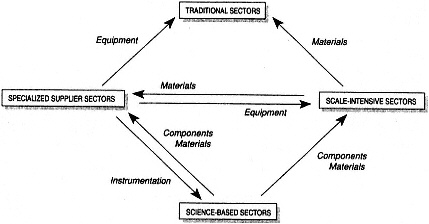
Figure 1 The main technological linkages among different groups of industrial sectors. SOURCE: After Pavitt (1984).
as the machinery for specialized industries (that is, machine tools). It is characterized by a high diversification of supply, high "economies of scope," medium-sized to small companies, and a notable capacity for product innovation that enters most sectors of scale-intensive and supplier-dominated groups as capital inputs.
Finally, there is a group of "supplier-dominated" sectors, which encompass the more traditional consumer and nonconsumer goods industries that are net purchasers of process innovations and innovative intermediate inputs from other suppliers of production equipment and materials (specialized-supplier and scale-intensive sectors, as represented in Figure 1). These sectors are notably sensitive to price competition, but are also influenced by "nonprice factors" such as product design and quality. This group includes textiles, clothing, wood and furniture, leather and shoes, ceramics, and the simplest metal products.
Pavitt's classification of industrial sectors has the merit of emphasizing two key aspects of technological change and innovative activities. First, the technological capability of firms and countries is not linked solely to their R&D expenditure or patent acquisitions since the typologies of innovative activity have industry- and firm-specific characteristics. Second, the linkages among different groups of industries and the related complex technological interdependencies (see Figure 1) are of great importance, because they differently characterize, as shown below, each national system of production and innovation. Such interdependencies are also important to achieving a proper understanding of the links between technological capabilities and international competitiveness at the country level.
Certainly this sectorial taxonomy, as may be expected from any such broad classification, has some limitations, mainly stemming from the heterogeneity of the products included in each group of industries and, in this respect, it requires further validation and elaboration. It nevertheless permits a more accurate assessment of technological capabilities and international trade performance at the level of a country than do more traditional classifications.
The present comparative analysis of the technological and trade competitive positions of the three major leaders in world trade—the United States, Japan, and Germany—therefore makes use of Pavitt's classification. For this investigation, I have employed the SIE-World Trade data base (see Appendix), which I built, together with colleagues at the Institute for Studies on Foreign Trade (Servizi Informativi per l'Estero—SIE) in Rome, by using United Nations and OECD official statistical sources for more than 80 countries (including less-developed countries, newly industrialized countries, and members of the Organization for Economic Cooperation and Development and the former Council for Mutual Economic Assistance). The data base allows us to conduct research on the changing pattern of
world trade at a rather disaggregated level (400 product classes, 98 sectors and 25 commodity groups).
In this study, all traded-manufactured products included in the SIE trade data base at a highly disaggregated level have been classified into four groups (science-based, specialized suppliers, scale-intensive, and supplier-dominated) plus the group of food industries, which is considered separately, for a total of five product groups representing the whole industrial system.3
THE UPSURGE OF JAPAN IN WORLD MARKETS
The present analysis uses a long-term approach (1970–1989) for a clear overall appraisal of the major changes in trade (industrial) structures and performance of three major countries—United States, Japan, and Germany. It also uses a variety of indicators of a country's competitiveness and trade specialization. While no single indicator can provide an adequate view of a country's international trade performance, it is possible to draw fairly reliable conclusions if various indicators are considered together.
Of the three countries, Japan undoubtedly achieved the best trade performance in the past two decades. To evaluate it, the first two sets of indicators employed are both more directly tied to the competitive position of a country; they are worked out below for the manufacturing system as a whole and for all the sectoral groups considered in the preceding section.
The first set of indicators is the share of country exports in world exports with reference to each group of products.4 The performance of market share will be considered over a long period (1970–1989), to overcome the effects of short-run fluctuations and highlight the major trends characterizing the international competitiveness of a given country. The second set of indicators includes trade balances by country either in overall manufacturing or in single sectoral groups standardized by total world trade in each group of products. This indicator highlights the international distribution of trade surpluses and deficits in each group of products by country over time, thus underlining major shifts in relative competitive positions of various countries.5
In trade of manufactured products, Japan's share in world exports has been increasing sharply over the period considered (see Table 1), and standardized trade balances have been growing even more impressively (see Figure 2). Both had partially decreased by the late 1980s, only marginally altering, however, the net gains achieved by Japan in the whole period here considered.
In the case of single sectoral groups, both sets of indicators show a marked improvement in the performance of Japanese industry. The improvement is apparent, first, in science-based sectors, with more than a doubling
TABLE 1 Shares of Selected Countries and Areas in World Trade in Manufacturers* (Percentage shares in values)
|
|
1970– 1973** |
1973– 1976 |
1976– 1979 |
1979– 1982 |
1982– 1985 |
1985– 1988 |
1989 |
1970– 1989 |
|
United States |
13.52 |
13.07 |
12.23 |
12.68 |
12.33 |
10.88 |
11.57 |
-3.45 |
|
Japan |
9.01 |
9.55 |
10.16 |
10.45 |
12.09 |
12.28 |
11.44 |
3.03 |
|
EEC (12) |
48.63 |
48.23 |
48.47 |
46.15 |
42.40 |
43.68 |
43.94 |
-3.62 |
|
Germany, Federal Republic |
15.02 |
15.22 |
14.91 |
13.68 |
12.75 |
13.88 |
13.82 |
-0.7 |
|
France |
7.43 |
7.68 |
7.85 |
7.49 |
6.58 |
6.59 |
6.6 |
-0.53 |
|
United Kingdom |
7.76 |
6.78 |
6.96 |
6.69 |
5.71 |
5.55 |
5.72 |
-2.31 |
|
Italy |
5.58 |
5.35 |
5.83 |
5.85 |
5.59 |
5.72 |
5.7 |
0.15 |
|
Non-OECD Countries |
13.53 |
15.15 |
15.76 |
17.76 |
20.00 |
20.05 |
20.19 |
6.67 |
|
NICs in Asia |
2.53 |
3.40 |
4.24 |
5.24 |
6.83 |
7.63 |
7.44 |
5.36 |
|
* Ratio of national exports to world exports (percentage). ** Average value in each subperiod. SOURCE: SIE-World Trade data base. |
||||||||
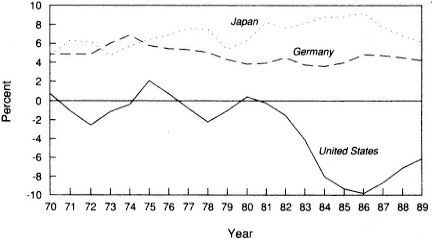
Figure 2 Trade balance in total manufactures. Standardized trade balances are expressed as a percentage of total world trade in manufactures. For methods and sources, see note 5.
TABLE 2 Weights of the Sectoral Groups in Total Exports*
of market shares (from 7.8 percent in 1970 to 16.5 in 1989, see Table 3) and a sharp increase in trade surpluses (+9.2 percent of world trade for this product group, see Table 4). Second, the strengthening is apparent also in the specialized-suppliers sector (mechanical engineering), with considerable gains in Japan's shares in world exports (from 6.4 percent in 1970 to 15.5 in 1989, see Table 5) and rapidly increasing positive trade balances (see Table 6). In the scale-intensive sectors, Japanese industry has further consolidated its competitive position that was already strong in the early 1970s, registering significant losses, however, in the second half of the 1980s (see Tables 7–8). On the contrary, in traditional sectors—such as textiles, clothing, leather, and footwear—the sharp decrease of export shares (Table 9) and the shift from high surpluses to increasing deficits in the late 1980s (Table 10) show that Japanese industry has carried out a relative disengagement from these areas of production, investing heavily abroad and reducing its export propensity.
Through the use of constant market shares analysis (CMSA), applied here with a new method of calculation, the changes in Japan's market share for the manufacturing sector and for various sectoral groups in the period has been broken down into two components: the "structural effect" and the "competitiveness effect," each of which represents a different set of determinants of Japan's trade performance.6
The "structural effect" refers to the geographic and commodity structure of a country's exports relative to the structure and the dynamics of world
TABLE 3 Shares of Selected Countries and Areas in World Trade in Science-Based Sectors* (Percentage shares in values)
TABLE 4 Trade Balance of Selected Areas and Countries in Science-Based Sectors*
TABLE 5 Shares of Selected Countries and Areas in World Trade in Specialized-Supplier Sectors* (Percentage shares in values)
TABLE 6 Trade Balance of Selected Areas and Countries in Specialized-Supplier Sectors*
TABLE 7 Shares of Selected Countries and Areas in World Trade in Scale-Intensive Sectors* (Percentage shares in values)
TABLE 8 Trade Balance of Selected Areas and Countries in Scale-Intensive Sectors*
TABLE 9 Shares of Selected Countries and Areas in World Trade in Traditional Sectors* (Percentage shares in values)
TABLE 10 Trade Balance of Selected Areas and Countries in Traditional Sectors*
TABLE 11 Shares of Selected Countries and Areas in World Trade in High R&D-Intensive Electronic Sectors* (Percentage shares in values)
|
|
1970– 1973** |
1973– 1976 |
1976– 1979 |
1979– 1982 |
1982– 1985 |
1985– 1988 |
1989 |
1970– 1989 |
|
United States |
28.48 |
26.42 |
24.27 |
26.05 |
27.13 |
21.49 |
19.51 |
-13.12 |
|
Japan |
9.43 |
10.77 |
13.06 |
14.21 |
17.44 |
20.22 |
21.47 |
13.68 |
|
EEC (12) |
44.97 |
42.59 |
39.89 |
36.14 |
30.72 |
31.30 |
28.98 |
-14.62 |
|
Germany, Federal Republic |
15.03 |
14.37 |
12.43 |
10.43 |
8.24 |
8.09 |
7.09 |
-6.48 |
|
France |
7.76 |
7.48 |
7.34 |
6.41 |
4.96 |
4.94 |
4.14 |
-3.37 |
|
United Kingdom |
8.02 |
7.55 |
7.31 |
7.18 |
6.69 |
7.05 |
7.08 |
-0.79 |
|
Italy |
5.37 |
4.18 |
3.91 |
3.80 |
3.06 |
3.21 |
3.17 |
-3.06 |
|
Non-OECD Countries |
5.52 |
9.19 |
12.51 |
14.66 |
17.13 |
19.79 |
23.24 |
19.31 |
|
NICs in Asia |
3.36 |
6.33 |
8.43 |
9.20 |
11.20 |
13.95 |
16.21 |
14.12 |
|
* This product group includes data processing equipment, electronic components, and telecommunications equipment. ** Average value in each subperiod. SOURCE: SIE-World Trade data base. |
||||||||
demand. The structural effect will be positive if a country concentrates its export on markets or commodities that grow faster than the world average. This structural effect can be further divided into three elements: (1) the ''market effect'' due to the structure of a country's exports by geographical destination; (2) the "commodity effect" due to the structure of a country's exports by products; and (3) the "specific market-commodity effect" due to the structure of a country's exports by specific market and product groups. The competitiveness effect reflects the actual changes of a country's market shares, assuming that its trade structure is constant, and it represents that part of a country's trade performance deriving from its competitive factors (both price-, and nonprice-related).
The results of CMSA (see Table 12) confirm that Japanese industry achieved the highest gains in the specialized-supplier and science-based industries in terms of both structural and competitiveness effects. This was particularly evident in the 1980s in connection with the deep restructuring process under way after the second oil shock.
Certainly, this sharp strengthening of the competitiveness of Japanese production may be attributed to many heterogeneous factors. It is far from easy to identify them and cannot be attempted within the limits of this paper. In general, however, it may be said that a set of macroeconomic and socioinstitutional factors, together with a unique strategy of industrial
TABLE 12 Results of the Constant Market Shares Analysis of the Exports in a Single Group of Sectors* 1970–1987 (percentage values)
|
|
|
|
Structural Effect |
|||
|
|
Market Share Changes (c)=(d)+(e) |
Effect Competitiveness (d) |
Total (e)=(f)+(g)+(h) |
Market Effect (f) |
Commodity (g) |
Specific Effect (h) |
|
United States, 1970–1987: |
||||||
|
Total: |
-4.86 |
-4.31 |
-0.55 |
-1.12 |
1.02 |
-0.45 |
|
Food Industry |
-0.72 |
-1.2 |
0.48 |
0.7 |
0.23 |
-0.45 |
|
Traditionals |
-3.01 |
-1.87 |
-1.14 |
-0.77 |
-0.25 |
-0.11 |
|
Scale intensive |
-4.74 |
-4.02 |
-0.71 |
-0.52 |
0.5 |
-0.7 |
|
Specialized suppliers |
-11.77 |
-8.25 |
-3.52 |
-2.55 |
-0.66 |
-0.32 |
|
Science based |
-9.39 |
-6.25 |
-3.14 |
-3.48 |
0.01 |
0.34 |
|
Japan, 1970–1987: |
||||||
|
Total |
3.38 |
1.07 |
2.31 |
1.97 |
0.55 |
-0.21 |
|
Food Industry |
-0.93 |
-1.29 |
0.37 |
0.14 |
0.18 |
0.05 |
|
Traditionals |
-5.29 |
-4.77 |
-0.51 |
0.68 |
-0.82 |
-0.37 |
|
Scale intensive |
4.38 |
2.08 |
2.31 |
1.6 |
1.01 |
-0.28 |
|
Specialized suppliers |
8.23 |
4.29 |
3.94 |
3.47 |
0.21 |
0.27 |
|
Science based |
8.36 |
5.52 |
2.84 |
3.57 |
-0.55 |
-0.18 |
|
Asian NICs, 1970–1987: |
||||||
|
Total |
6.17 |
3.85 |
2.32 |
0.93 |
1.04 |
0.35 |
|
Food Industry |
1.74 |
0.88 |
0.87 |
0.06 |
0.3 |
0.5 |
|
Traditionals |
10.87 |
5.26 |
5.61 |
2.58 |
2.71 |
0.32 |
|
Scale intensive |
4.27 |
4.05 |
0.22 |
0.1 |
-0.4 |
0.52 |
|
Specialized suppliers |
3.25 |
2.22 |
1.03 |
0.81 |
0.3 |
-0.08 |
|
Science based |
8.25 |
2.03 |
6.22 |
2.1 |
4.77 |
-0.65 |
|
Germany (Federal Republic), 1970–1987: |
||||||
|
Total |
0.04 |
-0.23 |
0.27 |
-0.56 |
0.22 |
0.61 |
|
Food Industry |
5.6 |
3.32 |
2.28 |
0.95 |
0.36 |
0.97 |
|
Traditionals |
-1.37 |
-0.29 |
-1.08 |
-1.01 |
-0.41 |
0.33 |
|
Scale intensive |
1.42 |
-0.29 |
1.72 |
-0.06 |
1.32 |
0.46 |
|
Specialized suppliers |
-1.82 |
-1.32 |
-0.5 |
-1.01 |
0.43 |
0.07 |
|
Science based |
-2.72 |
-0.57 |
-2.15 |
-1.83 |
-2.24 |
1.92 |
development, contributed to the success of Japanese industry. In this respect, many studies7 have pointed to a significant role played by structural competitiveness factors, especially technological factors.
The latter may be connected with the profound changes that have taken place in the industrial structure and in the patterns of Japan's trade specialization in the past two decades. Japan has adapted to the changing dynamic and commodity composition of world demand, as shown below, much more and better than have the specializations of the other partner countries.
To evaluate Japanese specialization patterns (see Figure 3), an indicator of the contribution to trade balance (ICTB) of a country has been worked out for the various groups of sectors in consideration (Center for International Prospective Studies [CEPII], 1983) (see Figure 2). If the contribution (positive or negative) of each group of sectors to a country's trade balance is proportionally equivalent to its weight in total trade (import plus export), then the values of the ICTB indicator for that group of sectors (or group of products) will be zero. Hence, positive ICTB values indicate those sectoral groups with positive contributions to trade balance greater than their weight in total trade. Therefore, they represent sectors with comparative advantages in the trade specialization of a given country. Opposite considerations are associated with negative ICTB values. They generally identify those commodity groups for which a country depends on other countries (comparative disadvantages) and which generate a relatively high trade deficit.8 The ICTB indicator has been worked out for each year in the period from 1970 to 1989.
In the case of Japan, in the early 1970s, the scale-intensive and traditional sectors represented the strong points (comparative advantages) of the Japanese industry's specialization pattern (see Figure 3). But in the mid-1970s and throughout the 1980s, profound changes took place. Following a deep industrial restructuring process, with unprecedented intensity and quality in the advanced countries, positive contributions to the trade balance
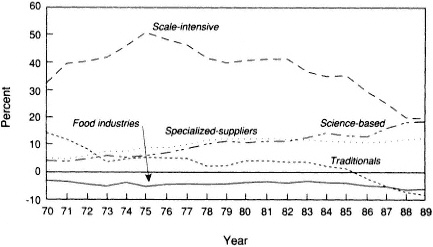
Figure 3 Patterns of trade specialization of Japan. Indicator of comparative advantage (>>0) or disadvantage (<0). For methods and sources, see note 8.
strongly increased: (i) in the case of the R&D-intensive sectors (science-based), by a quadrupling of their indicator ICTB (+14.4 percentage points); (ii) for the specialized-supplier sectors, by a doubling of their ICTB (+7.6 percentage points).
The strengthening of Japanese specialization in R&D-intensive products (science-based) may be largely attributed to the notable gains of Japanese industry in electronics, and particularly in those sectors with the highest technological content. In the latter sectors, such as data processing systems, electronic components, and telecommunications, the increase in market shares since the early 1970s was so impressive that by 1989 Japan became the world's largest exporter of these groups of electronic products (Table 11). In its trade balance, Japanese performance was even more successful, with huge and increasing trade surpluses, which confirmed its supremacy, quite sharply in most electronic sectors (see Figure 4).
The adoption of the most advanced product and process innovations, mostly imported from the United States, the lower costs linked to firm organization and large-scale production processes, aggressive industrial and trade policies have all contributed to the rapid rise of the Japanese electronics industry in international markets, which severely penalized most U.S. and European productions, as shown below. The use of new electronic tech-
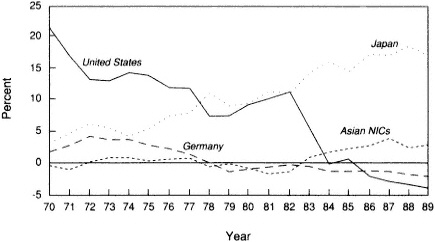
Figure 4 Trade balance in R&D-intensive electronics sectors. This group of sectors includes data processing equipment, electronic components, and telecommunications equipment. Standardized trade balances are expressed as a percentage of total world trade in R&D-intensive electronics sectors. For methods and sources, see note 5.
nologies, on the other hand, also sustained the strengthening of Japanese specialization in specialized-supplier sectors (Figure 3), and particularly in machinery for specialized industries, such as numerically controlled machine tools. Together with the increase in comparative advantage in science-based and specialized-supplier sectors, the evolution of Japanese specialization patterns reveals that the contribution of scale-intensive sectors to the trade balance has significantly decreased since the second half of the 1970s and was equivalent to that of science–based sectors in 1989 (see Figure 3).
A new element has been the great reduction in the role of traditional sectors, which registered negative ICTB indicators in the second half of the 1980s, following a decrease of more than 22 percentage points [from 14.45 (1970) to -8.28 (1989)] since the early 1970s (Figure 3). The share of exports of traditional goods in total Japanese exports has also strongly declined in the past two decades, while there has been a notable symmetrical increase of the share of the R&D intensity group (see Table 2).
Thus, the evolution of Japan's trade specialization pattern has been characterized by a dynamic reallocation of productive resources, oriented toward a marked strengthening of the science-based and specialized-supplier sectors in the 1980s. To the extent that technological change is increasingly dependent on the quality and intensity of interaction between producer and user sectors of the innovation (Lundvall, 1988), in the case of Japan these intersectoral transmission mechanisms of innovation functioned properly (as between science-based and specialized-supplier sectors) and help to explain the strengthening of the Japanese competitive position in the period considered.
To sum up, Japan's performance shows clear-cut patterns: a rapid growth in the export of manufactures in a restricted number of sectors and a substantial shift in specialization patterns. Both of these trends are based on growing technological capability, apparently enhanced by strong intersectoral dynamics in the generation and dissemination of innovation and have led Japanese industry to achieve the best results of the three most advanced countries with respect to nearly all indicators.
In recent years, however, Japan has had to face both the revaluation of the yen and growing protectionist barriers. The first reaction has been a significant increase in imports of manufactures and an upsurge in direct investments abroad, particularly in the U.S. market. Furthermore Japan is now undergoing a changing growth pattern, bound also to modify the organization of its productive structure to facilitate radical innovations in addition to the incremental innovations that characterized its strategy in the past. It is too early for any sound forecast on this transition phase.
THE DETERIORATION OF THE U.S. COMPETITIVE POSITION
The relative decline in the U.S. international competitive position throughout the 1970–1989 period contrasts with the relative rise of Japan. The evolution of aggregate trade flows since the late 1970s shows that the pattern of U.S. industry's competitiveness has changed in a way diametrically opposed to that of Japan.
The U.S. share in world export of manufactures experienced a significant decrease from 1970 to 1989, which is distributed over the entire period (see Table 1). The results of CMSA (Table 12) show that this decrease is wholly attributable to a loss of U.S. industrial competitiveness both in the 1970s and in the 1980s, because structural effects, comprising a positive commodity effect and a negative market effect, on the whole played only a marginal role.
Further evidence that the U.S. trade performance in the past two decades was anything but positive stems from trade balance patterns in total manufactures. The U.S. deficit in total manufactures grew enormously in the first half of the 1980s (Figure 2). After the first oil shock, the U.S. economy, unlike all other advanced economies, was not able to counterbalance growing oil deficits with trade surpluses in manufactures. Despite the depreciation of the dollar in the second half of the 1970s, the manufacturing trade balance improved only marginally. An appreciation of the dollar's exchange rate until 1985 led to an enormous increase in the U.S. deficit, which decreased only partially in the most recent years.9
Further evidence of this overall deterioration can be seen in the evolution of U.S. competitiveness in various sectoral groups, because it has followed quite different patterns. The most negative results have been those in specialized-supplier sectors—such as machine tools—and in science-based sectors, especially electronics.
In specialized suppliers, U.S. industry sharply declined in the 1970s or in the 1980s, accumulating a large decrease in its share of world exports (from 22.8 percent in 1970 to 14.4 percent in 1989) (Table 5) and in its trade surplus (-15.3 points in percentage of total world trade of this sectoral group) (Table 6). The CMSA results demonstrated that these losses can be mostly attributed to a strong deterioration in the competitiveness of U.S. specialized-supplier sectors (see Table 12), to the advantage of Japanese, German, and Italian industries. In the late 1980s, following the dollar's strong depreciation, the U.S. competitive position in specialized suppliers registered a relative improvement, but the notable trade deficit accumulated with Germany and the deficit with Japan decreased only marginally.
In science-based sectors, U.S. industry maintained a positive trade balance even in the 1980s. These sectors, however, manifested a sharp de-
crease in their share of world exports (from 29.2 percent in 1970 to 20.2 percent in 1989). In this respect, it is in the electronics sector of science-based groups that American firms suffered the heaviest losses, as a consequence of the rapid and strong rise first of Japanese firms and then of those in the Asian newly industrializing countries (NICs).
In the early 1970s, U.S. industry enjoyed a position of relative strength and supremacy in most areas of electronics. Over the past two decades, however, in successive periods of decline affecting first electronic office products, then electronic components and, most recently, data processing equipment, the United States registered a marked deterioration in its competitive position. The notable decrease in market shares (see Table 11), particularly when considered together with the strong decline in trade balances over the past decade (see Figure 4), is clear evidence of the significant loss of competitiveness of U.S. electronics industries as a group.10 It should be underlined that in the late 1980s the U.S. competitive position despite the dollar's strong devaluation has continued to deteriorate, as shown by trade data. Therefore, although U.S. firms continue to hold a strong competitive position in certain key sectors of electronics (e.g. information technologies), figures for the 1970–1989 period clearly demonstrate that there has been a distinct shift in relative strength in favor of the Japanese industry for the electronics complex as a whole.
In traditional sectors the U.S. economy also experienced a declining market share and a growing trade deficit, primarily in the past decade (see Tables 9–10). At the same time, losses in scale-intensive industries were equal to those registered by the manufacturing sector as a whole (Tables 7–8).
Two sets of contrasting interpretations have emerged to account for this overall negative performance of U.S. industry: (i) a rather optimistic view attributing the decline in competitiveness to cyclical factors, particularly the 1980s appreciation of the dollar; (ii) a more negative view, which sees the decline as the result of long-term and pervasive structural ills of U.S. industry.11
The first of these interpretations is supported by the negative U.S. export performance in the first half of the 1980s, which may also be attributed to adverse cyclical trends (for example, the strong and prolonged appreciation of the dollar and the negative domestic growth differentials), and which may partly account for the rise in the U.S. trade deficit in this period.
But the current difficulties of U.S. industries cannot be explained solely by these relatively recent events. As has been shown above, in many cases indicators reveal negative trends dating from the second half of the 1970s and continuing into the late 1980s. Similarly, the sharp decrease in the market shares of U.S. industries, as indicated by CMSA results, is largely attributable, especially in science-based and specialized-supplier sectors, to
a loss of competitiveness of U.S. production over the course of the entire 1970–1989 period, rather than to negative cyclical effects of product and market composition (see Table 12).
The foregoing discussion leads to the conclusion that the relative decline of the U.S. competitive position also derives, as the second more negative set of interpretations maintained, from structural disadvantages. These should not be easy to neutralize, even in the presence of a significant reversal of trends in the exchange rate of the dollar, as has been the case. The major structural problems associated with the competitiveness of U.S. firms have been identified elsewhere. They include a decline in many sectors of a formerly uncontested technological leadership; a trend toward decreasing productivity; an inadequate development of process innovations, particularly in the incremental type; and the gradual obsolescence of management and organizational models for production (Cohen and Zysman, 1987; Dertouzos et al., 1989; Teece 1987). These are multifaceted problems requiring complex solutions, the results of which will become evident only in the medium-long term.
Indirect evidence of the above conclusion lies in the evolution of the trade specialization pattern of U.S. industry (see Figure 5). U.S. comparative advantages have been, and are increasingly, concentrated in R&D–intensive (science-based) product groups, most of which are characterized by high growth rates in world demand.12 The role of science-based exports with respect to total exports of U.S. manufactures is also important and has been rising in the past decade (Table 2). The other strong point of U.S. specialization is food industries, as is demonstrated by its increasing comparative advantage in this area in the 1980s (see Figure 5).
In the scale-intensive industries (particularly automobiles) and traditional industries (especially textiles and clothing) on the other hand, there has been a consolidation of a relative despecialization of the U.S. industry in the past two decades. After sharp fluctuations, including a period of recovery in the 1970s and a subsequent phase of deterioration of equal magnitude in the 1980s, comparative disadvantages in both of these sectors at the end of the period were virtually equal to those at the beginning of the 1970s.
The new element in the evolution of the U.S. pattern of specialization is the sharp decrease in the positive contribution to the trade balance (ICTB) of the specialized-supplier sectors such as machine tools (-9.4 percentage points), although they maintained a comparative advantage position in the late 1980s (see Figure 5). These sectors also experienced a significant decline in their share of total U.S. exports of manufactures (see Table 2).
This trend is indicative of increasing difficulties of U.S. industry in transforming high-level scientific and research capability that continues to be generated in the United States into innovative activities and products with significant commercial value in the other manufacturing sectors. The
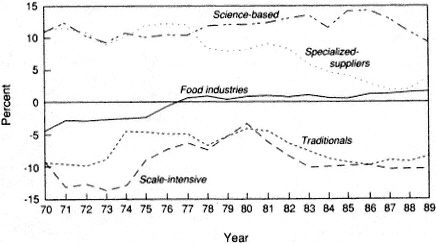
Figure 5 Patterns of trade specialization of the United States. Indicator of comparative advantage (>>0) or disadvantage (<0). For methods and sources, see note 8.
relationship between the U.S. specialization in R&D-intensive products and the overall negative trade (industrial) performance indirectly demonstrates that the availability of sources of "primary" innovation (high-tech sectors) certainly constitutes a competitive advantage for a country, but it is not a sufficient condition to ensure rapid technological progress in its industry as a whole. If intersectoral technological links play an increasingly important role in the process of development and diffusion of primary innovation throughout the economy, they did not function properly in the United States. The inference that can be drawn tentatively is that ineffective linkages impeded positive technological adjustment in many "user" sectors, such as the specialized suppliers.
Thus, the patterns of U.S. trade performance and specialization analyzed here demonstrate that it is the combination of adverse cyclical macroeconomic factors and long-standing competitive disadvantages of a structural type that account for the relative deterioration in the international standing of the U.S. economy. Although it is true that the United States maintains a position of relative strength in industrial structure in science-based sectors, its specialization appears increasingly threatened by the rise of Japan and other Asian countries in many important industries, such as electronics and machine tools.
More recently, with the strong depreciation of the dollar, trade performance of U.S. industry has improved especially in export growth. However, the production restructuring necessary to bridge the competitive gaps
generated by adverse trends in the past still appears to be a long and difficult process.
THE STABLE PATTERNS OF GERMANY'S TRADE PERFORMANCE
The patterns of trade performance and specialization of West Germany in the past two decades have been more complex than those of the United States and Japan, and do not provide the basis for such clear-cut conclusions. West German market shares have remained rather stable with respect to world exports of manufactures, reabsorbing in the late 1980s the loss suffered over the first half of the same decade. The CMSA reveals that this stability was largely attributable to a positive ''structural'' effect associated with a favorable commodity export composition, which compensated for both a negative "competitiveness" effect and especially an unfavorable market effect. Trends in Germany's trade balance in total manufactures appear more satisfactory, showing highly positive values throughout the entire period despite significant fluctuations.
This general evolution in Germany's competitiveness, however, is sharply differentiated with respect to the performance in various sectoral groups. First, the competitiveness of German industry in scale-intensive industries, especially automobiles, chemicals, and pharmaceuticals, was very strong in the past and maintained high levels in the 1980s, as demonstrated by fluctuating but high market shares and trade surpluses (see Tables 7–8). It should be underlined, however, that improvements in the trade surplus in the 1980s mostly derived from the net gains attained by Germany in intracommunity trade, which overcompensated the deterioration of German trade balance toward the external areas, and particularly Japan (Guerrieri and Milana, 1990).
The German competitive position has also remained firm in specialized supplier sectors (machine tools) with highly positive trade balances and market shares, which were the highest of all major industrialized countries. It should be noted, however, that German market shares decreased slightly during both the 1970s and the 1980s, and such decrease may be attributable, as shown by the CMSA, to a loss of competitiveness in the same period.
It should be recalled that specialized-supplier industries (especially industrial machinery) have undergone a radical restructuring through renewed production processes in the past decade. In these technical transformations, an important role has been played by technological factors, first through the introduction of high-tech materials and components, especially electronic devices, in production processes. The solid overall competitive position of German industry in these sectors provides clear evidence of both the effec-
tive production restructuring and the profound technological change that characterized German firms in the past decade.
In traditional products, there was a slight decrease in Germany's market shares together with negative trade balances, although an average stable level was maintained with some fluctuations throughout the 1980s. It should be underlined that German industry has defended its position against the upsurge of exports from Asian NICs in these sectors much better than have other countries in the European Community, such as France and the United Kingdom.
Finally, in science-based sectors Germany's competitive position, which was relatively strong in the early 1970s, experienced a net deterioration in the 1980s. The normalized German trade balance maintained positive and high values by the early 1970s but sharply declined in the 1980s, following an opposite trend with respect to the surplus of Japan in the same period. By the early 1970s, Germany's trade surplus in science-based sectors was significantly higher than that of Japan; by the late 1980s it fell to about one-sixth of the latter. German market shares with respect to world science-based exports also registered a notable decrease (from 17.3 percent in 1973 to 11.8 in 1989). As shown by the results of CMSA, that decrease was caused by a negative structural (market and commodity) effect together with a loss of competitiveness, which was wholly attributable to negative performance in the 1980s.
It must be emphasized that this negative performance is attributable almost entirely to the significant deterioration of the German competitive position in almost all the electronics sectors of science-based group. In fact, in data processing systems, electronic office equipment and electronic components, German industry suffered a significant decrease in its market shares and an increase in trade deficits to the advantage of Japan primarily and of Asian NICs to a lesser extent (Table 11, Figure 4).13 In the other sectors of science-based (R&D-intensive products) group, on the other hand, German industry maintained or strengthened its competitiveness (such as in chemicals and pharmaceuticals, electrical machinery, and engineering instruments). These trends in the competitive position of Germany are fully confirmed by its patterns of specialization, which remained relatively stable over the 1970–1989 period, as shown in Figure 6.
The strong points of German specialization have always been and remain scale-intensive and specialized-supplier industries, which by the late 1980s gave highly positive contributions to the trade balance (respectively, 9.5 and 8.0 percentage points). The ICTB indicator in scale-intensive sectors in the past two decades shows high and stable levels of specialization in German industry, which maintained sound comparative advantages in this product group, especially in motor vehicles, rubber products, and chemicals and pharmaceuticals.
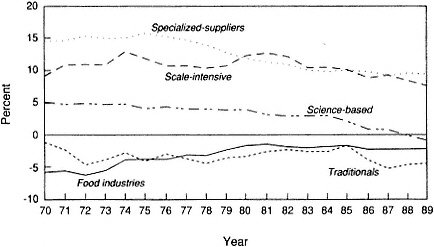
Figure 6 Patterns of trade specialization of the Federal Republic of Germany. Indicator of comparative advantage (>>0) or disadvantage (<0). For methods and sources, see note 8.
The specialized-supplier sectors of mechanical engineering, despite a notable decrease of their indicator ICTB (-5.1 percentage points from 1970 to 1989), have continued to represent the other fundamental pillar of German specialization, as demonstrated by the high comparative advantages maintained by the German industry in machine tools and machinery for specialized industries, which, it must be recalled, are vital investment goods for many manufacturing industries.
The patterns of the German specialization show a remarkable stability also in their weak points. The comparative disadvantages are concentrated, as in the past, in traditional industries and in agro-industrial products. In the latter case the German economy has notably improved its position by virtue of a highly protectionist agricultural policy in the European Community.
In contrast to these areas of stable strength and weakness, the German specialization patterns reveal a declining trend in science-based industries, where the ICTB indicator registered a considerable progressive decrease, declining from the highly positive values in the early 1970s (4.9 percentage points) to negative values in the late 1980s. This negative outcome is mostly attributable to the electronics sectors (data processing systems, electronic components) within the science-based group, confirming the deterioration of the competitive position of the German industry in electronic products that represent vital input in the restructuring of manufacturing currently under way in all major countries.14
This consolidated structure of German specialization has favored at least in the 1980s a rapid diffusion of technical progress in the chemical and mechanical branches through a strong and positive interaction between innovation producer sectors and innovation user sectors. The evolution of the competitive position of German industry is thus one of renewed strength with respect to its partners in the European Community. The position of West Germany, however, is similar to that of several other European countries in science-based sectors (Guerrieri, 1991), and especially in sectors of key strategic importance for “primary” innovation such as electronics, where German industry has a wide and increasing disadvantage with respect to Japan and the United States.
CONCLUDING REMARKS
The rapid development of world trade in the past two decades was accompanied by profound changes in the product and market patterns of trade flows. The new shape of the international trade environment, together with the new technological opportunities stemming from accelerated growth of product and process innovations, affected all the major countries and accelerated structural adjustments in their industries.
Most world trade in manufactured products today involves a two-way exchange of fairly similar goods at sectoral levels (intraindustry trade) between countries that are increasingly similar in their classical factor endowments. However, this similarity has not led to a convergence in the pattern of international trade in the industries of the most advanced countries, quite the contrary. As this essay has demonstrated, the process of trade (industrial) adjustment has follow different patterns in the three major economies, and it has met with very different success. Each major country presents a different structure of trade specialization (comparative advantages) and technological trajectories. These national differences increased rather than diminished in the past two decades, bringing about major changes in countries’ relative competitive positions.
Among the major countries, Japan undeniably achieved the best trade performance in the past two decades, as all indicators used here demonstrate. This notable progress on international markets may be attributed to the profound changes in the patterns of Japan’s trade specialization in the past two decades. It has adapted to the changing dynamics and commodity composition of world demand much more and better than have the specializations of the other two major countries, sharply strengthening both specialized-supplier and R&D-intensive (science-based) sectors, particularly electronics. The case of Japan provides evidence that technological factors can deeply influence the competitive position of a country in the world market. Only Japan among the three leading countries has developed in the
past two decades and is now relying on a technological trajectory and specialization pattern based on both science-based and production-intensive sectors, such as scale-intensive and specialized suppliers. Given this domestic coherence, Japanese industry was apparently able to exploit positive intersectoral transmission mechanisms of innovation, as between science-based and specialized-supplier sectors, assuring an adequate functioning of the intersectoral network of generation and dissemination of innovation at the level of the industry as a whole.
The relative decline of the United States is largely parallel to the relative advance of Japan. The United States suffered a marked deterioration in its international competitive position, especially in science-based and specialized-supplier industries. Almost all the indicators provide unequivocal signs of this competitive decline, which may be attributed not only to cyclical factors, but mostly to long-term structural competitive disadvantages that will not be easy to neutralize. The United States still enjoys outstanding comparative advantages in R&D-intensive product groups, but it suffered notable despecialization trends in scale-intensive sectors—consolidating a weak position that was already evident in the 1970s—and in specialized suppliers, which instead suffered heavy losses in the 1980s. These trends seem to show that U.S. industry has increasing difficulties in transforming its high-level research capability into innovative activities and competitive industrial products. Furthermore, the case of the United States demonstrates that the technological capability of a country is a difficult concept to define and quantify, since each major country has a very different pattern of technological and trade competitive advantages, and since no general common pattern exists. A competitive position in sources of “primary” innovation, such as high-tech (science-based) sectors, as in the case of the United States, is not a sufficient condition for assuring a given country a positive trade performance. We can tentatively conclude that the dynamism of the innovation process increasingly depends on the intensity and the quality of the interaction between the innovation-producing sectors and the user sectors. This interaction has been anything but positive in U.S. industry in the past decade. Certainly, it is extremely difficult to define and quantify these interindustry flows of technology, and additional research is needed to demonstrate how it affects the dynamics of innovation in each individual sector, and the overall pattern of technological change in each country.15
The patterns of trade performance and specialization of West Germany have been more complex and do not provide the basis for clear-cut conclusions. On the one hand, the competitive position of German industry was sound in the past and strengthened in the 1980s in specialized-supplier and scale-intensive industries; in traditional product and above all in science-based sectors, on the other hand, the West German economy registered negative results on the whole.
The German trade specialization pattern is substantially different from those of Japan and the United States in having technological and trade competitive advantages in production-intensive sectors, such as scale-intensive and specialized-supplier sectors, and in showing a despecialization trend in high-technology goods, especially in electronics. It is true that in the 1980s this established structure led to a rapid diffusion of technological progress in the chemical and mechanical industries, through a favorable interaction between innovation producer and user sectors, as shown by the positive trade performance of the German economy in the above products in the past decade. Yet the capability of Germany to retain the leadership role it now holds seems increasingly to depend on its ability gradually to offset its competitive weakness in electronics.
NOTES
REFERENCES
Bergsten, C. F. 1988. America in the World Economy: A Strategy for the 1990s. Washington, D.C.: Institute for International Economics.
Bremond, J., C. Chalaye-Fenet, and M. Loeb-Pellissier. 1987. L'Economie Du Japon. Une menace ou un modele? Hatier, Paris.
Cantwell, J. A. 1989. Technological Innovations and Multinational Corporations. Oxford, England: Basil Blackwell.
CEPII [Center for International Prospective Studies]. 1983. Economie mondiale: La monte des tensions. Economica, Paris.
CEPII [Center for International Prospective Studies]. 1989. Commerce international: La fin des avantages acquis, Economica, Paris.
Chesnais, F. 1986. Science, Technology and Competitiveness. OCSE STI Review n1.
Cohen, S., and J. Zysman. 1987. Manufacturing Matters: The Myth of a Post Industrial Economy. New York: Basic Books,
De Bresson, C. 1988. Dimensions interindustrielles du developpement technologique, Universite du Quebec a Montreal, CREDIT, Working Paper no. 88-08.
Dertouzos, M. L., R. K. Lester, and R. Solow. 1989. Made in America: Regaining the Productive Edge. New York: Harper & Row.
Dosi, G., C. Freeman, R. Nelson, G. Solverberg, and L. Soete, eds. 1988. Technical Change and Economic Theory. London: Frances Pinter.
Dosi, G., K. Pavitt, and L. Soete. 1990. The Economics of Technical Change and International Trade , Wheatsheaf, Brighton.
Freeman, C. 1982. The Economics of Industrial Innovation, London: Frances Pinter.
Freeman, C. 1987. Technology Policy and Economic Performance: Lessons from Japan. London: Frances Pinter.
Guerrieri, P. 1991. Technology and International Trade Performance of the Most Advanced Countries, BRIE Working Paper, University of California, Berkeley.
Guerrieri, P., and C. Milana. 1990. L'Italia e il commercio mondiale, II Mulino, Bologna.
Krugman, P. 1987. The Narrow Moving Band, the Dutch Disease, and the Competitive Consequences of Mrs. Thatcher: Notes on Trade in the Presence of Scale Dynamic Economies. Journal of Development Economics 27:41-55.
Lawrence, R. 1984. Can America Compete? Washington, D.C.: The Brookings Institution.
Levin, R. 1984. Survey Research on R&D Appropriability and Technological Opportunity. New Haven: Yale University Press.
Lundvall, B. A. 1988. Innovation as an interactive process: From user- producer interaction to the national system of innovation. In Technical Change and Economic Theory, G. Dosietac, ed. London: Frances Pinter.
Magee, S. P. 1975. Prices, incomes, and foreign trade. In International Trade and Finance, Frontiers for Research, P. B. Kenen, ed. Cambridge, England: Cambridge University Press.
Milana, C. 1988. Constant-market-shares analysis and index numbers theory. European Journal of Political Economy 4:453-478.
Mohnen, P. 1990. New Technologies and Interindustry Spillovers, OECD STI Review, 7: 131-147.
Pavitt, K. 1984. Sectoral Patterns of Technical Change: Towards a Taxonomy and a Theory. Research Policy 13:343-373.
Pavitt, K. 1988. International Patterns of Technological Accumulation, Strategies in Global Competition, N. Hood and J. E. Vahine, eds. London: Croom Helm.
Rosenberg, N. 1982. Inside the Black Box. Cambridge, England: Cambridge University Press.
Saucier, P. 1987. Specialisation Internationale et Competitivité de l'Economie Japonaise, Economica, Paris.
Scherer, F. M. 1982. Inter-industry technology flows in the United States, Research Policy 11:227-245.
Scherer, F. M. 1986. Innovation and Growth. Schumpeterian Perspectives. Cambridge, Mass.: MIT Press.
Schmookler, J. 1966. Invention and Economic Growth. Cambridge Mass.: Harvard University Press.
Teece, D. J. 1986. Profiting from technological innovation. Research Policy 15(6):285-306.
Teece, D. J. 1987. The Competitive Challenge. Strategies for Industrial Innovation and Renewal. Cambridge, Mass.: Ballinger.
APPENDIX
SIE-WORLD TRADE DATA BASE
The world foreign trade statistics used for the analysis in this paper are taken from a data base developed at Servizi Informativi per l'Estero (SIE) in Rome. The SIE-World Trade data base provides detailed information on exports and imports of 83 countries with respect to 400 product groups, 98 sectors, 25 broad commodity groups, and 5 main product categories.
The data base includes trade statistics for the 24 OECD countries, NICs, other developing countries, and the former CMEA countries, making it possible to examine and analyze the entire world trade matrix. The sources of these statistics are OECD and United Nations publications, provided on magnetic tapes.
The SIE data base is organized in different product group classifications at various levels of disaggregation (400 product groups, 98 sectors, 25 categories, 5 branches) according to the three Standard International Trade Classifications (SITC), Revised, and Revision 2, and Revision 3, defined by the Statistical Office of the United Nations (1961, 1975, 1986) for the periods 1961–1975 and 1978–1987, 1988 on.
The broad product group classification used in this paper is based on the 400 product groups of the SIE-World Trade data base. A summary list of the product groups included in each class is reported in Guerrieri (1991). A complete list of the products included in each group could be provided by the author on request.
REFERENCES
United Nations. 1961. Standard International Trade Classification, Revised, Department of Economic and Social Affairs, Statistical Office of the United Nations, Statistical Papers, Series M, No. 34, New York .
United Nations. 1975. Standard International Trade Classification, Revision 2, Department of Economic and Social Affairs, Statistical Office of the United Nations, Statistical Papers, Series M, No. 34/Rev. 2, New York.
United Nations. 1986. Standard International Trade Classification, Revision 3, Department of Economics and Social Affairs, Statistical Office of the United Nations, Statistical Papers, Series M, No. 34/Rev. 3, New York.


