
Appendix B
Yucca Mountain: Ground-Water Flow
Sabodh Garg
S-Cubed
San Diego, California
Revised October 3, 1991
INTRODUCTION
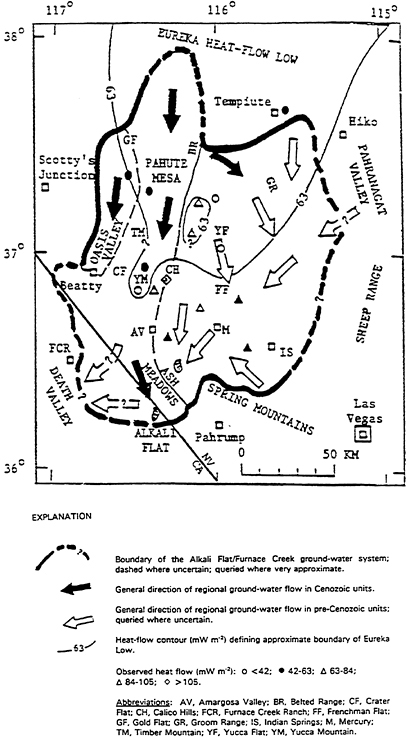
Yucca Mountain in southern Nevada—the potential site for a repository for high-level nuclear wastes —lies within the Alkali Flat/ Furnace Creek subdivision of the Death Valley Ground-water System (see Figure 1). The regional ground-water system also includes the Ash Meadows and Oasis Valley subbasins. The ground-water flow within all the three subbasins is generally in a north-south direction (Figure 1). The principal aquifers in the Alkali Flat/Furnace Creek subdivision are in Cenozoic (66 Ma-Present) alluvium and tuff formations. Although Paleozoic carbonates are thought to underlie the alluvium/tuff aquifers, the carbonates have been so far encountered in a single borehole (UE-25p#1) drilled to the southeast of Yucca Mountain. Additional drilling and other investigations are required to clarify the role of Paleozoic carbonates in the vicinity of Yucca Mountain.
The ground-water system in the Alkali Flat/Furnace Creek subdivision has been modeled by Czarnecki and Waddell (1984). These authors used a two-dimensional (areal) finite element model to simulate the steady-state ground-water flow occurring in tuffaceous, alluvial and carbonate rocks. The steady-state ground-water model was employed by Czarnecki (1985) to investigate the effects of increased precipitation on ground-water levels in the Yucca Mountain area. Prior to describing these models, it is useful to review the hydrologic data set in the Yucca Mountain area. The principal components of a ground-water model are (1) the amount and location(s) of recharge and discharge, (2) the permeability structure, and (3) the three-dimensional distribution of fluid pressure (or equivalently hydraulic heads). The available relevant hydrologic data in the vicinity of Yucca Mountain are briefly discussed in Section 2. The modeling work is then reviewed in Section 3. Finally, recommendations for further work are outlined in Section 4.
HYDROLOGIC DATA SET
The fluid flow in the saturated zone of the Alkali Flat/Furnace Creek subbasin (especially in the northern part of the subbasin) occurs mainly within fractures in the rocks. In a fracture flow system, a well drilled into the aquifer does not simply penetrate a formation with uniform permeability. The permeability of a rock, sediment, or soil refers to the relative ease with which a fluid can flow through, and depends on the amount of interconnected pores or spaces. It is measured in terms of the rate of passage of fluids in a unit called the millidarcy. The bulk of the aquifer permeability is due to a network of fractures. The performance of a bore hole monitoring well depends largely upon whether it intersects one or more fractures, how large each intersected fracture is, and how well it is connected to the rest of the network. The well, for all practical purposes, is open to aquifer fluid only at the depth(s) where it intersects such a fracture, and for the balance of its depth the well penetrates rock that is essentially impermeable. This situation is comparable to a well drilled into a thick sandstone, which has been fully cased, or lined with some impenetrable material, that is perforated at a few unknown depths. The methods for determining the major permeable horizons (also feedpoints or fluid entries) have been discussed, among others, by Grant et al. (1982). It is worth emphasizing here that fluid pressure (or hydraulic head) measured in a bore hole, or well, is in equilibrium with the reservoir pressure only at the level at which the water enters the well (the principal feedpoint). Elsewhere, in the well, the
pressure (head) measured in the well, will not in general correspond to the overall pressure in the aquifer. For a well with two (or more) feedpoints, the pressure in the well will only equal the aquifer pressure at a depth somewhere in between the two feedpoints.
Permeability Structure
The present knowledge regarding the permeability structure of the saturated zone in the Yucca Mountain area is derived from (1) repeat temperature surveys in wells, (2) measurements on cores recovered from wells, (3) analyses of the response of UE-25C#1, UE-25C#2, UE-25C#3, and UE-25p#1 wells to barometric and tidal loadings, (4) slug tests, and (5) pumping tests. Repeat temperature surveys can be used to deduce the location (or lack thereof) of major feedpoints. Available temperature data (see Szymanski, 1989 plates 4.3.3.3 to 4.3.3.38) indicate multiple feedpoints and internal flow in several wells (J-13, UE-25b#1, UE-25p#1, VH#2, G-2, H-4, H-5, H-6; see Figure 2 of this report for well locations). Significantly, the internal flow appears to be in a downward direction in some cases and in an upward direction in other cases; this implies that there is no systematic increase or decrease in hydraulic potential with depth. Wells G-1 and H-1 (below 650 meters only), drilled to the north of the proposed boundary of the repository, and wells G-3 and H-3, located just south of the boundary, are all characterized by conductive temperature profiles. A conductive temperature profile generally indicates poor formation permeability. It is thus possible that tuffs, both to the north and the south of the repository site, have poor permeability.
Permeability measurements made on cores recovered from several wells in the Yucca Mountain area have been tabulated by Szymanski (1989; plate 4.2.2.1). Generally speaking, the core data indicate a low permeability (K=3 × 10⁻⁷ to 10−3 meters per day (m/d), or equivalently k = 0.3 microdarcy (µdarcy) to 1 millidarcy (mdarcy) for the various tuff units. Galloway and Rojstaczer (1988) have analyzed the frequency response of water levels in wells UE-25C#1, UE-25C#2, UE-25C#3, and UE-25p#1 to earth tides and atmospheric loading; the inferred vertical permeability ranges from 0.8 × 10⁻³ m/d to 5 × 10⁻³ m/d (or equivalently kvertical = 0.9 to 6 mdarcy). The tuff vertical permeabilities derived by Galloway and Rojstaczer (1988) are thus comparable to the measured permeability values in cores. While it is by no means certain that the tuff vertical permeabilities are low throughout the Yucca Mountain area, the available data nevertheless indicate a small vertical permeability.
Permeability tests have also been performed in sections (isolated
by packers) of several boreholes (see Szymanski, 1989; plates 4.2.2.6 to 4.2.2.11C). Data are available from both injection (water forced into the well) and pumping (water discharged from the well) tests. The injection tests were of the “slug test” variety. The “slug tests” data are often influenced by near wellbore effects (well damage and storage), and the inferred permeability values are not very reliable. Some of the slug tests performed in the Yucca Mountain wells (see e.g. plates 4.2.5.4-36 to 4.2.5.4-38 in Szymanski, 1989 for well H-3) exhibited an anomalous fall-off response (i.e. an abrupt break to the right of the graphic representation of the fluid behavior in the well). This anomalous response can be characteristic of a well with multiple feedzones. Szymanski (1989) has interpreted the slug test data to indicate the state of the minimum horizontal stress in the crust. However, there does not appear to be a sufficient theoretical basis for Szymanski's interpretation. The estimates of minimum horizontal stress derived from slug test data by Szymanski (1989) are significantly lower than those obtained from hydraulic fracturing tests whereby water forced into the rocks under high pressure cause the rocks to break in directions that tell something about the crustal state of stress. Despite our misgivings regarding Szymanski's interpretation of slug tests, it is fair to state that the pressure responses seen in “slug tests” have not been satisfactorily explained so far and deserve further investigation.
The available pumping test data for wells (H-l, H-3, H-4, H-6, UE-25b#1 and UE-25p#1) in the Yucca Mountain area have been summarized by Szymanski (1989; plates 4.2.2-6-4.2.2-11C). Permeabilities indicated by pumping tests are generally in accord with interpretations from repeat temperature surveys. Little or no permeability is observed in the “conductive temperature profile” regions of wells. The bulk of the permeability appears to be at or near the locations of major feedpoints. As an example, temperature data for well UE-25p#1 show an isothermal (unform temperature) zone from ~1210 to ~1400 meters; an isothermal zone implies permeability at both its end points. Pumping data indicate that the bulk of permeability in this well is associated with the depth interval 1180-1421 meters. The existing temperature and pumping test data indicate that fluid flow takes place largely through discrete fracture zones. Presumably, these discrete fractures join a fracture network at some distance from the wells. The permeability of the aquifer is determined by the density and connectivity of these permeable fractures. To characterize the aquifer permeability, it would be desirable to perform pressure interference tests (i.e. monitor pressure or hydraulic head changes in other individual wells in response to pumping or injection into other individual
wells). It appears that to date pressure interference tests have not been performed in the Yucca Mountain area. It would also be desirable to see if the major feedpoints are correlated with some particular stratigraphic horizons. In our view, the available data do not support the three-layer hydraulic conductivity structure postulated by Szymanski (1989; plates 4.2.2-13 and 4.2.2-14). More specifically, the existing data set indicates that the bulk of the permeability in the saturated zone is associated with discrete fractures. The data are, however, insufficient to draw any definite conclusions as to the distribution of permeable fractures with depth.
Aquifer Pressures (Hydraulic Potential)
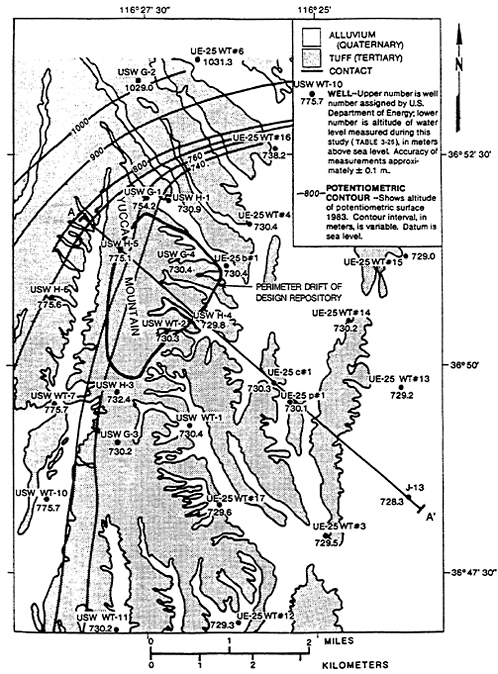
Water level data are available from a number of deep wells in the vicinity of the Yucca Mountain (see Figure 2 for well locations); a table of these data is contained in Szymanski (1989, plates 4.2.4.4-2-4.2.4.4-2a). With a few exceptions, only the composite water levels were measured. Stated somewhat differently, there is poor depth control for hydraulic head measurements. As noted above, temperature data indicate internal flow (and hence variations in hydraulic potential with depth) in many of the wells. In any future measurement program, effort should be made to quantify the variation in hydraulic head with depth.
The hydraulic head data have also not been corrected for temperature variations. Temperature changes could account for some of the fluctuations in the hydraulic heads with depth. Three wells (H-l, H-3 and UE-25p#1), however, exhibited very large increases in hydraulic head with depth; this indicates potential for some upflow. Wells H-1 (below 650m) and H-3 are characterized by conductive temperature profiles (and hence poor permeability). In well UE-25p#1, the increase in hydraulic head occurred at about the transition from volcanics to Paleozoic carbonates; a temperature profile taken in the completed well indicates an isothermal zone (and hence internal flow) from ~1210 meters (tuffs) to ~1400 meters (carbonates). The hydraulic potential data from wells H-l, H-3 and UE-25p#1 emphasize the existence of a vertical gradient (and vertical upflow/downflow) in hydraulic heads in the Yucca Mountain area.
The available hydraulic head data are displayed in Figure 2. The present water level in the repository area is about 720-730 m ASL (meters above sea level); the design emplacement zone for the repository ranges from ~950 to ~1100 m ASL. Immediately north of the repository, a steep hydraulic gradient is present. Water level rises from ~730-750 m ASL (wells G-1 and H-l) to ~1030 m ASL (well G-2)
over a distance of approximately 2.5 km. At present, the reasons for this large increase in hydraulic head are a matter of speculation. Some possible causes include (1) faults with impermeable fault gauge or that juxtapose permeable against impermeable hydraulic units, (2) change in rock characteristics and/or regional stress field that leads to a change in fracture pattern, and (3) drainage induced by deep Paleozoic carbonates. To further explore these and other possibilities, it will be necessary to drill a series of boreholes in the area between wells G-l/H-1 to the south and wells G-2/UE-25WT#6 to the north. These new wells should be designed to test both the tuffs and the underlying carbonates. Besides providing additional hydraulic head data, the new drill holes should be tested to delineate the permeability structure in this important area. More specifically, we recommend that downhole logs (e.g. sonic, temperature, spinner, etc.) be employed to investigate the fracture pattern. Some pressure interference testing will also be needed to obtain quantitative estimates of permeability.
Discharge and Recharge Areas
Discharge from the Alkali Flat/Furnace Creek subbasin occurs by (1) springs near Furnace Creek Ranch in Death Valley, and (2) evapotranspiration at Franklin Lake Playa (see Figure 3 for locations). The spring waters at the Furnace Creek Ranch are believed to originate from alluvium and/or carbonates that underlie the Amargosa Desert. The total discharge rate at the Furnace Creek Ranch is estimated to be 1.932 × 10⁴ m3/d (Czarnecki and Waddell, 1984). The present day evapotranspiration at Franklin Lake Playa has been investigated by Czarnecki (1990); the estimates for evapotranspiration range from ~0.1 cm/d during winter months to ~0.3 cm/d during summer months. Assuming a surface area of 14.2 km2 for the playa, the volumetric discharge rates are in the range from 1.42 × 10⁴ m3/d to 4.26 × 10⁴ m3/d. As noted by Czarnecki (1990), it is also possible that part of the ground-water bypasses the Franklin Lake Playa, and discharges at lower topographic elevations elsewhere; no estimates of such a discharge rate are available. The average crustal heat-flow in the Basin and Range province is ~80 to 90 milliwatts per m2 (mW/m2). A large area in southeastern Nevada, called the Eureka Low, has, however, a relatively low heat flow (~45 mW/m2). The Eureka Low overlaps the northern part of the Death Valley ground-water system. The heat-flow deficiency in the Eureka Low area has been hypothesized to be due to descending ground water. Dudley (1990a) presents preliminary calculations to show that the heat-flow deficiency in the
4400 km2 overlap area of the Eureka Low and the Ash Meadows subbasin equals, within a factor of two or so, the excess heat discharge associated with the springs of Ash Meadows. Because it is difficult to characterize heat discharge associated with evapotranspiration, heat balance calculations have not yet been performed for the Furnace Creek/Alkali Flat subsystem. Given the present information, it is reasonable to assume that the recharge areas, both modern and those in the recent past (say 10-15 ka), for the Furnace Creek/Alkali Flat subsystem lie in the Eureka Low area. The major modern recharge areas, those that supply the ground water, for the Furnace Creek/Alkali Flat subsystem are (1) Pahute Mesa area to the north of the Yucca Mountain, and (2) the Fortymile Wash area to the east of Yucca Mountain. The amount of present day recharge in other recharge areas (Jackass Flats, Crater Flat and the Amargosa Desert) is negligible compared to the recharge from the Pahute Mesa area and the Fortymile Wash (Czarnecki, 1985).
Carbon isotope data imply that the water present in the deeper parts of the Alkali Flat-Furnace Creek Ranch subbasin was recharged about 10-15 ka (Dudley, 1990a). This recharge presumably occurred under conditions that were cooler and possibly wetter than those prevailing now. These ground-water age data raise the interesting possibility that the Alkali Flat/Furnace Creek subbasin is still draining down, and is presumably not in a steady-state (see also Czarnecki, 1990). Sufficient data on ground water age distribution in the subbasin are, however, presently unavailable to describe the evolution of the ground-water system over the past 10-20 ka.
MODELING STUDIES
Models are useful devices to synthesize the available data and to guide one's thinking. Models can be constructed utilizing various amounts and different qualities of data. Often preliminary model analyses is based upon purely reconnaissance quality information. Such models can often indicate which parameters will influence results and which will not. Used in this context, models can be useful in guiding data collection.
Often preliminary models are used to test hypotheses. For example, the current regional ground-water flow model for the Yucca Mountain does not include the underlying Paleozoic carbonate aquifer. The available data (from outside the Yucca Mountain area) suggests that this aquifer has a transmissivity of at least an order of magnitude higher than the tuffs. It is possible that the regional flow system is largely controlled by the carbonate aquifer. One can test what the influence
of the carbonate aquifer is on the regional flow system through modeling.
Our evaluation of the present modeling is that Czarnecki has done a commendable job with the available data. The data are, however, insufficient to answer many of the questions associated with the site.
There is insufficient information to characterize adequately the three-dimensional distribution of permeability and hydraulic heads. In addition, significant uncertainty exists as to the amount (and time) of recharge to and discharge from the ground-water system. Czarnecki and Waddell (1984) used parametric-estimation techniques to model steady areal ground-water flow in the Alkali Flat/Furnace Creek subbasin. A slightly modified form of the latter model was employed by Czarnecki (1985; 1991) to investigate the effects of (1) increased precipitation and (2) removal of the low-permeability barrier north of the Yucca Mountain on ground-water levels in the repository area. These studies are briefly reviewed in the following paragraphs.
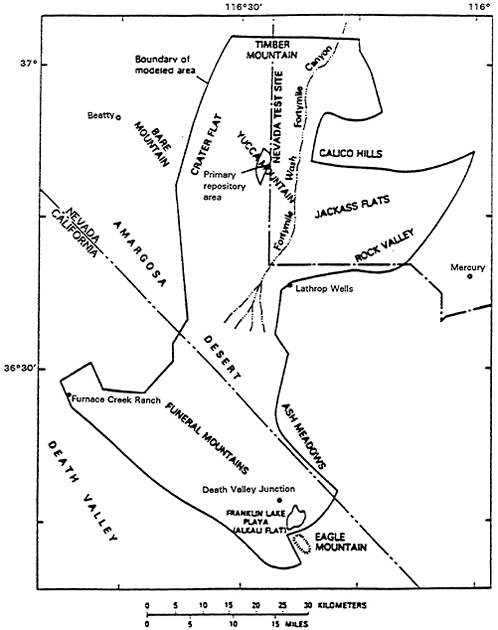
The area modeled by Czarnecki and Waddell (1984) extends from Timber Mountain in the north to Alkali Flat and Franklin Lake Playa in the south (see Figure 3). Recharge from the Pahute Mesa area was simulated by prescribing a constant head (or pressure boundary). Some minor fluxes were also applied to account for recharge from Jackass Flats and Amargosa Desert based on the earlier modeling work of Waddell (1982); all these fluxes, however, amount to less than 2.5% of the total recharge (or discharge). The recharge along Fortymile Canyon (zone 8, Figure 4) was represented as a distributed flux. The recharge in the Fortymile Wash area (~2.214 × 10⁴ m3/d) accounts for approximately 40.3% of the total recharge; most of the rest (≈ 57.3%) enters the subbasin through the constant head boundary along the northernmost end of the modeled region. Discharge from the subbasin was represented (1) as a line sink east of Furnace Creek Ranch and (2) as an areal discharge out of Alkali Flat. The discharge from the Alkali Flat area is 2.214 × 10⁴ m3/d and equals 64.8% of the total discharge from the subbasin; the remainder of the discharge was assumed to take place in the Furnace Creek Ranch area. All other boundaries were assumed to be no-flow boundaries.
Czarnecki and Waddell (1984) divided the subbasin into 13 regions (Figure 4); transmissivities were assumed to be uniform in each of these regions. As part of a parametric estimation procedure, Czarnecki and Waddell (1984) varied the transmissivities in zones 1 through 9 until a satisfactory match was obtained between the computed and measured hydraulic heads. Final transmissivity values computed by Czarnecki and Waddell are given in Table 1. Considering the uncertainties in head measurements, the agreement between computed and
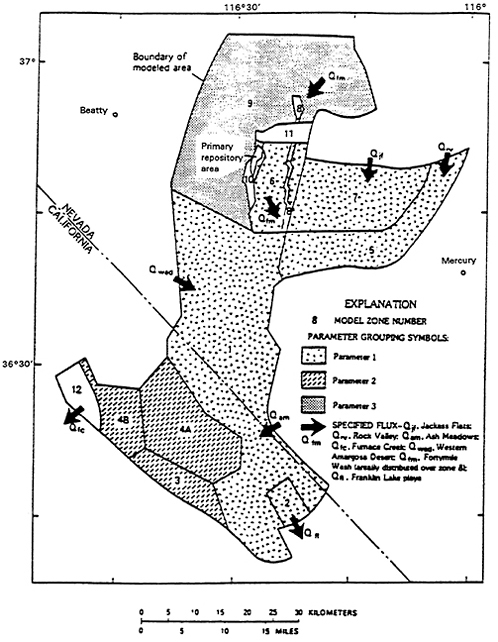
Table 1 Values of model transmissivities and standard errors. (excerpted from Czarnecki and Waddell, 1984).
|
[T, transmissivity, in meters squared per day; number following letter T in model variable column is zone number; dashes indicate that value was held constant] |
|||||
|
Model Variable |
Parameter Number |
Value |
Standard Error |
Coefficient of Variation |
|
|
T1, T2 |
1 |
1.336 × 10³ |
31.92 |
0.024 |
Alluvium |
|
T3, T4a |
2 |
1.282 × 10² |
2.421 |
0.019 |
Volcanic Rocks |
|
T4b |
2 |
1.197 × 10² |
2.260 |
0.019 |
Carbonate Rocks |
|
T5 |
1 |
1.169 × 10⁴ |
2.792 × 10² |
0.024 |
Carbonate Rocks |
|
T6, T7, T8 |
1 |
3.340 × 10³ |
79.79 |
0.024 |
Tuff |
|
T9 |
3 |
95.90 |
0.2711 |
0.003 |
Tuff |
|
T10 |
– |
78.62 |
– |
– |
Tuff |
|
T11 |
– |
3.888 |
– |
– |
Tuff |
|
T12 |
– |
8.64 × 10⁻³ |
– |
– |
Lakebeds |
measured head values is good. Model residuals for simulated versus measured heads range from –28.6 to 21.4 meters; most are less than ±7 meters. The simulated hydraulic heads are shown in Figure 5.
Despite the impressive match between the measured and computed heads, the model results must be used with great caution. The computed transmissivities in zones 5, 6, 7 and 8 are extremely high; the available permeability measurements do not provide support for these high values. An extremely small transmissivity value was assumed for zone 11 to simulate the large hydraulic gradient north of the Yucca Mountain. As noted elsewhere in this report, at present the cause of this large hydraulic gradient is not understood. The uncertainty in the amount of total discharge from and recharge to the subbasin produces a corresponding uncertainty in the computed transmissivity values. Stated somewhat differently, the presently available data on discharge/recharge and transmissivity distribution in the subbasin provide inadequate constraints for the model.
Czarnecki (1985) presents a slightly modified form of the subbasin model discussed above. The constant head boundary condition along the northernmost boundary was replaced by a constant flux boundary; the prescribed flux was the same as that computed by Czarnecki and Waddell (1984). The prescribed flow conditions along the Furnace Creek Ranch and Alkali Flat were changed to constant head conditions;
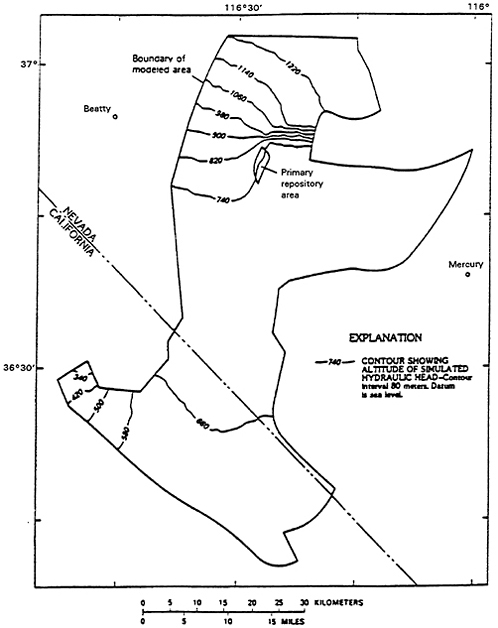
Figure 5 Simulated hydraulic heads. (From Czarnecki and Waddell, 1984).
hydraulic head values in these areas were estimated from values of land-surface altitudes. Czarnecki employed the empirical approach of Eakin and others (see Czarnecki, 1985, for a detailed discussion) to estimate the increase in recharge associated with a 100 percent increase in modern-day precipitation. The average increase in recharge for the case of 100 percent precipitation was assumed to
be 15 times the modern recharge in all areas. The computed rise in hydraulic head is shown in Figure 6. The rise in water level (~130 m) beneath the primary repository area would still leave the water table some 70 meters below the repository horizon. The response of the water table in the primary repository area was found to be most sensitive to recharge along the Fortymile Wash. Because of uncertainties associated with model transmissivities and with the empirical approach used by Czarnecki to compute the increase in recharge, the computed value of 130 meters is at best only an estimate.
As discussed in the preceding, Czarnecki and Waddell (1984) had to utilize a very small transmissivity in zone 11 (see Figure 4) to simulate the large increase in hydraulic gradient north of Yucca Mountain. The trend of this barrier (zone 11) is east-west, normal to the faults in the area. Recently, Czarnecki (unpublished work) has modeled a sudden removal of this permeability barrier. (The removal of the barrier could be due to faulting associated with an earthquake). This “dam break” causes a maximum rise of 20 to 30 meters in water-level at the repository site.
It is conceivable that an increase in precipitation acting in concert with the “dam break” will cause an even larger rise in ground-water level than that caused by climate change alone. Such a “worst case scenario” should be investigated.
RECOMMENDATIONS
Modeling studies by Czarnecki have identified increased recharge associated with increased precipitation as a potential cause for water-table rise beneath the primary repository area. Because of our present uncertain knowledge of the hydrologic regime in the Yucca Mountain area, it is impossible at this time to state with any degree of certainty that the water-table will not rise sufficiently to flood the repository within the next 10,000 years. To reduce the present uncertainty level, it will be necessary to obtain additional hydrologic data to provide constraints on any future modeling efforts.
The following recommendations, if carried out, should help in achieving a better understanding of the present hydrologic regime in the Yucca Mountain area; such an improved understanding is a prerequisite for predicting the response of the hydrologic regime to any future changes in formation transmissivities (e.g. those associated with an earthquake) and/or increased recharge.

-
Existing well data (drilling, stratigraphy, repeat temperature surveys, pumping tests) should be re-examined to determine if the major permeable horizons are associated with specific formations and/ or formation interfaces.
-
The anomalous response seen in some of the slug tests should be reanalyzed to determine the cause for the observed behavior.
-
It would be worthwhile to attempt to remeasure hydraulic potential in isolated sections of existing boreholes. A knowledge of the three-dimensional hydraulic head distribution is essential for developing a detailed three-dimensional model of fluid flow in the Yucca Mountain area.
-
Samples of water present at various depths in the Alkali Flat/ Franklin Lake subbasin should be dated. A more complete knowledge of water ages will be helpful in developing an understanding of the evolution of the ground-water system over the past 10-15 ka.
-
Effort should be made to characterize more completely the evapotranspiration in the Franklin Lake Playa area. One of the major sources of uncertainty in our present understanding of the hydrologic regime is associated with uncertainties in recharge/discharge rates.
-
A carefully designed set of pressure interference tests is required to delineate the permeability structure in the Yucca Mountain area. Independent determination of permeability is necessary to constrain and guide the modeling studies.
-
A series of wells should be drilled in the steep hydraulic gradient region north of Yucca Mountain. These wells should be drilled deep enough to penetrate the Paleozoic carbonates underlying the tuffs. Hydraulic head and permeability (both pumping and interference tests) measurements in these holes should lead to a qualitative improvement in our understanding of the hydrological regime in this important area.
-
-
A multi-layered model which includes the Paleozoic carbonate rocks should be constructed using currently available data and used in a sensitivity analysis mode to test the coupling between the tuff aquifer and the Paleozoic carbonates.
-
Assuming that sufficient data become available, it would be worthwhile to undertake more definite three-dimensional (both steady and transient) modeling studies. A transient three-dimensional model can provide new insights into evolution of the ground-water system over the past 10-20 ka. Such transient modeling is routinely used in geothermal reservoir engineering to model the natural state.
-
-
If and when a ground-water model, which is well-constrained
-
by field data, becomes available, it will be possible to obtain more reliable estimates of water level changes associated with climatic changes and/or volcanic/tectonic events.
-
The importance of characterizing the relationship between recharge and precipitation cannot be overemphasized. In particular, it is important to assess the reliability of empirical methods, presumably developed under present arid conditions, to predict recharge under much different climatic (wetter and cooler) conditions.
REFERENCES
Czarnecki, J. B. 1985. Simulated Effects of Increased Recharge on the Ground-Water Flow System of Yucca Mountain and Vicinity, Nevada-California Water-Resources Investigations Report. 84-4344 U.S. Geological Survey. Denver, Colorado.
Czarnecki, J. B. 1990. Geohydrology and Evapotranspiration at Franklin Lake Playa, Inyo County, California Open-File Report. 90-356. U.S. Geological Survey. Denver, Colorado.
Czarnecki, J. B. and R. K. Waddell. 1984. Finite-Element Simulation of Ground-Water Flow in the Vicinity of Yucca Mountain, Nevada-California Water-Resources Investigations Report. 84-4349 U.S. Geological Survey. Denver, Colorado.
Dudley, W. M. (1990a). Multidisciplinary Hydrologic Investigations at Yucca Mountain, Nevada Paper presented at the International Radioactive Waste Management Conference Las Vegas, Nevada, April.
Dudley, W. M. (1990b). Gradients and Stability of the Hydraulic Regime, Yucca Mountain Area Presented at a meeting of the National Academy of Sciences Panel on Coupled Hydrologic/Tectonic/Hydrothermal Processes at Yucca Mountain Menlo Park, California. May.
Galloway, D. and S. Rojstaczer. 1988. Analysis of the Frequency Response of Water Levels in Wells to Earth Tides and Atmospheric Loading Proceedings 4th Canadian/American Conference on Hydrology. National Water Well Association Dublin, Ohio 100-113.
Grant, M. A., I. G. Donaldson and P. F. Bixley. 1982. Geothermal Reservoir Engineering. Academic Press. New York.
Sass, J. H., A. H. Lachenbruch, W. W. Dudley, Jr., S. S. Priest, and R. J. Munroe. 1988. Temperature, thermal conductivity, and heat flow near Yucca Mountain, Nevada. Some tectonic and hydrologic implications. USGS-OFR-87-649.
Szymanski, J.S. 1989. Conceptual considerations of the Yucca Mountain ground water system with special emphasis on the adequacy of this system to accommodate a high-level nuclear waste repository Unpublished DOE report.
Waddell, R. K. 1982. Two-Dimensional, Steady-State Model of Ground-Water Flow. Nevada Test Site and Vicinity, Nevada-California. Water Resources Investigations Report. 82-4085. U.S. Geological Survey. Denver, Colorado.


