
Appendix E
Probabilities of Earthquakes Near Yucca Mountain, Nevada
Robin McGuire
Risk Engineering
Denver, Colorado
Revised January 18, 1992
PURPOSE
To put into perspective the likelihood of earthquakes in the vicinity of the proposed high-level waste repository at Yucca Mountain, we can make quantitative estimates of probabilities of occurrence of earthquakes within certain distances of the proposed repository. This is done by using estimates of slip rates on faults and standard seismological and probabilistic models. These techniques provide insight into how likely are earthquakes that might result in significant water-table changes under the proposed repository through changes in crustal stress.
Given the data available in the study region, we have made some arbitrary but reasonable assumptions, in particular regarding rates of
slip on identified and unidentified faults. It should be emphasized that the resulting calculations are preliminary and are made for perspective only. A large amount of work, including collection of field data, needs to be pursued before the inputs to, and hence results of, an analysis such as this have wide credibility. In spite of these qualifications, it is instructive to see where the calculations lead, given a set of reasonable assumptions on the input.
FAULTS AND PARAMETERS
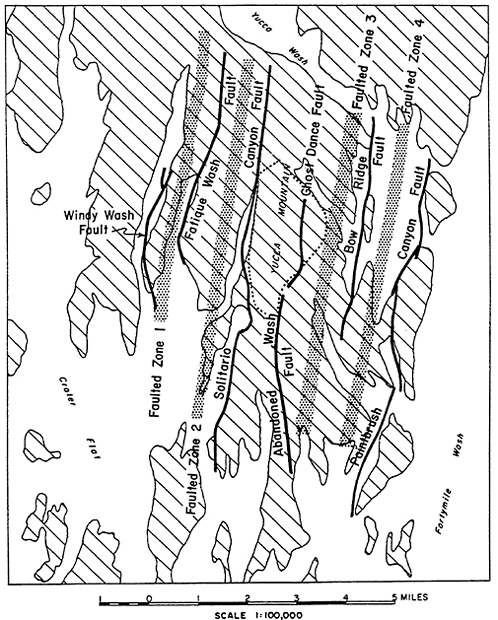
Identified and suspected Quaternary faults in the region of the proposed repository (Fox, personal communication, 1991) are shown on Figure 1. The seven named faults have been widely identified and are considered currently active for the purposes of this study. The Ghost Dance and Abandoned Wash faults are assumed to be a single, continuous fault with a length of about 9 km.
Slip rates for the late Quaternary on most of these faults are not available. One exception is for the Windy Wash fault, for which a vertical slip of 40 cm on a 270,000—year old gravel is documented (Whitney et al, 1984), leading to a vertical slip rate of 0.0015 mm/yr. Movement on this fault is probably oblique; assuming equal amounts of vertical and strike-slip movement, the total current slip rate on this fault is estimated as 0.0021 mm/yr.
In addition to the named faults on Figure 1, there is evidence of slip on lesser features that have offset units of the Paintbrush Tuff (e.g. Scott and Bonk, 1984). These have been represented as Faulted Zones 1, 2, 3, and 4 on Figure 1; these zones are an aggregation of many minor faults shown in Scott and Bonk, 1984. The slip on each individual fault is minor, but the cumulative slip is as large and, in some cases, larger than on the named faults.
In order to make estimates of slip rate on faults (other than the Windy Wash Fault) and faulted zones, we have made several assumptions about the responses of these faults to tectonic processes currently active near Yucca Mountain:
-
On average, all faults and faulted zones have a slip rate equal to that observed on the Windy Wash fault.
-
The current slip rate is proportional to the total displacement observed on the Topopah Spring Member of the Paintbrush Tuff, as represented by Scott and Bonk, 1984. (This unit is approximately 13 million years old and is not a reliable indicator of the current slip rate, but is used to estimate relative rates of current deformation.)
-
All moderate earthquakes (magnitude 5 to 7) that might affect crustal stress conditions and the water table near Yucca Mountain will occur on one of the identified faults or faulted zones.
The most critical of these assumptions is the first; it says that the slip rate on the Windy Wash fault is typical of slip rates on other faults in the region. In fact the resulting estimated slip rates are comparable to those inferred by other investigators, as is noted below.
Table 1 shows, for each fault and faulted zone, the length of the fault, the offset of the Topopah Spring Member, and the slip rate estimated as described above. For this Table, and for computations, the Ghost Dance and Abandoned Wash faults have been assumed to be one continuous fault. By way of comparison, Coppersmith and Youngs (1990) estimated slip rates between 0.002 and 0.006 mm/yr for the six named faults, and a total slip rate of 0.0275 mm/yr. All tectonic activity was ascribed to the named faults by Coppersmith and Youngs, with other movement being secondary faulting subsequent to the main rupture. The total rate of 0.0275 mm/yr is of the same order as the total of 0.021 mm/yr shown in Table 1. Again, the purpose here is to make reasonable estimates of slip rate, that are not low or high by an order of magnitude. If alternative slip rates are preferred, their effects on the probabilities reported here would be proportional, at least at the lower probability levels. That is, if slip rates were doubled, the probabilities reported below would approximately double.
It should be noted that apparent slip rates over the past 13 my are an order of magnitude larger than those described above. This can be concluded from two independent interpretations. First, vertical offsets of the Topopah Spring Member shown on Table 1 total 1880 m; dividing this by the 13 Ma age of this unit gives a total vertical slip rate for the faults in Figure 1 of about 0.15 mm/yr. Assuming oblique slip with equal components of horizontal and vertical movement gives a total slip rate of 0.21 mm/yr.
A second, independent estimate of total slip rate can be obtained from paleomagnetic declination data in the region. These data (taken from Rosenbaum et al., 1991) indicate that the southern portion of the Yucca Mountain rotated 20° to 30° clockwise about a vertical axis since the emplacement of the 13 my old Tiva Canyon tuff. Assuming that this rotation was accommodated by block rotations and strike slip on faults between the blocks and assuming a spacing between the active faults, one can estimate the long-term average fault slip rate. For rotations of 20° and 30°, and fault spacing of 5 km, average strike slip rates are found in the range of 0.25 to 0.35 mm/yr. Assuming equal components of normal and strike-slip movement would yield a total slip rate of 0.35 to 0.49 mm/yr over a 5 km width.
Table 1 Faults and Parameters Used In Analysis of Slip Rate
|
Fault |
Length, km |
Offset of Topopah Spring Unit m * |
Slip rate, ** mm/yr |
|
Windy Wash |
4.6 |
400 |
0.0021 |
|
Faulted Zone 1 |
10.0 |
70 |
0.00090 |
|
Fatigue Wash |
7.1 |
60 |
0.00077 |
|
Faulted Zone 2 |
10.0 |
225 |
0.0029 |
|
Solitario Canyon |
13.7 |
205 |
0.0027 |
|
Ghost Dance-Abandoned Wash |
9.2 |
50 |
0.00064 |
|
Faulted Zone 3 |
10.0 |
338 |
0.0043 |
|
Bow Ridge |
7.4 |
196 |
0.0025 |
|
Faulted Zone 4 |
10.0 |
130 |
0.0017 |
|
Paintbrush Canyon |
12.0 |
206 |
0.0027 |
|
Total |
0.0212 |
||
|
* Taken from Scott and Bonk (1984) for all faults except Windy Wash, which was taken from Carr (1984). ** Estimated over the last 270 ka, based on slip rate for Windy Wash fault. |
|||
Those high slip rates, if they apply to the present and if they are entirely seismic, imply that three to five earthquakes with a total oblique slip of 1 m would occur over the 5 km faulted zone within 10,000 years. However, seismic slip in relatively low strain regions may be one-third or less of the total geologic slip rate. This would imply one to two tectonic events per 10,000 years in the 5 km faulted zone.
All of this points to the large uncertainties in estimating fault slip rate, given current information. These uncertainties undoubtedly can be reduced with further site specific fault investigations. For perspective here on rates of earthquake occurrence, we use the slip rates shown in Table 1 with the understanding that further fault-specific site investigations likely will increase or decrease those estimates.
The maximum magnitudes allowed on the ten faults in Table 1 range from 6.5 to 7, depending on the hypothesis considered in the next section. These values may be conservative in that the length of faulting mapped on Figure 1 may not support such large events. On the other hand, there is no conclusive evidence that these faults do not extend farther north or south, nor that they join with other mapped faults to the north or south.
In three dimensions the faults are modeled with surface traces as shown on Figure 1, and with an assumed dip of 60° to the west. This is a typical geometry for faults in this region.
ANALYSIS
With these faults and parameters, the procedure used was to calculate the rate and distribution of earthquakes on each fault, given the slip rate. Then we calculated the probability that the repository site would lie within α units of the rupture, where α is a fraction of the earthquake rupture length. (α is varied below to determine the sensitivity of results to this distance.) The formal equation used is:
P [Repository within α rupture lengths of causative fault, per year] =
where vi is the annual rate of occurrence of earthquakes in the magnitude range of interest, M is moment magnitude, l is location, and the integral over location includes only those rupture locations such that the distance r between the repository and the closest part of the rupture is less than α times the rupture length. For the purposes of this calculation the repository is considered as a single point (located at the center of the proposed repository block), not an area. This has a minor effect, given that the repository dimensions are significantly smaller than dimensions of the ruptures being considered. It is also a reasonable assumption, because it emphasizes earthquakes that might affect a substantial portion of the repository.
For this calculation the rupture area was taken to be square, with a dimension RL calculated as RL = 100.515 M −2.12. This is derived from the data and relationship compiled by Wells et al (1990) shown in Figure 2. It leads to the following rupture lengths for different magnitudes, which appear reasonable:
|
M |
RL, km |
|
5.0 |
2.8 |
|
5.5 |
5.2 |
|
6.0 |
9.3 |
|
6.5 |
16.7 |
|
7.0 |
30.5 |
The thickness of the seismogenic crust was taken to be 10 km, and in cases where hypothesized earthquakes would have a down-dip rupture length that extends to the base of the crust, the rupture was truncated at a depth of 10 km. For small earthquakes that do not break the entire crust, a uniform distribution on depth was assumed.
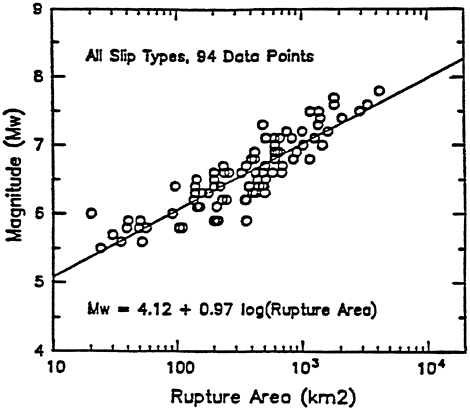
Figure 2 Magnitude vs. rupture area for all slip types (after Wells et al., 1990).
For all faults, a Richter b-value of 0.9 was used, which is typical of earthquake distributions in many parts of the world.
There are several considerations in specifying the range of earthquakes over which calculations will be performed. First, of course, the largest earthquake used in calculations on each fault should reflect the maximum earthquakes thought possible. Second, the minimum earthquake should be selected based on the smallest earthquake that could lead to major changes in the water table. For this study neither the smallest nor the largest earthquake is well-constrained. We have therefore used several ranges of magnitudes, to illustrate how the probability calculations change with choices of the smallest and largest earthquake.
These types of calculation are standard in seismic hazard analysis, and available computer programs have be used to perform them. The three-dimensional geometry of the faults and the probability calculations are correctly handled by these programs, and the important
questions are in the specification of inputs, and interpretation of results.
RESULTS
Calculated probability values are presented in Table 2 for five magnitude ranges and four values of α, indicating the probability that an earthquake within the stated magnitude range will occur within α rupture lengths of the repository. The original calculations were made on an annual basis; an assumption of Poisson arrivals was made to calculate total probabilities over the repository lifetime of 104 years.
The last row in Table 2 shows results for a pure “characteristic” model that accounts for all fault slip, and all earthquake occurrences, with M = 6.5 events. This is a limiting case; since all faults are within 4 km of the repository, the calculated probabilities (for α > 0.25) just reflect the rate of occurrence of a magnitude 6.5 on any fault in 104 years. For α = 0.1, the calculated probability just reflects the rate of occurrence on the Ghost Dance and Solitario Canyon Faults, and in faulted zones nos. 2 and 3 (these faults and faulted zones are within 1.6 km of the proposed repository).
Among the results shown in Table 2, the values for 6.0 < M < 6.5 and for α = 0.25 and 0.1 are the most realistic. It is unlikely that magnitudes as large as 7.0 have occurred or will occur on these faults, based on their lengths and observed offsets, and it is likely that the proposed repository would have to be very close to a moderate earthquake (e.g. within several km of a magnitude 6.5 event) for crustal stress changes to be significant enough to have the potential to change water levels. 1 Thus the numbers in the third row, under α = 0.25 and 0.1, indicate that it is unlikely (but not impossible) that the proposed repository would be close (within 4-5 km) to a moderate earthquake (magnitude about 6.5) during its design lifetime of 104 years.
SUMMARY
A straightforward seismic hazard analysis has been conducted to examine the probability that the proposed repository at Yucca Mountain might be close to a moderate earthquake originating on one of the nearby faults. To estimate rates of activity on these faults, the
|
1 |
This is also the interpretation of Archambeau and Price (1991), who present in their Figure 1 a scaled schematic of the “Yucca Mountain system,” which is 10 km in lateral dimension. |
Table 2 Calculated Probabilities of Earthquakes Near Proposed Repository Over 10,000 Years
|
magnitude range |
Value of α |
|||
|
1.0 |
0.5 |
0.25 |
0.1 |
|
|
5.0 to 6.5 |
≈1.0 |
0.39 |
0.15 |
0.028 |
|
5.0 to 7.0 |
0.41 |
0.23 |
0.11 |
0.030 |
|
6.0 to 6.5 |
0.14 |
0.14 |
0.11 |
0.028 |
|
6.0 to 7.0 |
0.10 |
0.10 |
0.082 |
0.029 |
|
6.5 |
0.13 |
0.13 |
0.13 |
0.071 |
observed slip rate on the Windy Wash fault has been assumed to apply, on average, to other faults and faulted zones in the area, with modifications based on reported offset of the Topopah Spring unit of the Paintbrush tuff.
The results indicate that, if effects of an earthquake occur in a surrounding region that is limited to within one-quarter of the earthquake rupture length from the fault, the probability of the repository being within such a distance of a moderate earthquake (5 < M < 7) is on the order of 3 percent to 15 percent during a lifetime of 104 years. The calculated probabilities depend somewhat on the magnitude range selected; they increase if larger influence distances are considered, or if higher slip rates are used.
REFERENCES
Archambeau, C. B. and Price, N. J. 1991. An Assessment of J. S. Szymanski's Conceptual Hydrotectonic Model Minority Report of the Special DOE Review Panel. September. 144 plus Appendix.
Carr, W. J. 1984. Regional Structural Setting of Yucca Mountain, Southwestern Nevada, and Late Cenozoic Rates of Tectonic Activity in Part of the Southwestern Great Basin, Nevada and California U.S. Geol. Survey Open-File Rept. 84-854.
Coppersmith, K. J. and R. R. Youngs. 1990. Earthquakes and Tectonics Calculations. In Demonstration of a Risk-Based Approach to High-Level Waste Repository Evaluation, prep. by Risk Engineering, Inc. Elec. Power Res. Inst. Rept. NP-7057. Palo Alto. October.
Scott, and Bonk. 1984. Geologic Map of Yucca Mountain, Nye County, Nevada, with Cross-Sections U.S. Geol. Survey Open-File Rept. 84-494.
Wells, D. L., K. J. Coppersmith, D. B. Slemmons, and X. Zhang. 1990. Earthquake Source Parameters: Updated Empirical Relationships Among Magnitude, Rupture Length, Rupture Area, and Surface Displacement Manuscript in preparation.
Whitney, J. W., R. R. Shroba, F. W. Simonds, and S. T. Harding. 1984. Recurrent Quaternary Movement on the Windy Wash Fault, Nye County, Nevada. Abs. Geol. Soc. of Amer. Annual Meeting. San Antonio. 787.


