
A
Comparison of Data Sources and Data
Betty M. Vetter
Commission on Professionals in Science and Technology
INTRODUCTION
As a relatively new field, computer science has not yet developed a classic set of definitions to describe what kinds of specialists to include in the field and what kinds to exclude when organizing information on human resources. Thus, in computer science and technology even more than in other fields of science and engineering with longer histories, one encounters variations in supposedly similar data derived from different sources.
Data Needed to Assess Supply and Demand
In general, two kinds of data are needed to assess supply and demand in any field: direct data such as number of degrees awarded, number of persons employed in the field, and particular demographic or other data about those persons; and indirect data, which are used to assess present demand and potential supply or demand. Indirect data include information on salaries, demographic changes, student plans and aspirations, and legislative changes such as those dealing with immigration or with particular appropriations, such as research budgets.
NOTE: A paper prepared for a computer science and technology workshop sponsored by the Computer Science and Telecommunications Board and the Office of Scientific and Engineering Personnel of the National Research Council, and held at the National Academy of Sciences Beckman Center, Irvine, California, October 28–29, 1991.
Sources of Direct Data
The sources of direct data on human resources in computer science and technology include the National Center for Education Statistics (NCES), which conducts an annual survey of earned degrees; the National Research Council (NRC), with its ongoing survey of new doctorates awarded and its biennial survey of the doctoral population; the Engineering Manpower Commission (EMC), which collects both enrollment and degree data in computer engineering and in computer technology; and the Computing Research Association (CRA), with its annual Taulbee survey of computer science departments. The Taulbee survey provides information on Ph.D.s awarded in computer science and computer engineering, data on doctoral enrollments in these fields, placement information for new Ph.D.s accepting academic positions, and faculty statistics in responding departments, including some estimates of future demand.
An additional source of direct data will be the 1991 report of the Conference Board of the Mathematical Sciences (CBMS), which surveys mathematics, statistics, and computer science departments every five years or so and reports on bachelor's degrees awarded. Data for the 1990–1991 school year, derived from that survey, have not yet been released, but this analysis includes some of the findings, used with permission.
Other sources of direct data on personnel employed in computer science and technology include the Bureau of Labor Statistics (BLS), which uses sample surveys to define various working populations; the Office of Personnel Management (OPM), which supplies data on federal employment in these fields; and the National Science Foundation (NSF), which sponsors or helps to sponsor surveys of Ph.D. recipients and their post-graduation plans, surveys of the experience of recent science and engineering graduates in the job market, and surveys of working scientists and engineers that aggregate information from several surveys. Information on subsections of the work force, specifically on faculty, is available from the BLS, the NSF, the NRC biennial survey of doctorates, the CRA, and the CBMS.
Sources of Indirect Data
Indirect data relating to current and potential scientists and engineers come from a number of sources.
-
The Census Bureau, for example, provides data on the numbers of Americans who are born and die each year and on the occu-
-
pations of a sample of Americans as reported for the decennial census. As of this writing, no occupational information is yet available from the 1990 census, but census data are used in projecting degree data for the future, based on the number of college-age students.
-
The Cooperative Institutional Research Program, carried out at the University of California at Los Angeles, surveys a sample of all freshmen each year, asking, among other things, about their college plans. This survey provides useful information about potential bachelor's graduates four to six years later.
-
The Institute for International Education's annual surveys of foreign students studying in the United States give some field information.
-
The American Mathematical Society and the Mathematical Association of America surveys of Ph.D.s in mathematics offer a useful companion study to the Taulbee survey.
-
The National Science Foundation is also an indirect source of data obtained in several studies that it supports but that are carried out by others, and it is the sole publisher of much of the data obtained by others under contract to the NSF, such as the NRC.
-
Finally, salary information, which is an important indirect indicator of demand, is reported regularly by the College Placement Council, the American Association of University Professors (AAUP), and the College and University Personnel Association (CUPA) and can be compared with salaries reported in the Taulbee survey, and, most importantly, with those reported in other fields. The CUPA report distinguishes between public and private sector salaries and provides salary data by both rank and field. The AAUP survey does not report salaries by field, but instead groups institutions into categories, and reports salaries by rank within each category. This does not allow distinguishing the salaries of computer scientists from the salaries of faculty in other subject areas. One more salary report, by field, is conducted regularly by Oklahoma State University for institutions belonging to the National Association of State Universities and Land-Grant Colleges.
Additionally, the NRC biennial survey of the doctoral population in the United States provides salary information; employment, unemployment, and underemployment rates; and information on field of employment vs. field of Ph.D., which provides another indicator of the balance in supply and demand in a field. Unfortunately, the NRC no longer publishes these data, and the NSF publication procedures have become so slow that even in the last quarter of 1991, no published information was yet available on the 1989 survey.
Why the Data Differ
Some of these several surveys include the "same" information, such as degrees awarded, and might therefore be expected to provide some identical or at least highly similar statistics. Actually, this is almost never the case. Reasons for differences in data reported on similar populations include differences in taxonomy, such as definition of the field; differences in time frames covered by surveys (fiscal years, academic years, calendar years, and/or different starting and stopping places in the calendar); differences in the cutoff date for a survey, and importantly, differences in the person or persons responding to the survey—e.g., individuals reporting on themselves (as in the NRC Doctorate Records File), reporting by registrars (as in the NCES degree surveys), or reporting by deans or department heads (as in the EMC surveys). Differences also occur if Canada is included (as in the Taulbee surveys).
Further differences occur, even in what are purportedly 100 percent samples, because some individuals or institutions do not respond. Treatment of the non-respondents may include estimating from previous years, or omitting entirely.
None of these many surveys is necessarily either wrong or right, but understanding the differences is important in interpreting the data.
The differences found in the reporting of degrees awarded or other data based on 100 percent samples pale in comparison with the differences found in data reported from sample surveys of the numbers of persons employed in computer science and technology. Substantial differences continue to exist even when the survey population is limited to individuals with the doctorate.
The reasons for such discrepancies include all of those mentioned above, plus differences in sample population bases, sampling and weighing procedures, and response rates, and differences in the date that the survey "snapshot" is made. There may also be significant differences in data that have been aggregated because of small sample sizes.
Despite obvious differences in data on similar populations, however, data from one source may be used to enhance and illuminate data from another. When the differences are very large, as is the case for some of the data examined in this paper, it is usually worthwhile to try to find out why.
COMPARING AVAILABLE DATA ON SUPPLY
The easiest and potentially the most compatible data on the supply of computer scientists and computer engineers should be degrees
awarded, since all of the various sources for degree data attempt to use 100 percent samples.
Bachelor's Degrees
At the bachelor's degree level, reports of degrees awarded in computer science in 1989 vary from 8,796 reported by CRA (and apparently including Canadian departments but limited to U.S. institutions awarding Ph.D.s) to 30,963 reported by NCES, which includes only the United States (Table A.1). For 1990, there are again two data sources, but not the same ones; CRA reported 9,037 degrees awarded compared with 21,704 reported by CBMS. Is the difference accounted for by departmental coverage, definitional differences, or both, or perhaps something else? The CBMS data include computer science degrees awarded both by departments of mathematics and by departments of computer science, including some joint mathematics-computer science degrees.
Data on the number of bachelor's degrees awarded in computer engineering should be easier to compare, since there is one addi-
TABLE A.1 B.S. Computer Science and Computer Engineering Degrees Reported, 1986 to 1991
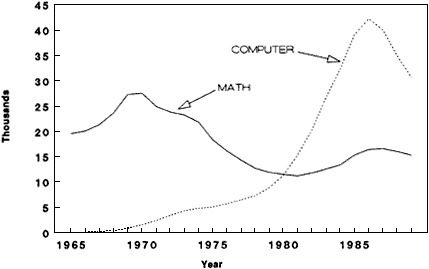
Figure A.1 Bachelor's degrees awarded in mathematics and computer science, 1965 to 1989. Source: National Center for Education Statistics (1965–1989) and unpublished data from the National Science Foundation.
tional source of data, and there are many fewer engineering schools than there are degree-granting colleges and universities. But the number of graduates reported for 1989 varies from 1,810 reported by CRA (which apparently includes no Canadian graduates and is limited to degrees awarded only in those U.S. schools that also award doctorates in computer engineering), to 2,115 reported by NCES, to 4,398 reported by EMC. Why is the number reported by the EMC twice as high as the others? The reason for the large differences is not apparent.
Obviously, students who might have been attracted to mathematics might also have been attracted to computer science. Indeed, as the number of computer science degrees increased during the 1970s, the number of mathematics degrees dropped steadily (Figure A.1). Some of the degrees counted by one data source as computer science degrees may be counted as mathematics degrees in other data sets. The CBMS data for 1989–1990 indicate that 16 percent of the computer science bachelor's degrees were awarded in departments of mathematics, and the remaining 84 percent were awarded by computer science departments. Since the NCES data usually are reported by registrars and the CBMS data by department chairs, it is possible that some of the degrees that might be assigned to mathematics by
the department head could be assumed by the registrar to be computer science, or vice versa.
It is noteworthy that both mathematics and computer science bachelor's degrees are now declining.
Master's Degrees
At the master's degree level there are no comparative databases, so that degree data from NCES are assumed to be correct. It is apparent, however, based on discrepancies seen at the bachelor's level, that such an assumption is, at best, questionable.
Doctoral Degrees
Data on doctoral degrees awarded should be fully compatible, since the number of schools awarding doctorates is limited and all of them should be included in each of the available data sources. Further, after a dozen years of reporting on these degrees, it should be possible to assume some agreement about what constitutes a Ph.D. degree in computer science or in computer engineering.
Compared with the data on bachelor's degrees awarded, the data on doctoral degrees are in considerably closer agreement. However, they still fail to match within a few percentage points.
Number of Ph.D.s Awarded
In 1989, the most recent year for which all databases have reported, computer science doctorates numbered 538 (NCES), 612 (NRC), or 625 (CRA) (Table A.2). For computer engineering that year, the four data sources report 74 (NCES), 117 (NRC), 182 (CRA), or 277 (EMC) doctoral degrees awarded. The top to bottom difference is 274 percent! Without knowing for sure, I must assume that this immense difference lies in how these various sources define computer engineering.
Combining the computer science and computer engineering Ph.D.s narrows the gaps a little and indicates that some of the doctorates reported as computer science degrees in some data sets may be reported as computer engineering degrees in others. Since no computer science data are available from EMC, we must omit its computer engineering data for this comparison. The combined figure for Ph.D.s awarded in computer science and computer engineering in 1989 is 612 (NCES), 729 (NRC), or 807 (CRA)—still an uncomfortable 32 percent difference from top to bottom (Table A.3). Are 195 of these
TABLE A.2 Ph.D. Computer Science and Computer Engineering Degrees Reported, 1986 to 1990
graduates from Canadian institutions? The Taulbee report for 1990 indicates only 25 Canadian Ph.D.s in computer science, and none in computer engineering. The data sets that report 1990 doctorate awards at this time agree fairly well in computer science, but are far apart for computer engineering.
The early increase in bachelor's-level computer science degrees came at the expense of mathematics degrees, and that appears to have happened also for doctoral degrees through the first half of the 1970s (Figure A.2). Then as computer science degrees leveled off for a decade, so also did degrees in mathematics, through 1985. Both fields have seen increases in each year since 1985 in the number of doctorates awarded, and at least a part of this increase appears to be made up of American citizens.
Demographic Characteristics of Computer Science and Computer Engineering Ph.D.s
Regardless of the source of data, it is apparent that foreign citizens come a close second to white, American males in dominating the Ph.D. recipients in both computer science and computer engineering (Table A.4). But once again, the data sources do not agree on the extent of dominance by foreign graduates.
TABLE A.3 Combined Computer Science and Computer Engineering Ph.D. Degrees Reported, 1986 to 1990
In each of the three sources that provide information about the citizenship of doctoral graduates, the data refer to foreign graduates on temporary visas rather than the more inclusive ''non-U.S. citizens.'' Unfortunately, the three data sources for computer science (CRA, NRC, and NCES) are not exactly the same as the three for computer engineering (CRA, NRC, and EMC). Further, we cannot get exactly the same information from all data sources for either 1989 or 1990.
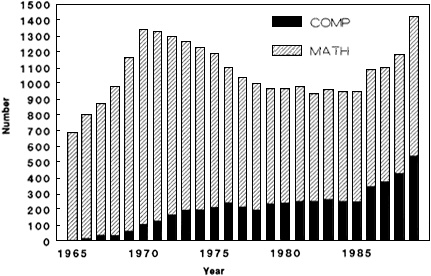
Figure A.2 Ph.D. degrees awarded in mathematics and computer science, 1965 to 1989. Source: National Center for Education Statistics (1965–1989).
TABLE A.4 Individuals Receiving Ph.D.s in 1989 in Computer Science and Computer Engineering
The NRC reports that 178 foreign students on temporary visas received a doctorate in computer science in 1989 (29.1 percent of total awards) and that in computer engineering, 65 of the 117 new graduates (55.6 percent) had temporary visas (Table A.5). NCES data show that 205 graduates with temporary visas were among the 538 Ph.D. recipients in computer science (38.1 percent) but do not provide data by citizenship for recipients of computer engineering doctorates. EMC data indicate that 108 of the 277 Ph.D. degrees awarded in computer engineering (39 percent) were earned by foreign students on temporary visas. The CRA figures for 1989 show that 248 of the 625 computer science graduates in 1989 (39.7 percent) were foreign and 62 of the 173 computer engineering graduates in 1990 (35.8 percent) were foreign.
It is easy to see how the Taulbee survey (CRA) data for foreign citizens might be higher than the other data sets in computer science, because Canadian graduates are included. But only 25 Canadian recipients are included in the 1990 figures (3.4 percent of the total) so that this does not explain the large discrepancy. Even reducing the numbers to percentages shows that the foreign percentage in computer science differs by 15 percentage points, and in computer engineering by 20 percentage points.
There is general agreement about the percentage of women in both computer science and computer engineering, and the general
TABLE A.5 Citizenship and Visa Status of Computer Scientists and Computer Engineers Receiving Ph.D.s, 1980 to 1990
absence of Hispanic and African American doctorate holders is noted in all data sets. However, the percentage of Asian graduates is much higher in the CRA data than in either of the other two data sets. The reason for the discrepancy is not obvious.
Looking at the citizenship status of computer scientists and engineers in the same data set (NRC) over time shows a rising number of both U.S. and foreign citizens over the past decade.
Although there are discrepancies in the data, all the data sources show three general trends:
-
a very high and growing proportion of foreign students among Ph.D. graduates, and thus among graduate students and teaching assistants;
-
a very low proportion of women, and of African Americans and Hispanics of either sex; and
-
a high representation of Asian Americans, relative to their representation in the population. However, relative to all Asian doctorate recipients, Asian Americans represent only about one tenth of the total.
DATA ON THE CURRENT LABOR FORCE
Numerical differences in gross data on the U.S. work force as reported by two major sources would be expected to differ substan-
TABLE A.6 Mathematicians and Computer Scientists in the U.S. Work Force, 1990 and 1988
tially. Surprisingly, they yield the best match found to date between two or more data sets among the data sets reviewed so far in this paper.
The Bureau of Labor Statistics reports a total of 805,000 mathematicians and computer scientists as of January 1990, plus 22,000 higher-education teachers of computer science and 54,000 mathematics faculty members, for a total U.S. math and computer science work force of 881,000 (Table A.6). The National Science Foundation estimates a work force of 708,300 computer specialists and 168,600 mathematical scientists for 1988 (the most recent data available from NSF) for a total math and computer science work force of 876,900. Obviously by coincidence, the total numbers differ by less than 1 percent.
However, examination of just one segment of the work force—college and university employees—shows much larger differences reported among available data sets. Further, data available from one database are not available from another, so that, for example, tenured or tenure-track faculty cannot always be distinguished from non-tenure-track faculty or other employees in the numbers given. Some data sets include data only for Ph.D.s, while others give total faculty or total academic employment without reference to highest degree earned. Thus, no matter how much we try, it is easy to mix apples and oranges.
It is particularly difficult to sort out data on faculty from data describing other academic employees; to determine what proportion of each group is made up of women; and, among the faculty, to determine how many are tenured. Table A.7, which includes data on computer specialists employed in academic institutions, indicates that, for the two data sets that break out the computer scientists from the computer engineers, the data on computer engineers are a closer match than the data on computer scientists. The NRC reports almost twice as many computer scientists employed in academic institutions as
TABLE A.7 Ph.D. Computer/Information Specialists in Academic Institutions by Tenure Status
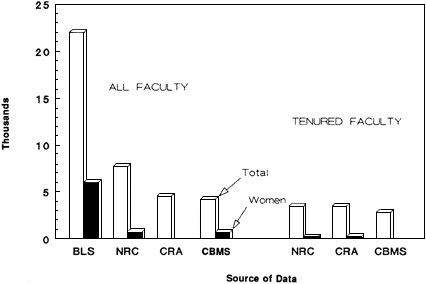
Figure A.3 Ph.D. computer specialists employed in academic institutions and those with tenure. SOURCES: Data from National Research Council (1990), Computing Research Association (1990), Conference Board of the Mathematical Sciences (1991), and estimates from the Bureau of Labor Statistics.
does the CRA. Combining the data on computer scientists and computer engineers from both sources (NRC and CRA) and comparing it with the CBMS total shows closer correlation, but still with a significant difference (Figure A.3).
Although the BLS data are reported, the figures are not comparable with those from the other data sources, which are limited to Ph.D.s. Nonetheless, the BLS reports 22,000 computer science faculty in 1989, whereas NSF, reporting on NRC data from the biennial survey of the doctoral work force, notes only 6,553 academically employed Ph.D.s in computer science in 1989. Could this mean that 70 percent of higher-education faculty in computer science do not have a doctorate? Almost surely, it does not mean that.
The Taulbee survey for the 1990-1991 academic year records 3,567 individuals employed in 135 of 136 computer science departments, including 2,724 tenure-track faculty. The best comparison, from the NRC survey of 1989, is 4,395 tenured or tenure-track faculty, in a total of 6,553 academically employed Ph.D.s.
DEMOGRAPHIC CHARACTERISTICS OF THE CURRENT LABOR FORCE
Significant differences are found also in the sketchy data available on the demographics of the U.S. computer science and engineering work force.
The BLS reports that in 1990 32.5 percent of computer scientists and systems analysts were women, 5.6 percent were African American, and 3 percent were Hispanic. The NSF, which has no data past 1986, has estimated that in 1988, 31 percent of employed computer specialists were women, 0.4 percent were African American, 1.2 percent were Hispanic, and 6.6 percent were Asian.
The CRA does not attempt to examine anything but the doctoral population, and that only in academe. NRC data show the doctoral population in 1989 to include 11.6 percent women, 1 percent African Americans, 1.8 percent Hispanics, 0.2 percent Native Americans, and 12.2 percent Asians. Certainly there is general agreement that none of these groups except Asians is adequately represented in computer science or computer engineering. The level of under-representation for African American and Hispanic participants is quite different in the BLS and NSF data sets on the labor force.
A few other demographic facts are not in dispute. One is that computer science Ph.D.s are younger than their fellows in mathematics or in the physical sciences (Figure A.4). This does not mean that computer science is necessarily less likely than the other science and engineering fields to experience shortages of qualified faculty after the student-age population increases again in the latter half of the 1990s. But it does mean that faculty replacements will not necessarily be required in large numbers at the same time that growth in the student body exerts pressure for more faculty members.
The bottom line is that we do not know for sure how many individuals of what citizenship, what sex, and what race or ethnicity earn degrees at any level in computer science or computer engineering. We do not know for sure how many people are working in the broad area of computer science and technology, or how many are seeking employment requiring such expertise. We do not know whether there are significant numbers of persons with appropriate training to step in and fill available jobs if jobs should suddenly open up, or whether such jobs could be filled only with persons having lower qualifications than those being sought. In other words, we do not know whether supply and demand are now in balance for this broad area of expertise.
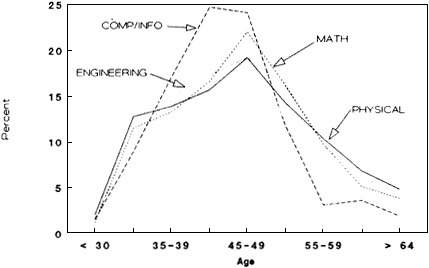
Figure A.4 Ages of employed computer science Ph.D.s compared to ages of employed Ph.D. holders in engineering, mathematics, and physical sciences, 1989. SOURCE: National Science Foundation (1990).
THE FUTURE
Data Indicators of Demand
All of us are concerned with whether supply will match, overmatch, or undermatch demand in the computer sciences for baccalaureate-level and for Ph.D. specialists. For dealing with the future, of course, no data exist. We operate with indicators of probable oversupply or undersupply, including unemployment rates and rates for starting salaries compared with those for other fields (and changes in starting salaries, where increases substantially above those offered in other fields are a definite indicator of a current shortage of graduates to fill open positions). Federal budgets, and changes in those budgets that affect research opportunities, also are considered, insofar as they are known.
Another indicator of trends in supply and demand is the amount of classified advertising and display advertising for the various specialties of the computer sciences. Whether the number of column inches of advertising space in the "Help Wanted" columns is rising or falling over time helps to identify the trends of undersupply or
oversupply. Unfortunately, there is no regular index of change in the amount of advertising for positions for computer scientists. Previously, the Demand Index for Scientists and Engineers, provided by the New York firm of Deutsch, Shea and Evans, counted column inches of advertising (classified and display) in a combination of several large daily papers and in several professional science and engineering journals, producing a 3-month average rolling index of such advertising as it related to the "norm" starting date of 1961. Unfortunately, that index ceased to be compiled after 1989—a real setback to efforts to keep track of relative changes in advertising for the science and engineering professions as a whole, and a particular loss during the past 24 months when the nation has been experiencing its strongest recession in a decade or more.
What We Do Not Know—and What We Need to Know—About Current Supply and Demand
There is no current, dependable measure to tell us, at any one time, whether supply and demand are in or out of balance, and by how much. Examining some of what we know (or what I thought we knew when I began this exercise) and listing some of what we do not know lead to the conclusion that it is also important to be sure that what we think we know actually is known. Although this appears obvious, I confess that I know less about the data on supply or demand in the computer sciences than I thought I knew a few weeks before I started diving, far too confidently, into this assignment.
I thought I knew, within a very few percentage points, how many computer scientists and engineers are graduating each year at each degree level; approximately how many faculty are currently employed teaching computer science; and within wide margins, about how many people now make their living in the United States based on their knowledge and use of computers. While an exact number for each of these questions is not required, it is vital to understand why multiple data sets provide different numbers, particularly when wide differences occur.
-
We need to know for sure how many graduates are produced, and we need to know what skills and knowledge can be assumed to have been acquired by persons earning degrees at different levels in computer science or engineering. The taxonomy needs to be clarified, so that as nearly as possible, we all mean the same thing when using the same words to describe specialists in computer science and technology.
-
We need to know at least a bit better than we do now how many people currently are working in computer science, and particularly, how many of them are in industry, in academic institutions, and in government. We need to know something about the distribution of levels of skills within this work force and whether a different mix of levels of skills might result in better utilization of talent and training.
-
We need to know in considerably more detail about our academic work force for computer science, including whether currently funded faculty positions are filled; how many such positions exist; whether vacant positions (if any) are for teaching slots, for research, for administration, or for some combinations of these tasks; and what the incumbents in occupied positions are responsible for doing. We also need to know the demographic characteristics of incumbents, and of the applicant pool.
Forecasting the Future
We have seen some of the difficulties in analyzing the current balance in supply and demand for computer specialists. Even more difficult, of course, is projecting the future, with its many unknown characteristics, of which the most important undoubtedly is the state of the economy. Lacking this information, we must apply whatever information is available to provide the best possible estimates of future needs and the likelihood of their being fulfilled.
We need to recognize the difference, in examining future scenarios, between "need" and "demand." My own definition is that ''demand" is "need plus money." No position can be filled until funding is available to pay the salary, no matter how much an individual may be needed to carry out necessary tasks.
Intuitively, we sense that the need for persons with a wide knowledge of how to design, to build, to assemble, to program, and to utilize computers will continue to grow, probably at a faster pace than Americans are prepared to practice those skills by virtue of their education and training.
As the number of college-age Americans starts to rise again beginning in 1995, the numbers of faculty needed both for growth and replacement also will rise. While funds for doctoral research in the area of computers, or in other areas that require use of computers, may continue to be below the amounts that American researchers need, or think they need, perhaps more of those researchers may find teaching jobs in higher education, both to prepare students who major in these fields and to provide user skills to all college students.
There will be too few white, non-Hispanic males interested in these fields to fill our needs. Recruitment of women and of American minorities is essential. The alternative is to continue training and employing foreign graduates until they so dominate the field that almost no Americans will choose to enter it. This alternative also assumes that sufficient numbers of highly motivated, very bright young people from other countries will want to come to the United States to learn all they can, and then will want to stay here instead of returning home. It further assumes that immigration laws will continue to permit, and possibly to encourage, such immigration.
Throughout the next two decades, there will be periods of a temporary surplus of candidates relative to jobs for almost every occupation. Those who persist and who hone their skills and credentials will flourish despite these ups and downs. It also appears fairly certain that during the next two decades, there will be one or more periods involving a shortage of well-qualified candidates relative to available jobs for computer science occupations as well as for those in many related professional fields. What is not so certain is whether there will be a sufficiently large pool of capable, interested, and qualified persons coming out of high school from which to recruit computer or other related specialists. While the numbers of high school students will be sufficient, too few of them currently show the necessary levels of achievement in required background areas that would make them good candidates for recruitment. Whether that will change sufficiently and soon enough to protect the American investment in computer expertise, or whether our dependence on foreign students, foreign graduates, and even foreign workers will increase, is not yet clear.
The safest prophecies for the future, however, carefully omit both ''data" and dates. I cannot tell how many computer specialists will be needed by what time; how many are likely to be needed at any particular period, at what level of training; or whether surpluses or shortages will occur in specific years. The most important question may be whether America can cope with imbalances, when they occur, in ways that will benefit the nation, or whether we will continue to lose ground to other nations.
BIBLIOGRAPHY
Astin, Alexander, et al. 1978–1991. The American Freshman, Fall 1990. Annual Series 1978–1990. Los Angeles: Cooperative Institutional Research Program of the American Council on Education and University of California, Los Angeles.
Bureau of Labor Statistics. 1990. Employment and Earnings. Washington, D.C.: Department of Labor, January.
Bush, George, and U.S. Governors. 1989. Joint Statement from the President's Education Summit with Governors, University of Virginia, Charlottesville, Va., September 27–28.
College Placement Council. 1991. Salary Survey, Final Report 1991. College Placement Council, Bethlehem, Pa., July.
Computing Research Association. 1990. The 1988–1989 Taulbee Survey Report: The Computing Research Association's Survey on the Production and Employment of Ph.D.'s and Faculty in Computer Science and Engineering . Washington, D.C.: Computing Research Association.
Computing Research Association. 1992. The 1990–1991 Taulbee Survey Report: The Computing Research Association's Survey on the Production and Employment of Ph.D.'s and Faculty in Computer Science and Engineering . Washington, D.C.: Computing Research Association.
Conference Board of the Mathematical Sciences. 1991. Report on Survey of Departments in Mathematics. Statistics and Computer Science. Draft tables and charts.
Dossey, John A., Ina V.S. Mullis, Mary M. Lindquist, and Donald Chambers. 1988. The Mathematics Report Card: Trends and Achievement Based on the 1986 National Assessment. Princeton, N.J.: Educational Testing Service.
Engineering Manpower Commission. 1991a. Engineering and Technology Degrees, 1990 . Annual Series, 1972–1990. Washington, D.C.: American Association of Engineering Societies.
Engineering Manpower Commission. 1991b. Engineering and Technology Enrollments, Fall 1990. Annual Series, 1972–1990. Washington, D.C.: American Association of Engineering Societies.
Federal Coordinating Council for Science, Engineering and Technology. 1991. First in the World by the Year 2000. FCCSET Committee on Education and Human Resources. Washington D.C.: Office of Science and Technology Policy.
Gittelsohn, John E. 1989. "Surging Economy Spurs Many Asians to Return Home." Chronicle of Higher Education, Vol. A 11–12 (November 15).
Gries, David, and Dorothy Marsh. 1991. The 1989–1990 Taulbee Survey Report. Annual Series. Washington, D.C.: Computing Research Association.
Gries, David, and Dorothy Marsh. 1991. "CS Produced 734 Ph.D.s in 1989–90; CE Added 173 for a Total of 907." Communications of the ACM 34(January):6–10.
Higher Education Surveys. 1990. Survey of Mathematics and Statistics Departments at Higher Education Institutions, Survey No. 5. National Science Foundation, National Endowment for the Humanities, and the U.S. Department of Education. Washington, D.C.: National Science Foundation, December.
Huckenthohler, G.J. 1990. Selected Data on Graduate Science/Engineering Students and Postdoctorates, Fall 1990 . NSF 90-324. Unpublished early release statistics, National Science Foundation, Washington, D.C.
Lapointe, Archie E., Nancy A. Mead, and Gary W. Phillips. 1989. A World of Differences: An International Assessment of Mathematics and Science. Princeton, N.J.: Educational Testing Service.
Long, Janice. 1990. "Changes in Immigration Law Eyed to Avert Shortage of U.S. Scientists." Chemical and Engineering News, August 20, pp. 19–20.
Madison, Bernard L., and Therese A. Hart. 1990. A Challenge of Numbers: People in the Mathematical Sciences. Committee on the Mathematical Sciences in the Year 2000, National Research Council. Washington, D.C.: National Academy Press.
Mathematical Sciences Education Board. 1991. Moving Beyond Myths: Revitalizing Undergraduate Mathematics. Committee on the Mathematical Sciences in the Year 2000, National Research Council. Washington, D.C.: National Academy Press.
Mullis, Ina V.S., John A. Dossey, Eugene H. Owen, and Gary W. Phillips. 1991. The State of Mathematics Achievement. Report No. 21-ST-03. Educational Testing Service, for the National Center for Education Statistics. Washington, D.C.: U.S. Government Printing Office, June.
National Center for Education Statistics. 1950–1989. Earned Degrees Conferred by U.S. Colleges and Universities. Annual Series, 1950–1984. Data for 1985 through 1989 unpublished.
National Research Council. 1991. Summary Report 1990: Doctorate Recipients from United States Universities. Series, 1972–1990. Washington D.C.: National Academy Press.
National Science Board. 1989. Report of the NSB Committee on Foreign Involvement in U.S. Universities. Washington, D.C.: U.S. Government Printing Office.
National Science Foundation. 1987. U.S. Scientists and Engineers: 1986. NSF 87-322, detailed statistical tables. Washington, D.C.: U.S. Government Printing Office.
National Science Foundation. 1988. Characteristics of Doctoral Scientists and Engineers in the United States: 1987. NSF 88-331. Washington, D.C.: U.S. Government Printing Office.
National Science Foundation. 1990. Future Scarcities of Scientists and Engineers: Problems and Solutions. Unpublished working draft, STIA Division of Policy Research and Analysis, Summer 1990, Washington, D.C.
National Science Foundation. 1991. Early Release of Summary Statistics on Science and Engineering Doctorates, 1990. Unpublished manuscript, STIA Division of Policy Research and Analysis, May, Washington, D.C.
National Science Foundation. 1991. Natural Science and Engineering Degree Production in the 1990s. Unpublished draft, STIA Division of Policy Research and Analysis, undated, Washington, D.C.
Office of Technology Assessment. 1991. Federally Funded Research: Decisions for a Decade. Washington D.C.: U.S. Government Printing Office, May.
Palca, Joseph. 1990. "Young Investigators at Risk." Science (July 27):351–353.
Silvestri, George, and John Lukaseiwicz. 1989. "Projections of Occupational Employment, 1988–2000." Monthly Labor Review 112 (November):42–64.
Task Force on Women, Minorities, and the Handicapped in Science and Technology. 1988 and 1989. Changing America: The New Face of Science and Engineering. Interim report, 1988, and final report, 1989. Washington, D.C.: U.S. Government Printing Office.
U.S. Department of Education. 1990. Earned Degrees Conferred by Institutions of Higher Education. Unpublished tables. Continuing series of annual publications since 1948.
Vetter, Betty M. (ed.). 1991. Professional Women and Minorities: A Manpower Data Resource Service. Ninth edition. Washington, D.C.: Commission on Professionals in Science and Technology, March.
White, John R. 1990. "President's Letter." Communications of the ACM 33 (No. 9, September):19–20.


