
Mystery Graphs
|
Explore sets rather than individual pieces of data Broaden the view of mathematics appropriate for the 4th grade Apply mathematics to real-life experience |
Suggested time allotment
Less than one class period
Student social organization
Students working alone
Task
Assumed background: This task assumes that the children have had extensive experience in dealing with sets of data, and, in particular, are familiar with interpreting data that are represented in line plots.
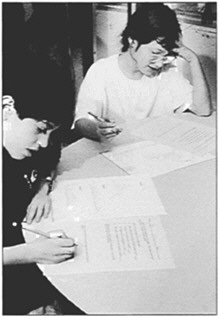
Presenting the task: The teacher should distribute the student materials and read enough of it to be sure that the children understand the task. It is also important to stress that the "classroom of fourth graders" is some other classroom — not theirs. In the pilot, it was necessary to clarify that "cavities" in question 1a refers to both filled and unfilled cavities.
Student assessment activity: See the following pages.
Name _________________________________________ Date ______________
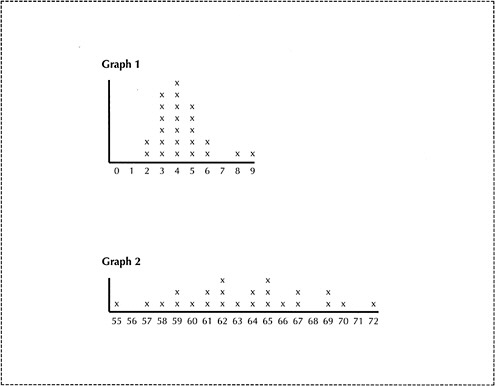
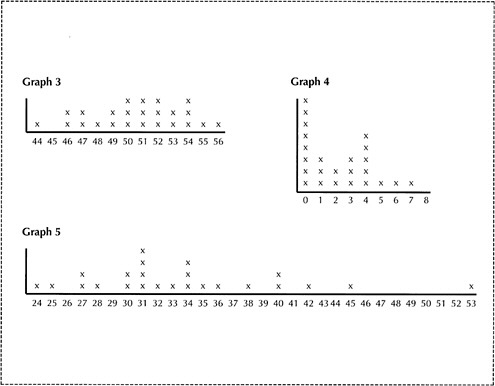
Look at the five graphs on the next pages. Each graph shows something about a classroom of fourth graders.
-
Which of the five graphs do you think shows:
-
The number of cavities that the fourth graders have?
-
The ages of the fourth graders' mothers?
-
The heights of the fourth graders, in inches?
-
The number of people in the fourth graders' families?
-
-
Explain why you think the graph you picked for c is the one that shows the heights of fourth graders.
-
Why do you think the other graphs don't show the fourth graders' heights?
Rationale for the mathematics education community
This task puts a premium on looking at data sets, as opposed to individual pieces of information. This is a fundamental notion that should take an increasing role in the elementary mathematics curriculum. The task also gives children the opportunity to relate the graphical representations to their own experiences as fourth graders.
Ordinarily, of course, one would want children to have plenty of chances to collect, display, and analyze their own data, as the NCTM Standards suggest. If the task is going to fit within a single class period, however, there is not enough time to create five graphs for comparison. As a result, this task uses data that have already been collected from some hypothetical fourth grade. Clearly other assessment tasks (like the Hog Game and Buttons tasks in this collection) must include the collection, display, and analysis of data.
Task design considerations: Children seem naturally interested in data about people, particularly people of their own ages; this is one reason for choosing a hypothetical fourth-grade class as the basis of these data. The children will naturally bring their own experiences with heights, ages, family size, and dental health with them to the task. When using such situations for assessment purposes, one must be careful to use values of the data to which all the students can relate equally well. There may be cultural variations in family sizes or in the ages of fourth graders' mothers, for example. To take this into account, the ranges of Graphs 1 and 5 are large enough to encompass every students' own family size and mother's age.
Questions similar to the one about heights could be asked about mothers' ages, family sizes, or cavities. The only reason such questions are not included is to save assessment time; the intent was to give an example of a task that could be done in less than one class period.
To some extent, this is a task that measures children's prior knowledge about the real world — about how many inches tall they are, how old their mothers are, and so on. If one is concerned with children's abilities to connect mathematics with their world of experience, this is a reasonable expectation.
The style of drawing line plots should be the same as the style to which the student is accustomed.
Ideally, the five graphs should be displayed so that the student can see them all at once.
Variants and extensions: A natural instructional follow-up to this task is to ask the students to compile data on heights, cavities, etc., from their own class, to compare with the data given.
Using just the data presented here, one could pose problems like: "Suppose Graph 2 really did show heights in inches. Whose heights could they be?" "Suppose Graph 3 showed the ages of the mothers of students in some grade level in our school. Which grade could that be?" "What other kinds of data could Graph 1 be showing?"
Protorubric
Characteristics of the high response:
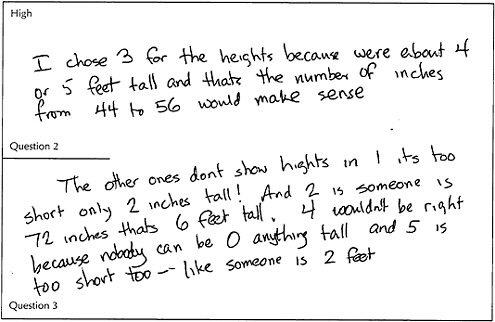
The high response shows a full understanding of the relationship between the graphs and the data they represent.
The responses for question 1 are all correct (a. 4; b. 5; c. 3; d. 1). Questions 2 and 3, taken together, should explain that Graph 3 shows a reasonable range of fourth graders' heights, and that ranges of data in the other graphs are not as reasonable. The only real alternative candidate for the heights is Graph 2, but that would imply that there are fourth graders who are six feet tall.
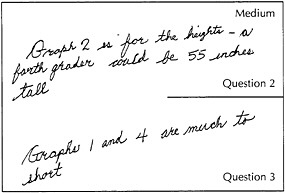
Characteristics of the medium response:
Graph 1 and Graph 4 are interchanged (number of cavities and number of family members); or Graph 2 is used in place of Graph 3 or Graph 5; or Graphs 3 and 5 are interchanged. Nonetheless, graphs showing the correct general orders of magnitude are selected. Some portions of the student's justifications are reasonable.
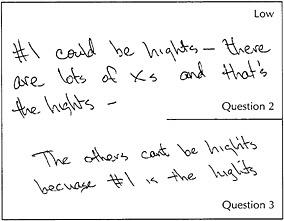
Characteristics of the low response:
At most one graph is chosen that shows totally unrealistic data (e.g., Graph 5, with a range from 24 to 53, is selected for the number of people in the families). Responses to questions 2 and 3 are missing or indicate that the student cannot interpret the graphs, or they do not show any reasonable sense of the magnitudes of more than one of the items.
Reference
An earlier version of this task was developed by TERC (Cambridge, MA) for Education Development Center (Newton, MA).


