FURTHER EXAMINATION OF THE EMPIRICALLY BASED PHYSICIAN STAFFING MODELS
INTRODUCTION
From the study's inception, an underlying premise has been that empirical observations on the current practice of medicine in the VA can be useful in helping to determine how many physicians the VA should have to meet its mission-related demands. How this can be accomplished in practice has been demonstrated in detail in chapter 4 of Volume I.
The primary purpose of this concluding section of the Supplementary Papers is to examine further the statistical validity of selected physician staffing models presented in chapter 4. In addition, for a subset of these models a certain physician productivity index frequently derived in microeconomic analyses of input-output relationships— the “marginal productivity” of an input—will be developed; this index will be used to investigate the output gain expected from incremental increases in physician staffing in a given patient care setting.
The basic idea undergirding the analyses in chapter 4 of Volume I is that statistical models can be developed describing the relationships between patient care workload, physician Full-Time-Equivalent Employees (FTEE) (by specialty and including residents), and other productivity-influencing factors. With data drawn from the current VA system, these models can be statistically estimated, i.e., their unknown parameters are given specific values. From these estimated models, predictions can be derived about the amount of physician FTEE required to meet both current and projected future workload levels. Such analyses can be performed on a specialty-specific basis and at different levels of aggregations—from the hospital ward level all the way to the derivation of national-level estimates.
The empirically based physician staffing models (EBPSM) are grounded in the current practice of medicine in the VA and provide a base against which expert judgment models can be evaluated. Specifically, the VA decision maker can use these EBPSM in conjunction with the expert judgment models to arrive at decisions about the appropriate level of physician staffing in any given setting.
See chapters 6 and 7 of Volume I for a detailed exposition and justification of the committee's proposed “Reconciliation Strategy” for balancing empirically based and expert judgment physician staffing estimates.
As a prelude to the new studies reported here, the nature and scope of these empirically based models will be briefly summarized.
OVERVIEW OF THE EBPSM
In Volume I the committee defined, developed, and ultimately endorsed two alternative, complementary variants of the empirically based physician staffing models.
In the production function (PF) variant of the EBPSM, the rate of production of patient workload (e.g., bed-days of care) for a given patient care area (PCA) (e.g., the medicine bed service) at a VA medical center (VAMC) is hypothesized to be related to such factors as physician FTEE allocated expressly to patient care in that PCA; the number of residents, by postgraduate year, assigned to that PCA; nurse FTEE per physician FTEE there; support-staff FTEE per physician FTEE there; and other variables possibly associated with physician productivity (e.g., the VAMC's affiliation status).
Each VAMC is divided into 14 or fewer (depending on the scope of services offered) PCAs: inpatient care—medicine, surgery, psychiatry, neurology, rehabilitation medicine, and spinal cord injury; ambulatory care—medicine, surgery, psychiatry, neurology, rehabilitation medicine, and other physician services (including emergency care and admitting & screening); and long-term care—nursing home and intermediate care.
A PF is estimated statistically for each PCA. To derive the total physician FTEE in a given specialty (e.g., neurology) or program area (e.g., ambulatory care) required for patient care at a given VAMC, one must solve for the FTEE required to meet patient workload on each relevant PCA, then sum across PCAs.
In the inverse production function (IPF) variant of the EBPSM, specialty-specific rather than PCA-specific models are estimated. For a given specialty (e.g., neurology), the quantity of physician FTEE devoted to patient care and resident education across all PCAs at the VAMC is hypothesized to be a function of such factors as total inpatient workload associated with that specialty (e.g., total bed-days of care for patients assigned a neurology-associated diagnosis-related group); total ambulatory care workload associated with the specialty; total long-term care workload associated with the specialty; the number of residents in that specialty at the VAMC, by postgraduate year; and
other variables possibly associated with physician time devoted to patient care and resident education.
There are separate facility-level IPFs for each of the following 11 specialty groups: medicine, surgery, psychiatry, neurology, rehabilitation medicine, anesthesiology, laboratory medicine, diagnostic radiology, nuclear medicine, radiation oncology, and spinal cord injury. (This latter group consists of physicians in any specialty who are assigned to the spinal cord injury “cost center” in the VA personnel data system.)
For each specialty, to derive the total number of physicians required for patient care and resident education on the PCAs, one must substitute the appropriate values of workload, resident FTEE, and other control variables into that specialty's IPF, then solve directly for the corresponding physician FTEE level.
Both the PF and the IPF deal with only a portion of total physician FTEE at the VAMC, albeit a very important and quantitatively significant portion in each case. The fraction of physician FTEE allocated to patient care only—the focus of the PF variant—will vary by specialty and facility, of course, but it rarely falls below 65 percent and generally lies in the 70 –95 percent range (see Table 9.1 in Volume I). The sum of FTEE devoted to patient care and resident education—the focus of the IPF variant —generally lies in the 80–95 percent range. (The rationale for including both patient care and resident education in the IPF and only patient care in the PF is discussed in detail in chapter 4 of Volume I.)
It follows that, under either the PF or IPF variant, total FTEE required at the facility is the sum of the model-derived estimate plus separate estimates for FTEE components not incorporated in the model. Included in the latter are FTEE for research, continuing education, and other miscellaneous assignments. The process of deriving total physician FTEE for a given specialty or program area at a VAMC is illustrated in chapter 6 of Volume I.
Reported in chapter 4 were estimated PF models for all 14 PCAs and IPF models for all 11 specialties, with several equations singled out for additional analysis. For selected PFs and IPFs, the model-derived physician FTEE at a given VAMC in FY 1989 was compared with the actual FTEE reported there for that specialty. These calculations were performed for four actual VAMCs (whose identities were masked). These PFs and IPFs were then used as the centerpieces of an algorithm to derive specialty-specific physician requirements for the four selected VAMCs for two future fiscal years, 2000 and 2005. Chapter 4 concluded with the committee's recommendations on a range of future data gathering and statistical analyses to improve the EBPSM over time.
In this concluding section of Volume II, the committee demonstrates how an important subset of these proposed statistical analyses might proceed and the types of insights that can be gained.
This section is divided into several parts. Following this introduction, the next part illustrates two alternative tactics for examining the statistical plausibility of the estimated PFs and IPFs: (1) through a simple examination of residual plots (a standard approach already utilized in Volume I) and (2) through a newer, more complex approach termed “bootstrapping,” which has been applied in a number of domains recently but not (to the committee's knowledge) to health manpower staffing models. This part concludes with a brief examination of one other modeling issue: the robustness and stability of the PF and IPF equations to alternative specifications of the variables used to measure inpatient, outpatient, and long-term care workload.
The final part focuses on the PF variant of the EBPSM and the calculation of the marginal product (MP) of the internist, the surgeon, and the psychiatrist in the inpatient medicine, surgery, and psychiatry PCAs, respectively. While such MP calculations are of particular interest to researchers working in the area, it must be acknowledged that the index itself is not instrumental in the calculation of physician requirements. Rather, it may provide some insight into whether the PF model from which it is derived is a reasonable representation of the production process.
All analyses below focus either on the PFs estimated for inpatient medicine, inpatient surgery, or inpatient psychiatry, or on the IPFs estimated for the specialty groupings of medicine, surgery, or psychiatry. This concentration allows for a demonstration of the major analytical points, while keeping the presentation tractable; moreover, these three specialty groupings accounted nationwide for roughly 75 percent of all VA staff physician FTEE in FY 1989 (see Table 2.1 in Volume I).
STATISTICAL EVALUATION
To set the stage for the analysis, the general functional specification of both the PF and the IPF will be reviewed, along with the behavioral assumptions that justified the approach to statistical estimation adopted in each case. The multi-step regression strategy employed in the selection of the “final” version of each PF and IPF, i.e., the version appearing in Volume I, will be described. Next, for ease of reference the six estimated models that will be examined here in some detail are reproduced from Volume I: the inpatient medicine, inpatient
surgery, and inpatient psychiatry PFs, and the medicine, surgery, and psychiatry IPFs. With these matters in hand, the discussion then proceeds to residual plots and bootstrapping.
Production Function: General Form
The general form of the PF variant endorsed by the committee is presented below; for ease of cross-reference, the equation numbers assigned in Volume I are used below wherever appropriate.
Wij=f[{StaffPhysij}, {ConPhysij}, {Resij},
C&Aij, WOCij, {NPPij}, Nurseij,
Supportij, Prodfactij, ERRORij], (4.9)
|
where |
|
|
Wij |
=the annual rate of production of workload in PCA j of VAMC i; |
|
{Staffphysij} |
=a set of variables, each of which takes the form Staffphysijk=the amount of FTEE allocated to direct patient care in PCA j of VAMC i for staff physicians based in cost center k, where each k corresponds to one of the 11 specialty groups examined here in detail; |
|
{ConPhysij} |
=a set of variables for physicians under contract to VAMC i, such that ConPhysijk=the contract physician FTEE from specialty k devoted to PCA j; |
|
{Resij} |
=a set of variables to account for the net productive contribution of residents, with each variable of the form Resijy=the amount of postgraduate year y resident FTEE allocated to PCA j at VAMC i; |
|
C&Aij |
=for non-VA physicians who perform consulting and attending duties on a fee-for-visit basis, the amount of FTEE allocated to PCA j at VAMC i; |
|
WOCij |
=for non-VA physicians who perform consulting and attending duties without (monetary) compensation, the amount of FTEE allocated to PCA j at VAMC i; |
|
{NPPij} |
=a set of variables, each of the form NPPijm=the amount of FTEE of nonphysician practitioner type m (e.g., physician assistant) assigned to PCA j at VAMC i; |
|
Nurseij |
=the amount of nursing service FTEE allocated to PCA j at VAMC i; |
|
Supportij |
=for all personnel categories excluding physicians and nurses (and, as appropriate, also excluding psychologists and social workers), the total FTEE allocated to PCA j at VAMC i; |
|
Prodfactij |
=one or more variables for factors (e.g., capital equipment) influencing the productive efficiency of physicians and other providers in PCA j at VAMC i; |
|
ERRORij |
=the random-error term for PCA j at VAMC i, assumed to be normally distributed with mean zero and constant variance. |
Each of the 14 PFs was specified as a flexible quadratic functional form (see Jensen and Morrisey (1986a,b) and estimated by ordinary least squares.
This single-equation approach assumes, among other things, that each independent variable (e.g., internist FTEE) is a nonstochastic determinant of the dependent variable, workload; thus, it is assumed ipso facto that inputs and outputs are not jointly determined in a mutually interactive fashion. In production models of the profit-maximizing firm, inputs and output are jointly determined, in theory; hence, single-equation approaches are problematic, yielding biased model estimates unless special assumptions are imposed (which is often the case).
Moreover, profit maximization implies cost minimization, which implies that the “firm” being modeled is operating with maximum productive efficiency. That is, given the level of inputs chosen, the resulting output rate is the maximum attainable. Interpreted literally, this string of assumptions leads to additional difficulties in applying the standard ordinary least squares regression
procedure to estimate the PF. Since, for given input levels, observed output can never exceed, by definition, the output rate indicated by the production function (i.e., along the production “frontier”), ERROR is nonpositive and hence cannot be normally distributed with mean zero. Unbiased predictions of workload, conditional on input levels, can be obtained only if certain additional restrictions are imposed on ERROR (Kmenta, 1986).
In response, certain “frontier” production function models and estimation techniques have been developed (see Forsund et al., 1981). But these approaches have not been applied to health manpower analysis, with one partial exception: a recent effort to use “data envelopment analysis” —a nonstatistical procedure built around linear programming models—to study technical efficiency in VA hospitals (Sexton et al., 1989).
These technical concerns notwithstanding, the committee concluded that the nature of medical services production in the VA, in both its behavioral and technical dimensions, justifies the decision to estimate PFs in the most straightforward fashion, using ordinary least squares.
A VAMC is a public-sector organization charged with a multiobjective mission, but maximizing profits is not one of them. Rather, it is assumed that each VAMC attempts to meet its patient care mission in a way that balances several concerns: that eligible veterans are treated in a timely manner; that the quality of care is acceptable; and that budget, other resource, and administrative constraints are met. Consistent with this, it is assumed for the PF analysis that a VAMC adjusts inputs and workload in a step-sequence process: Subject to resource and budget availability, the VAMC sets input levels for each fiscal year in accordance with projected workload. Then, in the course of the year, it attempts to modulate (up or down) the rate of workload so that a clinically acceptable relationship is maintained between workload and inputs. If it is assumed that this workload adjustment process is subject to random error—that is, the VAMC will typically over- or undershoot a bit in trying to match workload to available resources—then ERROR will be normally distributed with zero mean.
The net result is that certain problems of bias and inefficiency that threaten PF estimates from the for-profit sector should not be similarly expected here.
Although there is an expectation that VAMCs will produce patient care services with high technical efficiency, the incentives to do so may be weaker than in the private sector (though they have been strengthened in recent years). The recent application of data envelopment analysis indicated that about one-third of all VAMCs were not delivering patient care with maximum cost efficiency (Sexton et al., 1989).
Although a substantial part of this variability may be attributable to differences across VAMCs in the commitment to teaching and research (which affects the relative amount of staff physician time available for patient care), the end result is the following: in a given sample of VAMCs, variation can be expected in the efficiency with which inputs are transformed into output. Even if this study's PFs were to include variables to control for differences in teaching and research, considerable variability still could be expected across VAMCs in the rate of workload, given any fixed set of input levels. These results lend support to the assumption that ERROR is not only random, but normally distributed with zero mean in the PF models specified here.
Inverse Production Function: General Form
In the PF variant, the basic question is: What factors account for the production of patient care workload? In the IPF, the basic question is: What factors account for the observed level of staff physician FTEE?
The IPF's underlying assumption is that the amount of physician FTEE from a given specialty required for patient care and resident education is a function of the volume of patient care workload to be produced, the number of residents to be taught on the PCAs, and possibly other factors influencing the relationship among workload, resident education, and staff physician requirements.
From a cause-and-effect standpoint, the basic behavioral assumption in the IPF variant (in contrast with the PF) is that the VAMC adjusts physician FTEE levels in response to a given projected workload level, controlling for other factors. Thus, the volume of workload per period cannot be significantly modulated (i.e., it is “exogenously” determined by demand-influencing factors beyond the VAMC's control).
That the PF and IPF have different underlying assumptions does not in any way constitute an empirical contradiction. Every model has, by definition, its defining assumptions; and the PF and IPF are models offering alternative perspectives on the same underlying production process.
In concept, an IPF can be estimated for each specialty-PCA combination (e.g., for neurology requirements on the inpatient medicine PCA), or for each specialty on a facility-total basis by aggregating across PCAs (e.g., for neurology requirements for all 14 PCAs combined). However, efforts to estimate PCA-specific IPFs for each specialty produced equations frequently exhibiting poor goodness of fit and coefficient estimates whose algebraic signs
were counterintuitive. Hence, the focus in this study is exclusively on facility-level IPFs, whose aggregated FTEE observations yield more reliable estimates.
Both the PF and the IPF are pursued because each variant has its strengths and drawbacks, conceptually and statistically, and because together they can play complementary roles in helping the VA decision maker determine appropriate staffing (see the extended discussion in chapters 3, 4, 6, and 11 of Volume I).
The general form of the IPF variant of the EBPSM is:
![]() =g[{Wik}, {Resik}, {NPPik}, Prodfactik, ERRORik] (4.10)
=g[{Wik}, {Resik}, {NPPik}, Prodfactik, ERRORik] (4.10)
Originally, the general specification of the IPF also included variables for nurses and support staff. But after a number of statistical analyses, it became clear that the physician-substitutive role these providers are hypothesized to play could not be modeled adequately at the facility level. Rather, the PCA is the more appropriate level of aggregation for studying these relationships in the production of workload.
One additional distinction between the IPF and the PF lies in the scope of what is included in the physician FTEE variable. In the IPF, an attempt is made to account for all physician FTEE devoted to VA mission-related activities across PCAs. Patient care and resident education typically dominate these activities. (Because the PCA-related part of research FTEE cannot be separated from total research FTEE in the current data systems and because most research occurs off the PCAs, research is excluded from the IPF equation; to derive total physician FTEE through an IPF (or a PF) approach, research FTEE must be incorporated in a separate step.) Hence, the dependent variable in Equation 4.10 incorporates all patient-care-designated FTEE (including physicians under contract) plus FTEE allocated to resident instruction.
Since the PF attempts to account for the distinct factors involved in producing workload, it is the workload-producing component of physician FTEE—namely, the part allocated to direct care in the data system—that is the most appropriate basis for defining the variable StaffPhys in Equation 4.9. Some early versions of the PF in which StaffPhys was defined as the sum of FTEE for patient care and resident education did not perform as well statistically as similar specifications with StaffPhys based on patient care FTEE only. (This may have been due to multicollinearity induced by a positive correlation between physician FTEE for resident education and the RES variables.) Moreover, when the direct-care and resident-education parts of physician FTEE were run as separate variables in PF equations for various PCAs, the former was invariably significant and the latter was almost never significant. In fact, the same was also true in all PF equations where staff physician FTEE for direct-care and contract-physician FTEE (ConPhys) variables were entered together. Hence, in the PF models presented below, StaffPhys always appears in some form, whereas neither ConPhys nor a variable for FTEE devoted to resident education merits entry.
Regression Strategy for Selecting PFs and IPFs
Each production function and inverse production function reported in Volume I emerged after an extensive model selection process in which a number of alternative specifications were tested in a well-defined sequence of steps. The aim, for each PF and IPF, was to generate the best-fitting clinically plausible model, given the available data (and, hence, the variables that could be satisfactorily constructed).
For a given PF or IPF, the model selection process proceeded through the steps summarized below. The form of the model continually evolves as the steps progress; thus, the term “current” model below means the form of the model at that particular step in the selection process:
-
Since the number of observations for a given model was small (ranging from about 80 to 160) relative to the number of potential variables, a predetermined list of candidate variables was made, including interaction terms, based on assumptions about the workload production process.
-
Model reduction was performed on all candidate main-effect (first-order) terms by using both backwards- and stepwise-elimination regression techniques. If the model chosen by these techniques differed, a choice was made based on clinical judgment; in practice, this rarely became necessary. The statistical cut-point used here and throughout the selection process was equivalent to a two-tail t-test with a total probability of Type I error of 0.05.
-
Candidate variables were grouped together according to common characteristics. For example, all physician FTEE variables made up a set, as did all resident category FTEE variables, all RAM (hospital) group variables, and so on.
-
All relevant nonlinear terms were evaluated, with a number of models run concurrently. The variables for these models were selected from the main effects chosen in step (2) and consisted of a set of quadratic terms, each coupled with its corresponding linear term. Multiple partial F statistics were used to test the significance of the nonlinear terms. If a multiple partial F was significant, the one nonlinear term that performed the strongest, and its corresponding linear term, were added to the model. This current model was then evaluated to determine whether any of its terms were no longer significant; if so, they were dropped.
-
Each main effect and quadratic term (from the significant multiple partial F test) not included in the current model was tested for entry, in turn. Among the significant variables at this stage, the one contributing the most information was added to the model while any other variables that now appeared to be nonsignificant were dropped.
-
This process continued until all multiple partial and simple partial F statistics were nonsignificant for those main-effect and nonlinear terms not in the model.
-
Interaction term candidates were tested next. The statistically strongest interaction term was added to the model and any variables no longer significant were removed. This process was repeated for other viable interaction
-
terms. Then all sets of main effects, nonlinear terms, and interactions were tested in a final sequence of iterations that continued until no multiple partial or simple partial F statistic was significant (p<0.05) for any variable not in the model.
Three Estimated PFs
The general framework for these estimated PF equations is captured in Equation 4.9. Where possible, the variable names introduced there and in the preceding section are adopted below; but, because of the greater level of specificity here, some additional definitions are required. For simplicity, subscripts are suppressed, but it is understood that all variables in a given PCA equation are specific to that PCA at VAMC i. For example, Wij in Equation 4.9 is written simply as W.
Upon its first appearance, each variable is formally defined; in subsequent appearances, it is defined again only when necessary to avert ambiguity.
The sample size for each PF equation reflects the number of VAMCs with that particular type of PCA.
The number in parentheses beneath each estimated coefficient is its t-statistic, indicating its statistical strength; ![]() measures the overall goodness of fit of the estimated equation to the data.
measures the overall goodness of fit of the estimated equation to the data.
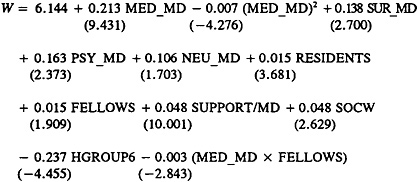
Inpatient Medicine
(4.11)
with ![]() =0.882 and N=159
=0.882 and N=159
|
where |
|
|
W |
=ln[Wij+1]=the natural logarithm of total WWUs, plus 1, produced in the inpatient medicine PCA during the fiscal year; |
|
MED_MD |
=VA staff physician FTEE from the medicine service allocated to direct care in the inpatient medicine PCA; |
|
(MED_MD)2 |
=a variable testing for a nonlinear relationship between VA staff internist FTEE and workload production—specifically, that there are diminishing marginal returns to increases in internist FTEE; |
|
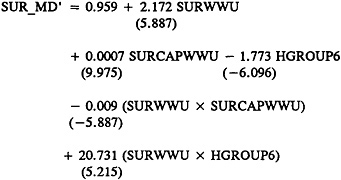
SUR_MD |
=VA staff physician FTEE from surgery allocated to direct care in the inpatient PCA; |
|
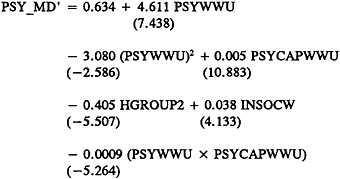
PSY_MD |
=VA staff physician FTEE from psychiatry allocated to direct care in this PCA; |
|
NEU_MD |
=VA staff physician FTEE from neurology allocated to direct care in this PCA; |
|
RESIDENTS |
=second- and third-year-resident FTEE allocated to this PCA (interns were omitted after statistical testing); |
|
FELLOWS |
=FTEE of residents PGY 4 and above allocated to this PCA; |
|
SOCW |
=social worker FTEE allocated to this PCA; |
|
SUPPORT/MD |
=support-staff FTEE divided by total FTEE for physicians involved in hands-on delivery of care in the inpatient medicine PCA, defined to include internists, surgeons, psychiatrists, neurologists, and rehabilitation medicine |

|
where |
|
|
OTHER_MD |
=total FTEE allocated to inpatient surgery PCA by VA staff physicians not in medicine, surgery, psychiatry, neurology, or rehabilitation medicine cost centers; |
|
NURSE/MD |
=nursing-staff FTEE divided by total FTEE for physicians involved in hands-on delivery of care in the inpatient surgery PCA, defined to include internists, surgeons, psychiatrists, neurologists, and rehabilitation medicine physicians (hereafter, this variable will be labeled more succinctly, “nursing-staff FTEE per total physician FTEE in this PCA”); |
|
(RESIDENTS+FELLOWS) |
=total FTEE of residents PGY 2 and above allocated to this PCA; |
|
HGROUP2 |
=a categorical variable assuming a value of 1 if the facility is in RAM Group 2 (small general unaffiliated VAMC); and |
|
(MED_MD×OTHER_MD) |
=an interaction term for the joint influence of VA staff internists and VA “other” physicians on the rate of workload production in the inpatient surgery PCA. |

Three Estimated IPFs
The general framework for these estimated IPF equations is captured in Equation 4.10. When possible, the variable names introduced there and in the previous section are adopted below, but, as with the PF equations, more specific
definitions are required in some instances. Subscripts again are suppressed, but it is understood that all variables in a particular IPF are specific to the equation's associated specialty. For example, Wik in Equation 4.10 becomes simply W.
For computational reasons only, all workload variables are divided by the constant 10,000; this affects the absolute size of the corresponding coefficient estimate but not its algebraic sign or statistical significance.
The sample size for each specialty's IPF is a reflection of the number of VAMCs that reported data from that specialty's cost center in FY 1989.
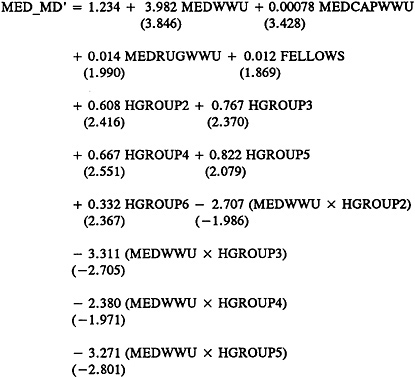
Medicine
(4.25)
with ![]() =0.595 and N=164
=0.595 and N=164
|
where |
|
|
MED_MD' |
=the natural logarithm of the sum of all VA internist FTEE devoted to direct care (i.e., the sum of all MED_MD variables) across all PCAs, plus total internist FTEE allocated to resident training across all PCAs, plus 1; |
|
MEDWWU |
=total medicine WWUs produced during the fiscal year in the inpatient PCAs of medicine, surgery, psychiatry, neurology, and rehabilitation medicine (divided by 10,000); |
|
MEDCAPWWU |
=total CAPWWUs produced during the fiscal year in the ambulatory PCAs of medicine and other physician services (divided by 10,000); |
|
MEDRUGWWU |
=total RUGWWUs produced during the fiscal year in the long-term care PCAs of nursing home and intermediate care (divided by 10,000); |
|
FELLOWS |
=total FTEE of medicine residents PGY4 and above at the VAMC; and |
|
HGROUP3 |
=a categorical variable assuming a value of 1 if the facility is in RAM Group 3 (midsize affiliated). |
The CAPWWU total covers not only ambulatory medicine, but also the other physician services PCA because the latter includes the emergency unit and admitting & screening, important clinic stops with heavy internist involvement.
Model Assessment Tactic I: Residual Plots
Note that the ERROR terms shown in the general PF model (4.9) and general IPF model (4.10) are not in fact estimated (as evidenced in the six equations shown just above). Nonetheless, “observations ” on this random component are indeed generated in each case and can play a useful role in assessing the statistical appropriateness of the estimated model.
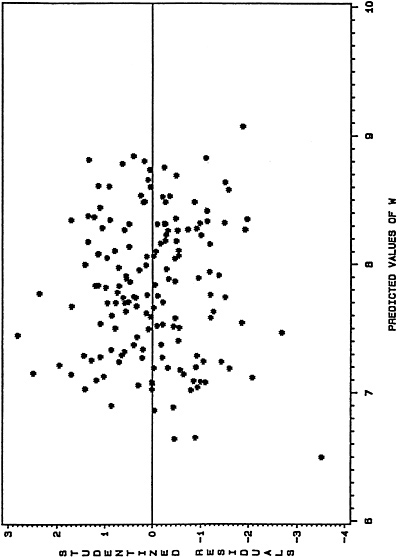
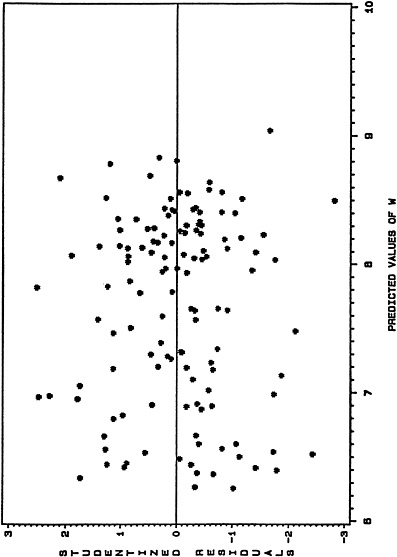
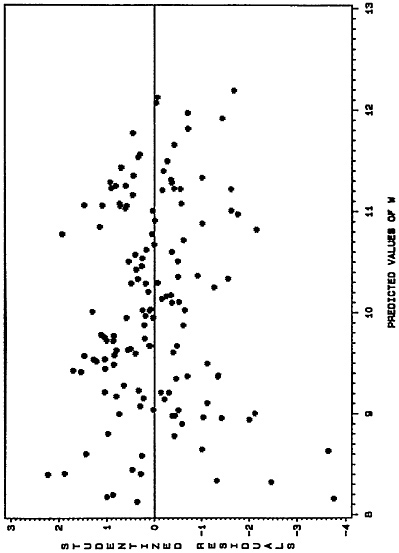
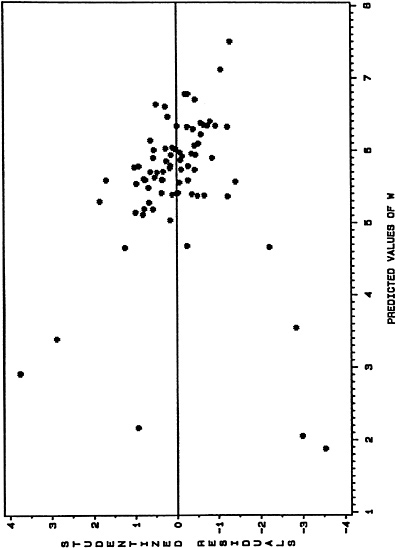
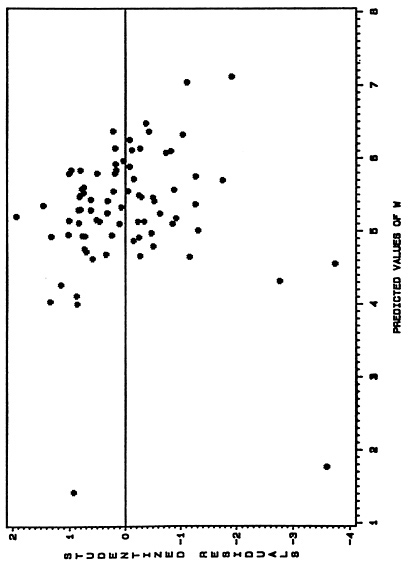
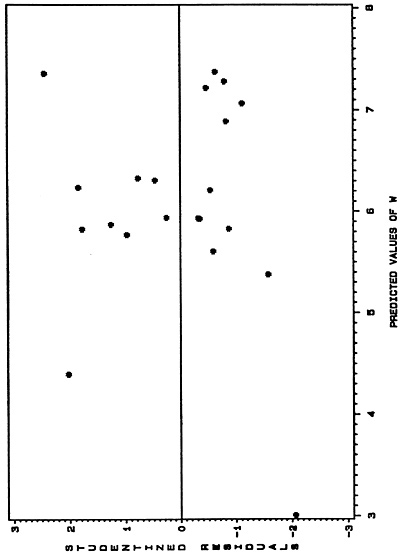
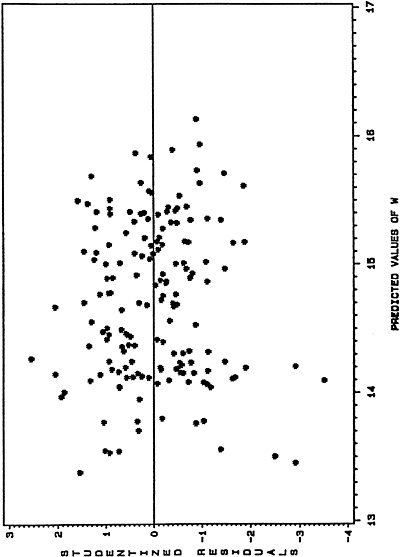
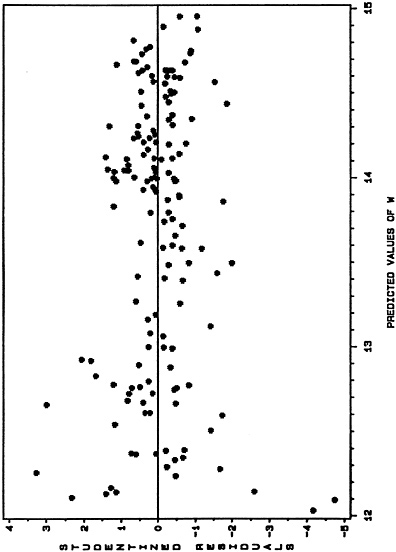
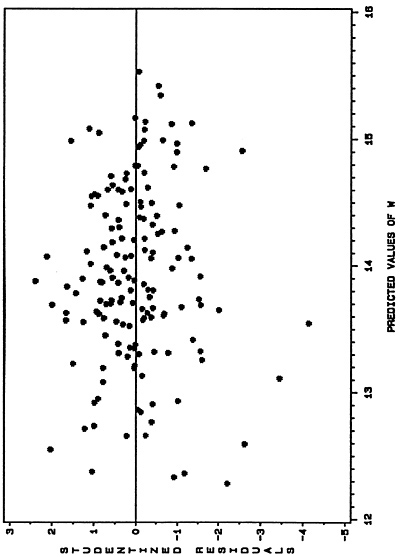
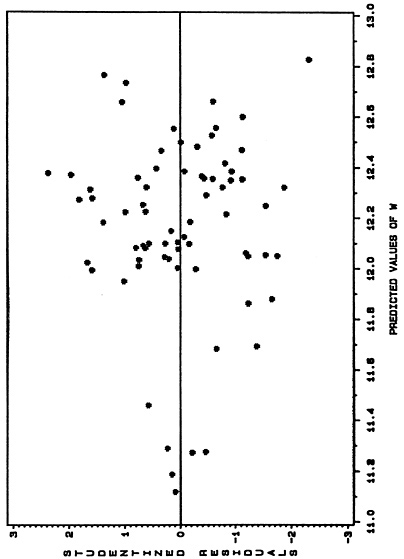
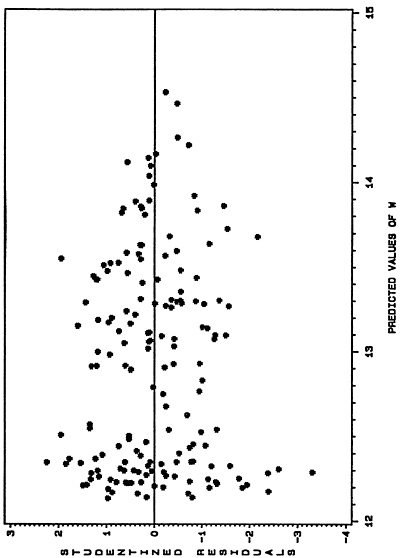
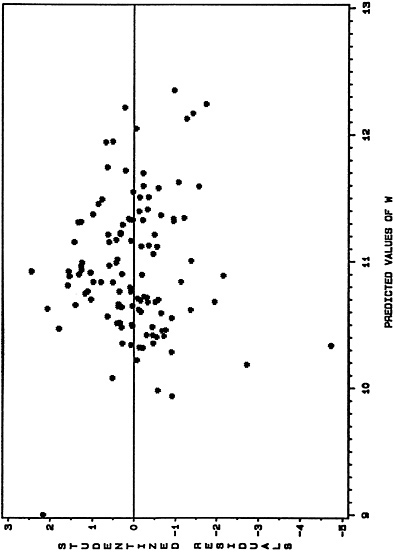
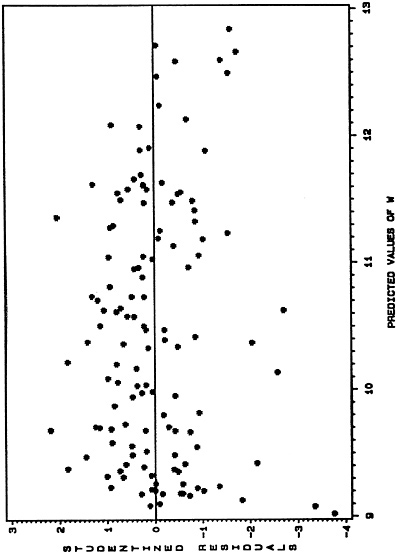
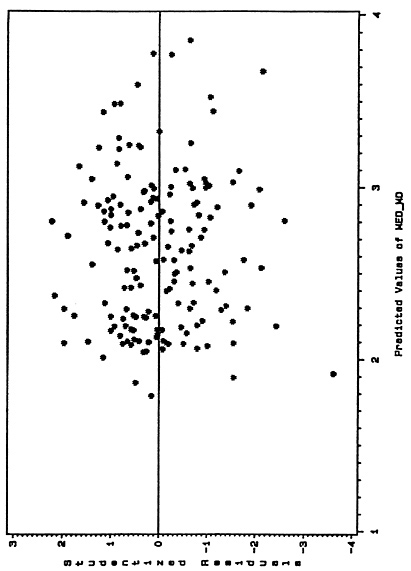
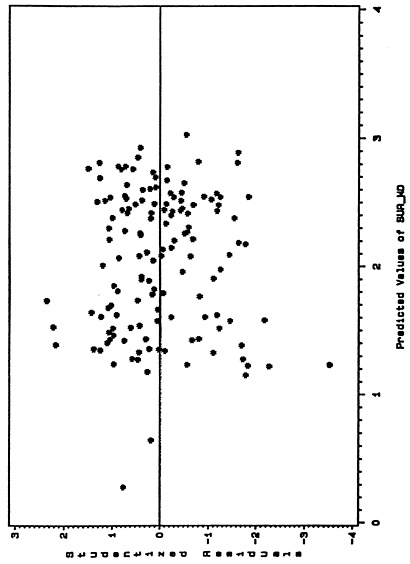
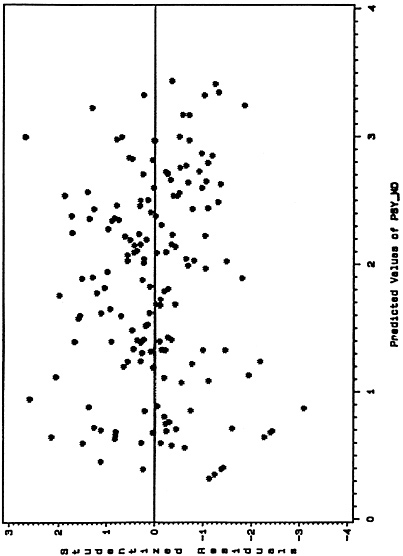
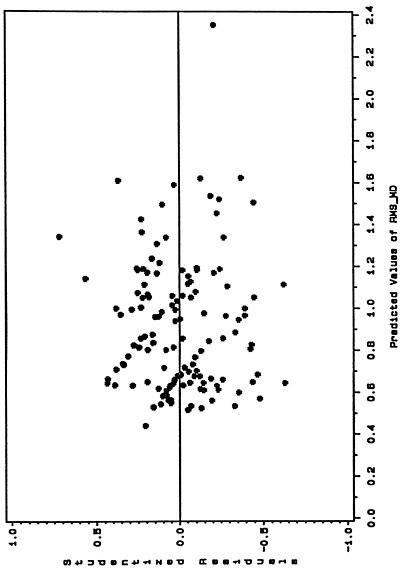
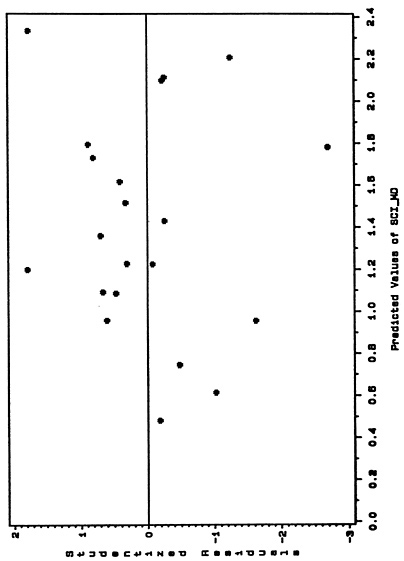
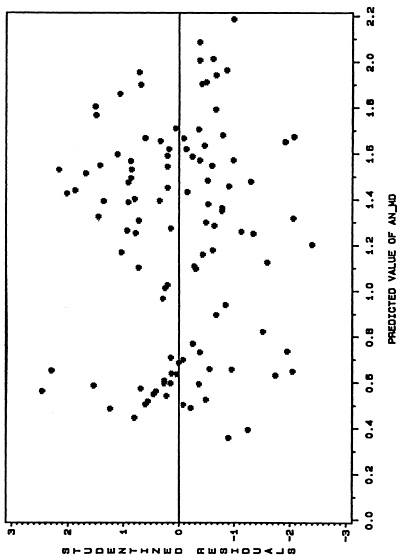
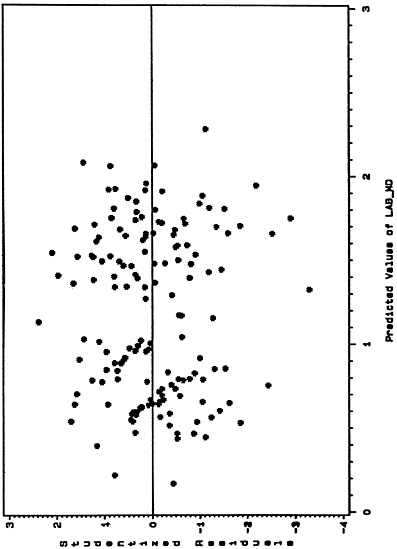
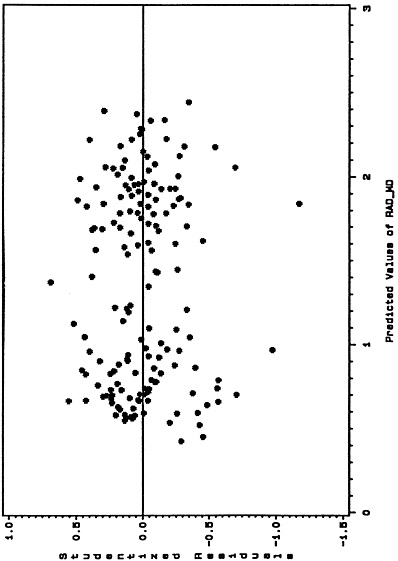
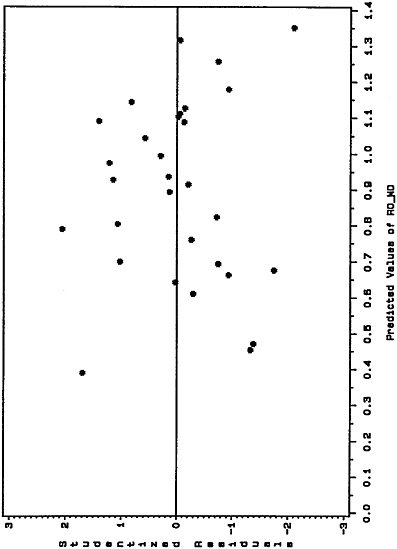
Consider, for example, any estimated PF. For the ith observation (VAMC) in the data set, there was an observed value of workload, W; and there will be a predicted workload value, W, obtained by substituting into the estimated equation the PCA-specific independent variable values for this facility. The difference between these two values is termed the ith residual. Taken across all units in the sample, these residuals can be regarded as a sample generated from the random variable ERROR. If the standard least-squares assumptions about ERROR hold—namely, that it is normally distributed with zero mean and constant variance —these residuals should exhibit a random appearance, with no discernible patterns or trends.
To examine whether the assumptions about ERROR were being significantly violated in the empirically based models adopted by the committee, a “residual plot” was generated for each of the 14 PFs and 11 IPFs reported in chapter 4 of Volume I. These plots are presented, respectively, in figures 1–25 below. Each figure shows the estimated model's “studentized” residuals plotted against the corresponding predicted values of the dependent variable; studentized residuals have been normalized in a way that enhances one's ability to detect systematic trends. If the classical assumptions about ERROR hold, a random-looking plot should result.
On the whole, the residual plots in figures 1–25 reveal no discernible systematic trends. Not surprisingly, there are outlier residuals in virtually every plot, but the overall dominant pattern is one of randomness.
Model Assessment Tactic II: Bootstrapping
Note again that each PF and IPF above (and all others reported in Volume I) was estimated from a single cross-sectional sample of observations. Within the period in which the committee and its data and methodology panel were actively developing the EBPSM (corresponding roughly to calendar 1990), these FY 1989 samples were the only available. For fiscal years prior to 1989, physician FTEE data were not broken out by patient care area; data for FY 1990 and beyond were obviously not available at that point. The import of this is that the committee had no direct means to test whether a given PF or IPF would perform adequately outside the particular FY 1989 sample used to estimate it.
This raises a fundamental concern, the dimensions of which are not always fully realized. If these PF and IPFs were reestimated with data from years beyond FY 1989, would basically the same models emerge, assuming application of the regression strategy outlined above? Or would the best-fitting, clinically
plausible models for these subsequent years contain a different set of independent variables, with different combinations of nonlinear and interaction terms?
A new model could emerge, first, if the “true” relationship between the dependent variable and the independent variables has changed over time as a result of any number of factors —that is, if the underlying model itself has evolved.
But a new estimated model also could—indeed, typically will—result each year even if the underlying production process remains unchanged. Each year, a different set of cross-sectional observations will emerge. But different variable values will lead to a somewhat different estimated PF or IPF; even if the best-fitting, clinically plausible model for FY 1990 contains the same variables, the estimated coefficients will typically differ from those in the FY 1989 model. The question, then, is whether they differ enough to lead to significantly different physician requirement calculations.
None of these questions can be resolved directly, however, until future samples are actually brought into play. The committee has strongly recommended that this be done and believes that the analyses presented in chapter 4 of Volume I (and in this section of the Supplementary Papers) clearly indicate how the EBPSM should be extended and reexamined over time, in an iterative fashion.
Nonetheless, there are now available regression analysis strategies for making ingenious use of the original sample to probe two related issues: (1) the stability of the original model, in terms of the variables selected, their coefficients, and other matters, and (2) the degree of overfitting, or “overoptimism, ” embodied in the original model. The second issue refers specifically to the fact that the best-fitting, clinically plausible PF or IPF that emerged from the original sample provides a better “fit” to that particular sample than it would typically to any other, equally plausible sample—for example, the sample of variable values that will appear next year. Hence, various indexes of the goodness of fit for the FY 1989 model, including its coefficient of determination (R2) and the standard errors associated with predicted values of the dependent variable, will be “overly optimistic” vis à vis other samples where the model could be applied for deriving physician requirements and also statements of confidence about those predictions.
One frequently employed tactic under such circumstances is split-sample analysis. Roughly speaking, a randomly selected fraction of the observations (often half) is used to estimate the model, whose predictive ability is tested in various ways using the remaining fraction of the sample. However, the sample
sizes for the PFs and IPF here, ranging from about 80 to 160, were considered too small relative to the number of plausible candidate variables to permit a satisfactory application of these methods; typically, there would be too few observations in the split sample to yield stable coefficient estimates for the PF or IPF.
A second approach to analyzing these issues, and the one adopted here, is termed bootstrap sampling (presumably in reference to the idea that the sample can figuratively elevate itself—or its usefulness —by its own bootstraps). The basic concept is that successive samples of observations, drawn with replacement from the original sample, can be used to estimate successively the statistical parameter or relationship of interest (which might be a single mean value or an entire multivariate regression model). While the analyst is constrained to work within the given sample of size N, that sample can be manipulated to generate many other (indeed, an infinite number of) samples of size N, and each of these can lead to an independent estimate of the parameter(s) of interest. See Efron and Gong (1983) for an excellent discussion of bootstrapping and related methods of internal model validation.
One can use such a sample of bootstrap estimates for two complementary purposes. First, the robustness, or stability, of the original parameter(s) can be studied. Second, the degree of optimism, or overfitting, characterizing the original parameter estimate(s) can be calculated and adjusted goodness-of-fit indexes can be derived.
Bootstrap sampling methods have been applied to the three PFs and three IPFs under scrutiny here, and the results are reported in Tables 1–7.
The first six tables consider, in turn, the six equations, summarizing for each PF or IPF the frequency with which each of its independent variables appears in 100 subsequent models estimated from 100 successive bootstrap samples that were drawn (with replacement) from the original sample.
Table 7 summarizes the estimated degree of overfitting, calculated from two alternative perspectives, for each of the six original models; the focus in all cases is the coefficient of determination, R2, measuring the percentage of variation in the dependent variable “explained” jointly by the independent variables. From these calculations it is easy to derive a corrected R2 that is adjusted (downward) by an amount equal to the computed degree of overoptimism (overfitting).
The results summarized in each of Tables 1–6 were generated as follows:
-
With the independent variables, including all nonlinear and interaction terms contained in the original PF or IPF, serving as the domain for the
-
selection of potential regressors, 100 successive bootstrap samples were drawn from the full cross-sectional sample used to estimate the original model. For example, if the original sample size was 160, then 160 VAMCs would be drawn (with replacement); this might lead, in a given instance, to 107 unique VAMCs appearing in the sample, with 30 of these appearing twice, and 11 appearing three or more times. (By implication, 53 of the VAMCs would not appear at all in this bootstrap sample.)
-
For each sample, backward-elimination stepwise regression was applied to determine the subset of the model's original independent variables that merited entry, at p<0.05. Because each bootstrap sample now differs from the original, a given (best-fit) bootstrap model may or may not include the same independent variables as the original equation. But to the extent a substantial fraction of these bootstrap models do mirror the original, support for the latter is generated. Now, as Efron and Gong (1983) point out (p. 48), “No theory exists for interpreting” the kind of statistical simulation evidence addressed in Tables 1–6. But at the same time they imply that such bootstrapping analysis can serve either to encourage or discourage “confidence in the causal nature of the predictors….”
After presenting the original sample mean and standard deviation for each variable included in the PF or IPF, each of Tables 1–6 shows the percentage of times the variable merited inclusion in 100 bootstrap runs based on the original sample.
Not surprisingly, the overall performance of the variables in each equation was roughly in accord with the equation's goodness of fit, as indexed by ![]() . Of the 31 independent variables in the three PFs, all but 3 (all in the Inpatient Medicine PF) were included in at least 75 percent of the bootstrap models; 23 of the 31 variables appeared in at least 90 percent of the PF bootstrap models.
. Of the 31 independent variables in the three PFs, all but 3 (all in the Inpatient Medicine PF) were included in at least 75 percent of the bootstrap models; 23 of the 31 variables appeared in at least 90 percent of the PF bootstrap models.
The performance of the variables in the Surgery and Psychiatry IPFs was just as impressive (though the former had to be bootstrapped without HGROUP6 because this variable's probability of selection was too small to allow the algorithm to proceed). However, for the Medicare IPF, 10 of the 13 independent variables appeared in fewer than 75 percent of the bootstrap runs, and only one variable (MEDWWU) merited entry in at least 50 percent of these models; recall that ![]() for this IPF was only 0.595.
for this IPF was only 0.595.
The analyses of, and adjustments for, model overfitting summarized in Table 7 were developed as follows. Two alternative bootstrapping strategies were considered. The first strategy, whose implications for overfitting appear in part A of the table, is identical to that used for the results in Tables 1–6; for
each PF and IPF, backward-elimination stepwise regression was applied to 100 consecutive bootstrap samples. In the second strategy, whose results are found in part B of Table 7, the original PF or IPF was simply estimated 100 times using 100 consecutive bootstrap samples (each one based on the respective equation 's original sample, of course); no stepwise variable-selection modeling was performed.
To interpret Table 7, consider any row of results, e.g., for the inpatient medicine production function (MED PF) in part A.
The “Orig. Sample R2” is the coefficient of determination for the original estimated production function, Equation 4.11. (This number, 0.890, exceeds by a bit the adjusted coefficient of determination, ![]() reported in Equation 4.11; the bootstrapping software available to the committee staff does not offer the option of carrying out these analyses in terms of
reported in Equation 4.11; the bootstrapping software available to the committee staff does not offer the option of carrying out these analyses in terms of ![]() .)
.)
Let each bootstrap sample be termed a “training sample.” The number in the second column, 0.891, is the sample mean of the 100 values of R2 emerging from the 100 consecutive bootstrap estimations of the MED PF (using backward elimination on the original regressors in each case).
The critical element in interpreting the third column is the concept of a “test sample.” For each training sample, which (in general) includes M unique VAMCs out of a total sample of N VAMCs, there is a corresponding test sample consisting of observations from the remaining (N–M) VAMCs, with each of these sites represented exactly once. Each test sample was used as follows. First, the independent variable values for each test-sample VAMC were substituted into the right-hand-side of the MED PF equation estimated with the training sample, thus yielding a predicted workload value for that test site. Predicted workload values were obtained likewise for all test-sample sites. Then these predicted values were regressed against the actual workload values observed at the test sites, and the corresponding R2 value was recorded. This process was repeated for 100 consecutive test samples (each associated, of course, with a particular training sample). The resulting “Mean Test Sample R2” for MED PF is 0.871.
For each bootstrap iteration, the difference between the training sample R2 and the test sample R2 is one index of the degree of overfitting, or overoptimism, embodied in the model estimated with the training sample; when that model is applied to the test sample, the overall fit will generally not be as good. Because the test sample is arguably representative of all other possible samples to which this model (estimated from this particular training sample) could be applied, the R2 difference can be viewed as a “point estimate” of the tendency to overfit. In fact, 100 such point estimates were generated here, and the
difference between the mean R2 for the training samples and the mean R2 for the test samples is termed the “Optimism Index” in Table 7. For MED PF it is 0.020. Adjusting the Original Sample R2 (0.890) by this index leads finally to a “Corrected Original R2” of 0.870.
All other rows in parts A and B of Table 7 are similarly interpreted. In most cases the difference between the original and adjusted R2 appears “small” (though the basis for such claims is not well established in the bootstrapping literature). However, for the Medicine IPF—the poorest fitting of the six equations—the downward adjustment in R2 is rather more substantial, from 0.617 to 0.539. This is just what one might expect.
Does the Definition of Patient Workload Matter?
With but two exceptions, the 14 PFs and 11 IPFs reported in chapter 4 of Volume I used workload measures that are based on the “weighted work unit” concept. For the inpatient PCAs there are the inpatient weighted work units (WWUs); for ambulatory care there are the capitated weighted work units (CAPWWUs); and for long-term care (defined to include nursing home and intermediate care), there are the Resource Utilization Group weighted work units (RUGWWUs); see chapter 4 (pp. 59–63) for a detailed discussion of how these measures were constructed in relationship to the EBPSM.
The two models estimated with alternative workload measures were the inpatient psychiatry PF, where bed-days of care (BDOC) replaced the WWU variable, and the ambulatory “other physician services” PF, where total clinic stops for this PCA replaced the corresponding CAPWWU variable. In the former case, the psychiatry panel strongly urged the committee not to measure productivity in this PF with a workload variable based (as the WWUs are) on a diagnosis related group (DRG) classification of patient care; the panel questioned whether DRGs offered the appropriate framework for measuring psychiatry workload. Regarding the second case, the use of clinic stops rather than CAPWWUs led to a significantly better fitting PF.
All this raises the question of whether the committee's “final” PFs and IPFs are indeed robust to alternative specifications of their workload variables. Or would quite different results emerge if different workload definitions were used?
In fact, the committee's data and methodology panel and the study staff investigated this as each model was being developed. The basic results are that the alternative (available) workload measures for a given PCA are so highly
correlated (r>0.95, typically) that the measures can be substituted for one another with little impact on the final results.
In general, the WWU-based measures led to slightly better-performing models, in terms of ![]() and the pattern of clinically plausible, statistically significant regressors. Moreover (and perhaps relatedly), the WWU-based measures are constructed to be more sensitive to case mix and service intensity differences than are, say, BDOC and clinic stops. Hence, the committee generally preferred them on conceptual grounds.
and the pattern of clinically plausible, statistically significant regressors. Moreover (and perhaps relatedly), the WWU-based measures are constructed to be more sensitive to case mix and service intensity differences than are, say, BDOC and clinic stops. Hence, the committee generally preferred them on conceptual grounds.
To illustrate the type of sensitivity analysis pursued during the study, the committee turns again to the three PFs and three IPFs being scrutinized here.
-
MED PF—With the dependent variable specified as ln(BDOC+1) rather than ln(WWUs+1), one finds that:
 falls from 0.882 to 0.878; both RESIDENTS and FELLOWS (direct-effect terms) are still positive, but no longer significant; the MED_MD-FELLOWS interaction term is negative, but not significant; and NEU_MD exhibits a stronger positive effect on workload, but remains statistically borderline.
 -
SUR PF—With BDOC replacing WWUs,
drops from 0.943 to 0.911, and the variables NURSEMD, HGROUP2, and HGROUP6 are no longer significant. -
PSY PF—With the variable for all WWUs generated on the inpatient psychiatry PCA substituted for BDOC,
rises just barely (from 0.872 to 0.874) and there is no appreciable difference in the performance of any regressor. -
MED IPF—In this case, the workload substitution was three-fold: inpatient medicine BDOC replaced aggregate medicine WWUs; the sum of clinic stops for the ambulatory medicine and ambulatory “other physician services” PCAs replaced the sum of CAPWWUs for these two PCAs; and total BDOC for the nursing home and intermediate care PCAs replaced total RUGWWUs. With these changes,
in fact increased (from 0.583 to 0.603), but a number of variables were no longer significant: HGROUP2, HGROUP3, HGROUP4, HGROUP6, and the interaction of each of these with inpatient workload. -
SUR IPF—With inpatient surgery BDOC replacing aggregate surgery WWUs and total surgery clinic stops substituting for surgery CAPWWU,
remained at 0.817 and there was no appreciable change in the performance of the other independent variable. -
PSY IPF—When inpatient psychiatry BDOC is substituted for aggregate psychiatry WWUs and total psychiatry clinic stops replaces psychiatry CAPWWU,
falls from 0.887 to 0.868 but there are no appreciable changes in the behavior of the other independent variables. The committee elected, in
-
fact, to adopt the WWU-based specification here in light of its superior statistical performance.
MARGINAL PRODUCT ANALYSIS
This part of the Supplementary Papers concludes with a brief examination of how each estimated PF can be further analyzed to yield insights about the productivity of physicians, by specialty, vis à vis other inputs in the applicable patient care area.
In particular, what is the achievable increase in output (patient workload) if one more physician FTEE, in a given specialty, is added to the PCA while all other inputs are held at current levels? That is, what is the “marginal product” of the physician? While this line of inquiry can be fruitfully pursued for each input appealing in a given production function, the illustrative calculations below focus simply on the “dominant” physician specialty in each PF—that is, on the marginal product (MP) of the internist in Equation 4.11, the MP of the surgeon in Equation 4.12, and the MP of the psychiatrist in Equation 4.13.
Examine first the internist in the inpatient medicine PF. Now, to compute the marginal product of any input, one first takes the partial derivative of the workload variable (W) with respect to that input. With respect to Equation 4.11,
it can be shown (via some differential calculus) that (ΔW/ΔMED–MD)=0.213
–0.014 MED_MD–0.003 FELLOWS–0.048(SUPPORT/MD2), where SUPPORT and MD are now treated as arithmetically distinct entities, each bearing the same definition implied by Equation 4.11. (Note, in particular, that the variable in the final term is not (SUPPORT/MD)2; rather, only the denominator is squared in this partial derivative expression.)
Thus, the impact of adding one more internist (i.e., incrementing MED_MD by one unit) is clearly a function of the existing FTEE levels for internists, fellows, support staff, and total “hands-on” physicians (MD) in the PCA. It is in this case also a function of the current value of the output expressions, W, as will be seen shortly.
Following Jensen and Morrisey (1986a,b), consider now the marginal product of the internist in the VA systemwide “average” or “most typical” inpatient medicine PCA. This is obtained by setting each of the relevant variables to its sample-mean value. For FY 1989, these means are as follows: MED_MD=5.34, MD=6.52, SUPPORT=92.96, and FELLOWS=5.41. Substituting these into the internist marginal product formula
yields (ΔW/ΔMED–MD)=0.017. That is, a unit increase in MED_MD is expected to lead to a 0.017 increase in W.
But note that W, defined as the natural logarithm of total WWUs, plus 1, produced in the inpatient medicine PCA, is in fact a nonlinear function of workload. This implies that the impact on WWUs of adding one more internist will depend on the current absolute level of WWUs (even though the impact on W is the constant 0.017). If, at baseline, production in the inpatient medicine PCA was 2,484 WWUs/year—the FY 1989 national average—the corresponding W value is ln(2,484+1)=7.818. A full unit increment in MED_MD implies a new W equal to (7.818+0.017)=7.835. To find the resulting expected WWU level, one exponentiates this new W and subtracts 1, to get 2,526 WWUs. Hence, the “national average ” marginal product of the internist is about (2,526–2,484)=42 WWUs/year—positive but evidently quite small.
To gain additional insights on this, consider now the surgeon in Equation 4.12 and the psychiatrist in Equation 4.13.
In the former case one finds that (ΔW/ΔSUR–MD)=0.27913–0.032 SUR_MD–0.026 (NURSE/MD2)–0.033 (SUPPORT/MD2). The national average values for the relevant variables for FY 1989 are as follows: W= 7.666, SUR_MD=3.94, NURSE=56.29, SUPPORT=72.98, and MD= 6.59. It can be shown that (ΔW/ΔSUR–MD)=0.064; the national average workload in the inpatient surgery PCAs is about 2,134 WWUs; and that, given these data, the marginal product of the surgeon in this PCA is about 141 WWUs/year.
For the psychiatrist in the inpatient psychiatry PCA, one finds from Equation 4.13 that (ΔW/ΔPSY–MD)=0.198–0.014 RESIDENTS+ 0.329 HGROUP2–0.132 HGROUP5–0.201 HGROUP6. Recalling that workload is measured here in terms of bed-days of care, the national average values for the relevant variables for FY 1989 are as follows: W=9.990, RESIDENTS=10.72, HGROUP2=0.142, HGROUP5=0.184, and HGROUP6=0.156. It follows that (ΔW/ΔPSY–MD)=0.161; the national average workload level for this PCA is 21,806 BDOC; and that, given these data, the marginal product of the psychiatrist in this PCA is about 3,810 BDOC.
So that the MP of the psychiatrist could be viewed roughly in comparison to that calculated for the internist and the surgeon (both calculated in terms of WWUs), Equation 4.13 was reestimated with W defined now as the logarithm
of all WWUs, plus 1, produced in the inpatient psychiatry PCA. As noted in the previous section, this PF performs almost identically to that shown in Equation 4.13. The alternative PF implies that the marginal product of the psychiatrist in this PCA, at the FY 1989 means, is about 187 WWUs/year. This compares with 141 WWUs/year for the surgeon (based on Equation 4.12) and 42 WWUs/year for the internist (based on Equation 4.11).
As expected, all three marginal products are positive (a negative MP would imply that the input is being used inefficiently in the production of patient workload). One can also infer that, in FY 1989, the addition of one psychiatrist or surgeon FTEE to the inpatient psychiatry or surgery PCA, respectfully, could have lead, on average, to a markedly larger increase in workload than a corresponding unit increase in the internist in the statistically typical inpatient medicine PCA.
REFERENCES
Efron, B., and Gong, G. 1983. A leisurely look at the bootstrap, the jackknife, and cross-validation . American Statistician 37(1):36–48.
Forsund, F.R., Lovell, C.A.K., and Schmidt, P. 1980. A survey of frontier production functions and of their relationship to efficiency measurement. Journal of Econometrics 13(May):5–25.
Jensen, G.A., and Morrisey, M.A. 1986a. Medical staff specialty mix and hospital production. Journal of Health Economics 5:253–276.
Jensen, G.A., and Morrisey, M.A. 1986b. The role of physicians in hospitalproduction. Review of Economics and Statistics 68:432–442.
Sexton, T.R., Leiken, A.M., Nolan, A.H., Liss, S., Hogan, A., and Silkman, R. 1989. Evaluating managerial efficiency of Veterans Administration medical centers using data envelopment analysis. Medical Care 27(12):1175–1188.
TABLE 1 Replicability of the “Final” Inpatient Medicine PF: Backward-Elimination Regression Analysis of 100 Bootstrap Samples with Regressor Domain Consisting of Final Model Variables
|
Variable |
Original-Sample Mean |
Original-Sample Standard Deviation |
% Times Stat. Significant (p<0.05) in 100 Bootstrap-Sample Models |
|
MED_MD |
5.34 |
3.24 |
100 |
|
(MED_MD)2 |
38.95 |
47.73 |
99 |
|
SUR_MD |
0.33 |
0.35 |
89 |
|
PSY_MD |
0.23 |
0.27 |
70 |
|
NEU_MD |
0.17 |
0.30 |
50 |
|
RESIDENTS |
7.78 |
7.93 |
98 |
|
FELLOWS |
5.41 |
6.18 |
64 |
|
SUPPORT/MD |
15.39 |
6.72 |
100 |
|
SOCW |
2.28 |
1.42 |
75 |
|
HGROUP6 |
0.14 |
0.35 |
100 |
|
(MED_MD* FELLOWS) |
38.49 |
61.90 |
88 |
TABLE 2 Replicability of the “Final” Inpatient Surgery PF: Backward-Elimination Regression Analysis of 100 Bootstrap Samples with Regressor Domain Consisting of Final Model Variables
TABLE 3 Replicability of the “Final” Inpatient Psychiatry PF: Backward-Elimination Regression Analysis of 100 Bootstrap Samples with Regressor Domain Consisting of Final Model Variables
|
Variable |
Original-Sample Mean |
Original-Sample Standard Deviation |
% Times Stat. Significant (p<0.05) in 100 Bootstrap-Sample Models |
|
PSY_MD |
3.86 |
3.45 |
100 |
|
RESIDENTS |
2.09 |
2.45 |
100 |
|
(PSY_MD*RESIDENTS) |
10.72 |
21.19 |
99 |
|
SOCW |
4.34 |
3.77 |
100 |
|
HGROUP2 |
0.14 |
0.35 |
76 |
|
HGROUP4 |
0.10 |
0.30 |
83 |
|
HGROUP5 |
0.18 |
0.39 |
99 |
|
HGROUP6 |
0.16 |
0.36 |
100 |
|
(PSY_MD*HGROUP2) |
0.11 |
0.39 |
77 |
|
(PSY_MD*HGROUP5) |
1.27 |
3.08 |
97 |
|
(PSY_MD*HGROUP6) |
1.15 |
2.95 |
99 |
TABLE 4 Replicability of the “Final” Medicine IPF: Backward-Elimination Regression Analysis of 100 Bootstrap Samples with Regressor Domain Consisting of Final Model Variables
|
Variable |
Original-Sample Mean |
Original-Sample Standard Deviation |
% Times Stat. Significant (p<0.05) in 100 Bootstrap-Sample Models |
|
MEDWWU |
0.28 |
0.17 |
100 |
|
MEDCAPWWU |
373.26 |
236.58 |
82 |
|
MEDRUGWWU |
5.39 |
4.99 |
68 |
|
FELLOWS |
7.25 |
8.49 |
69 |
|
HGROUP2 |
0.21 |
0.41 |
58 |
|
HGROUP3 |
0.29 |
0.46 |
67 |
|
HGROUP4 |
0.11 |
0.31 |
76 |
|
HGROUP5 |
0.16 |
0.37 |
62 |
|
HGROUP6 |
0.13 |
0.34 |
63 |
|
(MEDWWU*HGROUP2) |
0.03 |
0.07 |
47 |
|
(MEDWWU*HGROUP3) |
0.10 |
0.16 |
70 |
|
(MEDWWU*HGROUP4) |
0.02 |
0.08 |
49 |
|
(MEDWWU*HGROUP5) |
0.09 |
0.21 |
73 |
TABLE 5 Replicability of the “Final” Surgery IPF: Backward-Elimination Regression Analysis of 100 Bootstrap Samples with Regressor Domain Consisting of Final Model Variables
TABLE 6 Replicability of the “Final” Psychiatry IPF: Backward-Elimination Regression Analysis of 100 Bootstrap Samples with Regressor Domain Consisting of Final Model Variables
|
Variable |
Original-Sample Mean |
Original-Sample Standard Deviation |
% Times Stat. Significant (p<0.05) in 100 Bootstrap-Sample Models |
|
PSYWWU |
0.15 |
0.14 |
100 |
|
(PSYWWU)2 |
0.04 |
0.08 |
81 |
|
PSYCAPWWU |
143.74 |
111.37 |
100 |
|
HGROUP2 |
0.21 |
0.41 |
100 |
|
INSOCW |
7.46 |
5.33 |
99 |
|
(PSYWWU*PSYCAPWWU) |
30.67 |
48.01 |
100 |
TABLE 7 Bootstrap Analysis of the Degree of Overfitting in 3 PFs and 3 IPFs
|
A. Analysis of Coefficient of Determination (R2) Based on Backward Elimination Regressions Using 100 Bootstrap Samples with Regressor Domain Consisting of Final Model Variables. |
|||||
|
Original Sample R2 |
Mean Training Sample R2 |
Mean Test Sample R2 |
Optimism Index |
Corrected R2 |
|
|
MED PF |
0.890 |
0.891 |
0.871 |
0.020 |
0.870 |
|
SUR PF |
0.940 |
0.944 |
0.931 |
0.013 |
0.927 |
|
PSY PF |
0.882 |
0.887 |
0.865 |
0.022 |
0.860 |
|
MED IPF |
0.617 |
0.637 |
0.559 |
0.078 |
0.539 |
|
SUR IPF |
0.773 |
0.777 |
0.767 |
0.010 |
0.763 |
|
PSY IPF |
0.892 |
0.898 |
0.882 |
0.016 |
0.876 |
|
B. Analysis of R2 Based on Repeated Estimation of Final Model with 100 Bootstrap Samples of Final Model Variables. |
|||||
|
Original Sample R2 |
Mean Training Sample R2 |
Mean Test Sample R2 |
Optimism Index |
Corrected R2 |
|
|
MED PF |
0.886 |
0.893 |
0.875 |
0.018 |
0.868 |
|
SUR PF |
0.940 |
0.945 |
0.933 |
0.012 |
0.928 |
|
PSY PF |
0.882 |
0.889 |
0.870 |
0.019 |
0.863 |
|
MED IPF |
0.617 |
0.647 |
0.582 |
0.065 |
0.552 |
|
SUR IPF |
0.773 |
0.779 |
0.768 |
0.011 |
0.762 |
|
PSY IPF |
0.892 |
0.897 |
0.882 |
0.015 |
0.877 |