human carcinogen), Group 2B (possible human carcinogens), and Group 3 (unclassifiable with respect to human carcinogenicity).
Rosenkranz & Ennever (1990) also showed that genotoxic carcinogens that demonstrated mutagenic effects in the Salmonella assay were, on average, more potent than nongenotoxic carcinogens that tested negative in Salmonella. Human carcinogens also appear to be predominantly genotoxic (Shelby et al., 1988; Bartsch & Malaveille, 1989).
Based on an examination of the potency of carcinogens evaluated by the International Agency for Research on Cancer, McGregor (1992) concluded that there did not appear to be a strong association between carcinogenic potency in rodents and genotoxicity. It was noted that the most potent rodent carcinogen (TCDD) is apparently nongenotoxic, whereas one of the least potent rodent carcinogens (phenacetin) is mutagenic in the Salmonella assay.
3. Correlation Between TD50and the MTD
3.1 Empirical Correlations
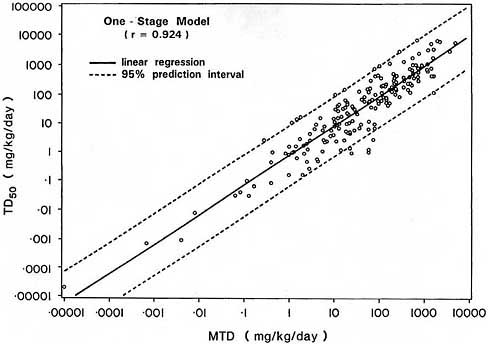
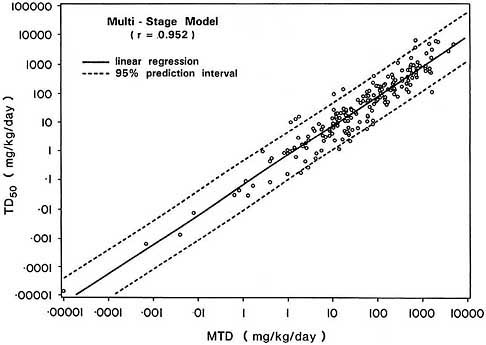
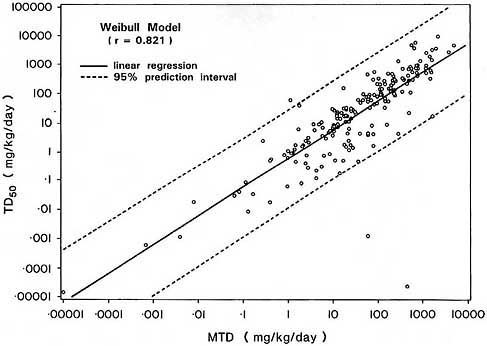
Several investigators have noted a marked correlation between carcinogenic potency and the MDT (Bernstein et al., 1985; Gaylor, 1989; Krewski et al., 1989; Reith & Starr, 1989a). To demonstrate this relationship, we reanalyzed data in the CPDB on the 191 chemical carcinogens discussed in section 2.3. Following Gold et al. (1984), we first used the one-stage model to estimate the TD50 for each carcinogen based on the crude proportion of animals developing tumors at each dose (Figure 2a). To allow for curvilinear dose-response, the TD50 was also estimated using both the multistage and Weibull models (Figures 2b and 2c respectively). These estimates of carcinogenic potency values are all adjusted to a standard two year rodent lifetime as described in annex C. In each case, there is a strong positive association between the TD50 and the MDT, indicating that the most potent carcinogens in the database are those with the smallest MDTs.
The Pearson correlation coefficients between log10(TD50) and log10 (MDT) are 0.924, 0.952 or 0.821, depending on whether the one-stage, multistage or Weibull model is used to estimate the TD50. Note that the multistage model, which provides for curvature, yields a higher