National Academies Press: OpenBook

Issues in Risk Assessment (1993)

Chapter: 3.3 Analytical Correlations

« Previous: 3.2 Range of Possible TD50 Values
Suggested Citation:"3.3 Analytical Correlations." National Research Council. 1993. Issues in Risk Assessment. Washington, DC: The National Academies Press. doi: 10.17226/2078.
×

of ß. We will consider tumor counts in the range 10 = x = 49, the lower limit being the smallest value of x which is significantly greater (p < 0.05) than the assumed background incidences of 10%, and the upper limit being the largest value of x which leads to a meaningful estimate of ß. (Since 100% tumor incidence is rarely observed, this truncated upper limit has little practical significance.) Under these conditions, we have 0.118/D = ß = 3.807/D, so that ß could vary by about 32-fold. It follows from (2.3) that the corresponding estimate of carcinogenic potency varies by the same amount. Bernstein et al. (1985) assert that this result also tends to hold for more general experimental designs involving two or three exposed groups in addition to an unexposed control. It follows that since cancer potency values are constrained to lie within a narrow range determined by the MTD, the wide variation in MTDs for chemical carcinogens necessarily induces a high correlation between cancer potency and the MTD.

3.3 Analytical Correlations

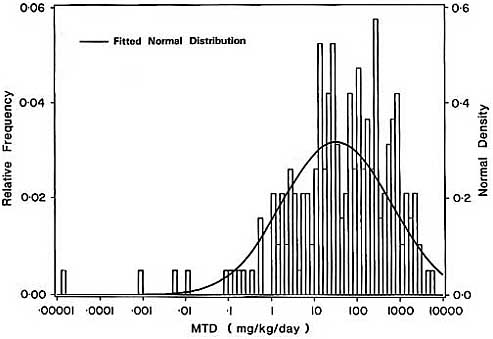
The correlation between the MTD and the TD50 may be also be established using analytical arguments, details of which are provided in annex D. Suppose first that the MTD for a population of carcinogens follows a log-normal distribution as suggested by Bernstein et al. (1985). This assumption is supported by the approximate normality of the log10TD50 values for the 191 chemicals discussed in section 3.1 (see Figure 3). (The normality assumption is actually not essential here since the correlation depends only on the variance of this distribution.) Suppose further that the TD50 is uniformly distributed about the MTD within the limits calculated the methods of by Bernstein et al. (1985). To the extent that these limits are greater than would be observed in practice, this assumption would tend to reduce the value of the correlation coefficient to be calculated by this argument. Under these assumptions, the correlation between log10(TD50) and log10(MTD) is 0.965 for a sample of size n = 50 animals in the exposed group.

Suggested Citation:"3.3 Analytical Correlations." National Research Council. 1993. Issues in Risk Assessment. Washington, DC: The National Academies Press. doi: 10.17226/2078.
×

FIGURE 3 Distribution of MTDs for 191 chemical carcinogens selected from the CPDB.

Suggested Citation:"3.3 Analytical Correlations." National Research Council. 1993. Issues in Risk Assessment. Washington, DC: The National Academies Press. doi: 10.17226/2078.
×
Page 126
Suggested Citation:"3.3 Analytical Correlations." National Research Council. 1993. Issues in Risk Assessment. Washington, DC: The National Academies Press. doi: 10.17226/2078.
×
Page 127
Next: 3.4 Model Dependency »
Issues in Risk Assessment Get This Book
×
 Issues in Risk Assessment
Buy Paperback | $65.00
MyNAP members save 10% online.
Login or Register to save!
Download Free PDF

The scientific basis, inference assumptions, regulatory uses, and research needs in risk assessment are considered in this two-part volume.

The first part, Use of Maximum Tolerated Dose in Animal Bioassays for Carcinogenicity, focuses on whether the maximum tolerated dose should continue to be used in carcinogenesis bioassays. The committee considers several options for modifying current bioassay procedures.

The second part, Two-Stage Models of Carcinogenesis, stems from efforts to identify improved means of cancer risk assessment that have resulted in the development of a mathematical dose-response model based on a paradigm for the biologic phenomena thought to be associated with carcinogenesis.

READ FREE ONLINE

  1. ×

    Welcome to OpenBook!

    You're looking at OpenBook, NAP.edu's online reading room since 1999. Based on feedback from you, our users, we've made some improvements that make it easier than ever to read thousands of publications on our website.

    Do you want to take a quick tour of the OpenBook's features?

    No Thanks Take a Tour »
  2. ×

    Show this book's table of contents, where you can jump to any chapter by name.

    « Back Next »
  3. ×

    ...or use these buttons to go back to the previous chapter or skip to the next one.

    « Back Next »
  4. ×

    Jump up to the previous page or down to the next one. Also, you can type in a page number and press Enter to go directly to that page in the book.

    « Back Next »
  5. ×

    Switch between the Original Pages, where you can read the report as it appeared in print, and Text Pages for the web version, where you can highlight and search the text.

    « Back Next »
  6. ×

    To search the entire text of this book, type in your search term here and press Enter.

    « Back Next »
  7. ×

    Share a link to this book page on your preferred social network or via email.

    « Back Next »
  8. ×

    View our suggested citation for this chapter.

    « Back Next »
  9. ×

    Ready to take your reading offline? Click here to buy this book in print or download it as a free PDF, if available.

    « Back Next »
Stay Connected!