
2
Visibility Conditions in the United States
This chapter briefly characterizes overall visibility conditions in the United States and the emission sources that affect visibility. By comparing current spatial, temporal, and statistical visibility patterns with patterns in airborne particle concentrations, the committee presents information about the causes of visibility degradation. Studies that have related historical visibility trends to historical emission trends are summarized, and major emission source types (natural and anthropogenic), that affect visibility are discussed.
Visibility impairment episodes can range in scale from local plumes to widespread regional haze. The sources of locally visible plumes are easy to identify, for example, the smoke from a power plant stack or from a burning field. However, when plumes are carried by winds, they become more diffuse, and the sources are identified less readily. In regions with many sources, the plumes can merge and become mixed with the emissions from many small sources, such as motor vehicles. The result is a widespread haze in which individual contributions from the various sources are virtually indistinguishable. This latter condition—regional haze—is the main focus of this chapter.
The most intense regional haze in the United States occurs in the East, where haze often is linked to high concentrations of ambient sulfate (SO42-). SO42- concentrations are highest in the summertime during meteorological conditions that are usually associated with the western half of slow-moving high-pressure systems. Under such stagnant conditions, pollutants from many different sources can accumulate, causing severe and widespread visibility degradation.
It is important to recognize, however, that regional hazes are not necessarily caused by local emissions, nor do they depend on stagnant meteorological conditions. In the absence of precipitation, airborne particles (and their gaseous precursors) can exist in the atmosphere for many days and can be carried great distances by winds. Studies have shown that regional hazes are often associated with transport from distant sources. Haze episodes at eastern sites are well correlated with previous occurrences (more than 36 hours earlier) of low wind speeds (periods of stagnation) in upwind source regions (Samson, 1978). High SO42- concentrations at rural areas of upstate New York (including the Adirondack Mountains) most often are associated with winds coming from the south and southwest (Galvin et al., 1978). High SO42- concentrations at Shenandoah National Park, Virginia, usually are associated with moderate wind flows from the west to northwest (Wolff et al., 1982).
CURRENT VISIBILITY CONDITIONS
Geographical Patterns
Figure 2-1 shows isopleths of median visual range at rural U.S. sites (Trijonis et al., 1990). The spatial patterns in this map are based on airport observations of visual range which differ from measurements of standard visual range.1 Airport visual range measurements are based on the identification by human observers of targets at known distances from the observation point, whereas standard visual range is calculated from light extinction measurements. However, airport observations have been calibrated against the results of instrumental studies for standard visual range, and the airport data presented in these figures have been adjusted accordingly.
Figure 2-1 shows that the mountainous Southwest has the best visibility in the country. Median standard visual range exceeds 150 km in the region comprising Utah, Colorado, Nevada, northern Arizona, north
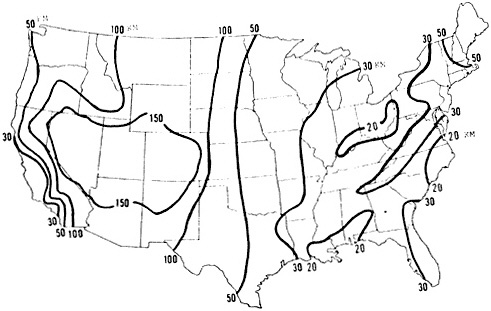
FIGURE 2-1 Estimated median standard visual range (km) for rural (suburban and nonurban) areas of the United States. Values are based on airport median visual ranges multiplied by 1.3 to account for differences in detection thresholds in estimating standard visual range. Data included for all days (all weather conditions). Data are for 1974–1976, but recent studies indicate that current conditions are approximately the same as shown here. Median values are reported instead of averages because a significant portion of the data are less than the lowest extinction threshold (above the farthest visibility marker). Averages, presented in other figures, are highly correlated with median values. Source: Trijonis et al., 1990.
western New Mexico, and southwestern Wyoming. In the adjoining regions to the north and south, median standard visual range is also quite good, exceeding 100 km. However, visual range decreases sharply to the east and west of this area. Median visual range falls to less than 50 km in a narrow band along the northern Pacific coast, less than 30 km in the central valley of California, and to less than 15 km in the Los Angeles basin (Trijonis, 1982a). Although some parts of the East (e.g., New England) have moderately good visibility levels (about 40–60 km), median visual range is generally less than 30 km in the large area east of the Mississippi and south of the Great Lakes.
Observations show a distinct relationship between visual range and altitude. On average, visual range is somewhat greater at higher altitudes than in the surrounding areas (Trijonis, 1982a; Air Resources Specialists, 1988). Many national parks are located at higher elevations than the sites from which the data were obtained for Figure 2-1, and the visual range in some national parks could be as much as 50% higher than indicated in the figure (Trijonis et al., 1990).
The National Park Service (NPS) routinely measures particle concentrations and composition in many national parks and wilderness areas. Most of those parks and wilderness areas are located in the West; consequently, few data are collected for the eastern portion of the country. The geographical patterns in the annual average data are summarized in Figures 2-2 through 2-7, which show fine-particle (less than 2.5 µm diameter) mass concentration (Figure 2-2), fine particulate sulfur (Figure 2-3), fine soil-derived materials (Figure 2-4), and absorption coefficient (Figure 2-5). (The absorption coefficient is directly related to the concentration of elemental carbon.) Figure 2-6 shows the distribution of the remaining fine-particle mass (the total fine-particle mass minus the concentrations of fine sulfate, elemental carbon, and soil particles). Figure 2-7 presents data for estimated nonsulfate hydrogen (the total hydrogen concentration less the hydrogen that is associated with sulfates). The remaining mass and the nonsulfate hydrogen are believed to be qualitatively related to the spatial distribution of organic aerosols.
These figures, as well as rural data sets reported in the National Acid Precipitation Assessment Program (NAPAP) Visibility State of Science and Technology Report (Trijonis et al., 1990), indicate the following differences between the air quality of the rural West (particularly the arid, mountainous Southwest) and that of the rural East (particularly the area south of the Great Lakes and east of the Mississippi):
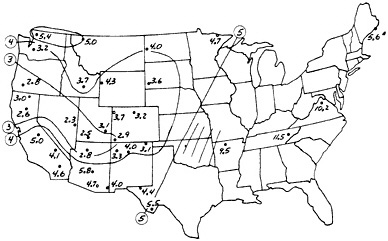
FIGURE 2-2 Average concentrations of fine-particle mass ( µg/m3) from the National Park Service network, 1983–1986. Source: Eldred et al., 1987 (From Trijonis et al., 1990).
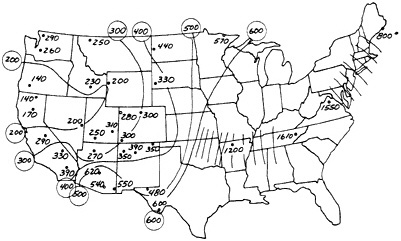
FIGURE 2-3 Average concentrations of fine-particle sulfur (ng/m3 ) from the National Park Service network, 1983–1986. Source: Eldred et al., 1987 (From Trijonis et al., 1990).
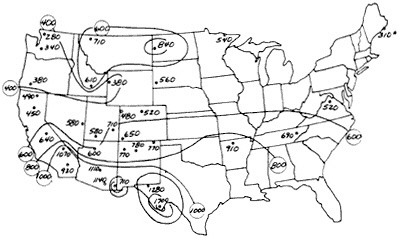
FIGURE 2-4 Average concentrations of fine-particle soil materials (ng/m 3) from the National Park Service network, 1983–1986. Source: Eldred et al., 1987 (From Trijonis et al., 1990).
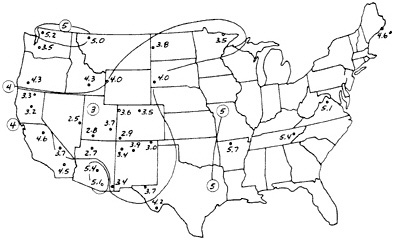
FIGURE 2-5 Average fine-particle absorption coefficient (Mm-1) from the National Park Service network, 1983–1986. Fine elemental carbon concentrations in µg/m3 can be estimated by dividing the fine-particle absorption coefficient (in Mm-1) by 10. Source: Eldred et al., 1987 (From Trijonis et al., 1990).
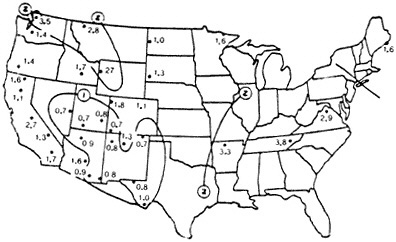
FIGURE 2-6 Average concentrations of remaining fine-particle mass (µg/m3) from the National Park Service network, 1983–1986. The fine particle remaining mass is defined as the total fine-particle mass minus the concentration of fine sulfate, elemental carbon, and soil particles. Organic carbon is a major component of the remaining fine-particle mass. Source: Eldred et al., 1987 (From Trijonis et al., 1990).
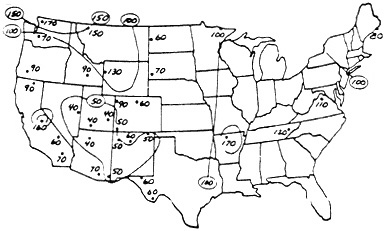
FIGURE 2-7 Average concentrations of fine-particle nonsulfate hydrogen mass (ng/m3) from the National Park Service network, 1983–1986. The nonsulfate hydrogen is calculated from the total hydrogen concentration by subtracting the hydrogen that is associated with sulfates. Source: Eldred et al., 1987 (From Trijonis et al., 1990).
-
SO42- concentrations are about six times greater in the rural East than in the rural West.
-
Fine soil concentrations are about the same in the rural East and West.
-
Elemental carbon and organic particle concentrations (as reflected by the remaining fine particle mass and the fine-particle nonsulfate hydrogen) are about two times greater in the rural East. (This finding agrees with the data for 19 rural sites reported by Shah et al., 1986.)
-
Fine nitrate (NO3-) concentrations are about the same in both regions, about 0.5 to 1.0 µg/m3. (See denuder nitrate data in Trijonis et al., 1990.)
Seasonal Patterns
Two data sets show the seasonal visibility patterns for North America. The first data set is quarterly median light extinction data obtained at NPS automated camera sites for 1986–1988 (see Table 2-1 and Appendix B). The second involves analyses of data at U.S. and Canadian airports as shown in Figures 2-8a and 2-8b.
Both data sets reveal an extremely strong seasonal feature that occurs on a large geographical scale—visibility is lowest in the summer in the region south of the Great Lakes and east of the Mississippi. The seasonality in light extinction measured at the two NPS sites in this region (Great Smokies and Shenandoah) is clearly evident in Figure 2-9; here, light extinction is more than twice as great in the summer as during the other seasons.
The visibility minimum observed during the summer in the East is, in large part, due to maximal SO42- concentrations during the summer. Aerosol data show that SO42- concentrations in the East are nearly twice as high in the summer as during the rest of the year (Trijonis et al., 1990). Figure 2-10 shows seasonal patterns in the East for extinction, fine-particle mass, and SO42- (Trijonis, 1982a); light extinction correlates with total fine-particle mass and fine sulfate, and SO42- constitutes about half of the total fine-particle mass.
Neither of the two available data sets are adequate for a definitive analysis of the more subtle seasonal visibility patterns in New England and the western two-thirds of the United States. The NPS data are biased due to treatment of data on days when targets were snow-cov-
TABLE 2-1 Quarterly Median Visual Ranges for National Park Service Automated Camera Sites, 1986–1988
|
|
Seasonal Median Visual Range (km) |
|||
|
Site |
Dec.–Feb. |
March–May |
June–Aug. |
Sept.–Nov. |
|
Acadia Park, ME |
85 |
64 |
69 |
64 |
|
Arches Park, UT |
140 |
158 |
189 |
166 |
|
Bandelier Monument, NM |
171 |
154 |
156 |
178 |
|
Big Bend Park, TX |
168 |
128 |
145 |
185 |
|
Black Canyon Monument, CO |
134 |
146 |
159 |
140 |
|
Bryce Canyon Park, UT |
243 |
182 |
184 |
189 |
|
Bridget Wilderness, WY |
52 |
60 |
165 |
84 |
|
Buffalo RiVer, AR |
61 |
43 |
46 |
64 |
|
Capitol Reef Park, UT |
102 |
144 |
172 |
158 |
|
Capulin Volcano, NM |
156 |
125 |
136 |
110 |
|
Carlsbad Caverns Park, NM |
156 |
177 |
110 |
137 |
|
Chaco Culture NHP, NM |
155 |
168 |
166 |
162 |
|
Chiricahua Monument, AZ |
170 |
162 |
134 |
166 |
|
Colorado Monument, CO |
119 |
151 |
171 |
156 |
|
Craig (BLM), CO |
75 |
123 |
148 |
107 |
|
Crater Lake Park, OR |
105 |
83 |
148 |
66 |
|
Craters of the Moon, ID |
66 |
129 |
140 |
128 |
|
Death Valley Monument, CA |
203 |
133 |
92 |
117 |
|
Dinosaur Monument, CO |
131 |
133 |
162 |
178 |
|
Glacier Park, MT |
35 |
58 |
152 |
82 |
|
Glen Canyon Area, AZ |
151 |
152 |
149 |
146 |
|
Grand Teton Park, WY |
18 |
119 |
127 |
94 |
|
Great Basin Park, NV |
225 |
174 |
195 |
138 |
|
Great Sand Dunes, CO |
158 |
123 |
114 |
140 |
|
Great Smoky Mountains, TN |
49 |
54 |
20 |
50 |
|
Green River Area, WY |
131 |
67 |
176 |
164 |
|
Guadalupe Mountains, TX |
150 |
120 |
106 |
125 |
|
Isle Royale Park, MI |
24 |
49 |
66 |
58 |
|
Jarbidge Wilderness, NV |
64 |
24 |
136 |
92 |
|
Joshua Tree Monument, CA |
244 |
140 |
115 |
139 |
|
Lake Mead Area, NV |
234 |
143 |
156 |
149 |
|
Lassen Volcanic Park, CA |
107 |
94 |
156 |
164 |
|
Lava Beds Monument, CA |
154 |
146 |
158 |
112 |
|
|
Seasonal Median Visual Range (km) |
|||
|
Site |
Dec.–Feb. |
March–May |
June–Aug. |
Sept.–Nov. |
|
Mesa Verde Park, CO |
166 |
152 |
156 |
164 |
|
Mount Rainier Park, WA |
81 |
82 |
102 |
98 |
|
Olympic Park, WA |
10 |
59 |
94 |
66 |
|
Pinnacles Monument, CA |
162 |
114 |
132 |
114 |
|
Point Reyes, CA |
65 |
50 |
36 |
28 |
|
Redwood Park, CA |
91 |
69 |
42 |
50 |
|
Rocky Mountain Park, CO |
136 |
110 |
144 |
132 |
|
San Gorgonio Wilderness, CA |
266 |
101 |
127 |
140 |
|
Shenandoah Park, VA |
70 |
68 |
24 |
54 |
|
Superstition Mountains, AZ |
234 |
185 |
153 |
166 |
|
Theodore Roosevelt Park, ND |
198 |
93 |
133 |
120 |
|
Voyageurs Park, MN |
75 |
99 |
172 |
106 |
|
Weminuche Wilderness, CO |
98 |
112 |
150 |
137 |
|
Wind Cave Park, SD |
209 |
119 |
152 |
147 |
|
Yellowstone Park, WY |
55 |
24 |
96 |
63 |
|
Yosemite Park, CA |
56 |
75 |
69 |
68 |
|
Zion Park, UT |
184 |
156 |
172 |
164 |
|
All data are included except for observations of snow-covered targets. (Winter and spring estimates are problematic at many western sites due to treatment of data obtained during conditions with snow-covered targets.) Seasonal values represent averages of all quarterly medians available. Quarterly medians are based on regressions fit to cumulative frequency plots. Source: Trijonis et al., 1990. |
||||
ered. In the West, the airport results reported by Husar are problematic because of the lack of sufficiently distant targets at some sites and also because of the limited statistical resolution in the reported results; interpretation also is difficult because the results are based on data from a mixture of urban and rural locations (Trijonis et al., 1990). Definitive results must await a revised analysis of the NPS camera data and airport visibility data or, better yet, an analysis of the transmissometer data from the new NPS monitoring system (see Chapter 4).
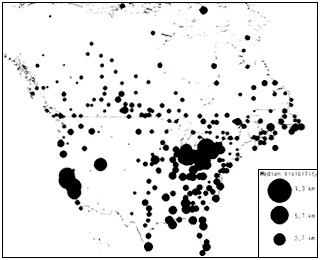
FIGURE 2-8a Median airport visual range for January, averaged over 1979–1983. Larger circles correspond to lower visual range (greater light extinction). Diameter of circles is proportioned to light extinction. Source; R.B. Husar, pers. comm., Washington University, St. Louis, Mo., 1989 (From Trijonis et al., 1990).
Despite these limitations, a few patterns emerge. For example, it is well established that in Arizona and southern California, visibility is lowest during the summer (Trijonis, 1982a; Air Resources Specialists, 1988; Trijonis et al., 1988; and Husar, 1989, pers. comm., Washington University, St. Louis, Mo.). In contrast, for the northern two-thirds of California, the Pacific Northwest, and the northern mountain states, minimal visibility tends to occur during the fall and winter (Trijonis, 1982b; Air Resources Specialists, 1988; and Husar, 1989, pers. comm., Washington University, St. Louis, Mo.). The winter and fall visibility minimum is especially obvious in the central valley of California (Trijonis, 1982b; Husar, 1989, pers. comm., Washington University, St. Louis, Mo.).
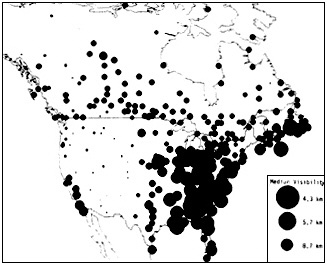
FIGURE 2-8b Median airport visual range for July, averaged over 1979–1983. Larger circles correspond to lower visual range (greater light extinction). The diameter of the circles is proportional to light extinction. Source: R. B. Husar, 1989, pers. comm., Washington University, St. Louis, Mo., 1989 (From Trijonis et al., 1990).
Statistical Patterns
The statistical distribution of visibility, especially with respect to worst-case values (greatest light extinction levels) is of interest. A comprehensive study of the statistical distribution of worst-case extinction levels was conducted by Gins et al. (1981), who used midday observations from 28 airports. Gins et al. sorted the data according to meteorological conditions, eliminating observations with fog, precipitation, blowing dust, clouds, and other obscuring factors; they estimated percentiles from airport data. They characterized the relationship between bad-case and median extinction according to the ratios of upper percentile extinction coefficients to median extinction coefficients. Table 2-2 summarizes the results for three percentiles (90th, 95th, and 99th), for the nation, for four regions, and for the four calendar quarters.
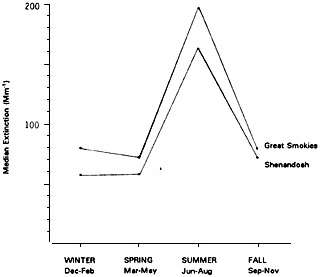
FIGURE 2-9 Seasonal pattern in median light extinction as measured by automated cameras at two eastern National Park Service sites, 1986–1988. Source: Trijonis et al., 1990.
The numbers in Table 2-2 are measures of the episodicity of light extinction levels; a high number indicates that extreme haze episodes are severe relative to the median. The four regions in Table 2-2 show considerable variation: the 99th percentile values exceed median extinction levels by a factor of about 3 to 8; the 95th percentile values by a factor of 2.5 to 4; and the 90th percentile values by a factor of 2 to 3. This last factor compares well with the results of several other studies for 90th percentiles (Trijonis et al., 1990).
Table 2-2 has some interesting features. For example, in the East, the annual episodicity is greater than the episodicity within individual seasons. This partly reflects the strong seasonality of light extinction levels in the East. Another interesting feature is that episodicity in the East is stronger in the summer than in the winter. This means that for worst-case conditions in the East (during the summer) the episodicity is even stronger than it is for average conditions. A similar situation might exist at many western sites, which tend to exhibit highest average extinc-
tion levels in the winter, as well as highest episodicity in the winter.
Historical Trends
Husar has analyzed historical visibility trends using airport data from the late 1940s through the early 1980s (1989, pers. comm., Washington University, St. Louis, Mo.). The 16 maps in Figure 2-11 represent four periods centered upon 1950, 1960, 1970, and 1980, grouped by calendar quarters (i.e., the four seasons).
During the first quarter, declining airport visual range shows evidence of decreased overall winter visibility in the Gulf states. Visibility decreased over the California-Oregon coast through the 1950s and 1960s, but it might have improved somewhat in the 1970s. The Northeast shows an improving trend in visibility.
In the second quarter, visual range decreased significantly over the United States east of the Rockies. Around 1950, the lowest-visibility region was confined to the Ohio and Mississippi valleys. By the 1980s, howev-
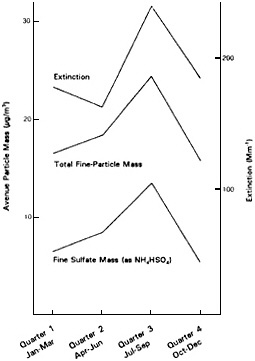
FIGURE 2-10 Seasonal patterns in SO42-, fine-particle mass, and light extinction for rural areas of the eastern United States. The fine-particle mass and fine sulfate mass data are averages over five rural EPA dichotomous sampler sites (Will, Jersey, and Monroe Counties, IL; Erie County, NY; and Durham County, NC). The light extinction data are estimated from seasonal median visibilities (using a Koschmieder constant of 3.0) at eight rural airports. Source: Trijonis et al., 1990.
TABLE 2-2 Average Ratios of Selected Percentiles to the Median for Extinction Coefficients: 1974–1976
|
Period |
Percent |
Nation |
Pacific |
Rocky Mts. |
Central |
Eastern |
|
Annual |
90 |
2.4 |
2.5 |
2.3 |
2.0 |
2.9 |
|
|
95 |
3.2 |
3.6 |
3.0 |
2.5 |
3.6 |
|
|
99 |
5.4 |
6.5 |
5.9 |
3.6 |
5.8 |
|
Jan.– Mar. |
90 |
2.5 |
2.7 |
3.0 |
2.0 |
2.3 |
|
|
95 |
3.2 |
3.5 |
4.0 |
2.4 |
2.9 |
|
|
99 |
5.6 |
6.3 |
7.7 |
3.6 |
4.5 |
|
April– June |
90 |
2.3 |
2.0 |
2.2 |
2.2 |
2.7 |
|
|
95 |
2.9 |
2.4 |
2.8 |
2.7 |
3.4 |
|
|
99 |
4.4 |
3.1 |
5.2 |
3.8 |
5.2 |
|
July– Sept. |
90 |
2.2 |
2.1 |
1.8 |
2.1 |
2.8 |
|
|
95 |
2.8 |
2.6 |
2.3 |
2.6 |
3.6 |
|
|
99 |
4.0 |
3.4 |
3.7 |
3.5 |
5.5 |
|
Oct.– Dec. |
90 |
2.5 |
3.2 |
2.7 |
1.9 |
2.5 |
|
|
95 |
3.2 |
4.2 |
3.6 |
2.2 |
3.0 |
|
|
99 |
5.5 |
6.5 |
7.9 |
2.9 |
4.5 |
|
Source: Gins et al., 1981 (From Trijonis et al., 1990). |
||||||
er, the lowest-visibility region extended over much of the eastern United States.
The most significant historical visibility declines occurred in the East for the third quarter, a phenomenon also reported by others (Munn, 1973; Trijonis et al., 1978; Husar, 1988; Husar et al., 1981; Sloane, 1982, 1983, 1984; Trijonis, 1982b). The visibility decline was especially great in the southeastern states.
The visual-range pattern for the fourth quarter is qualitatively and quantitatively similar to that of the first quarter; of note, visibility in the Northeast increased at the same time that visibility over the Southeast decreased.
These historical records of haziness show significant, coherent trends of visibility over broad regions of the country. However, the trend lines
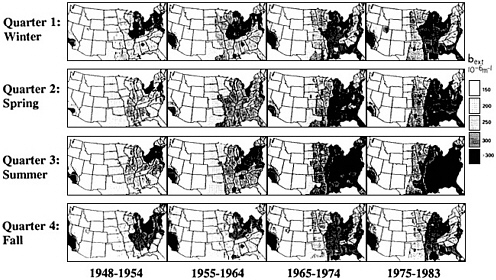
FIGURE 2-11 U.S. trend maps for the 75th percentile extinction coefficient, 1948–1983. Data are derived from air-port visual range measurements for the calendar quarters: winter, spring, summer, and fall. Source: R.B. Husar, pers. comm., Washington Univeristy, St. Louis, Mo., 1989 (From Trijonis et al., 1990; Husar and Wilson, 1993).
are significantly different in the Northeast and Southeast. To emphasize this difference, regional and seasonal trends are displayed in Figures 2-12 and 2-13. These figures compare the aggregate for the Northeast—Indiana, Ohio, Pennsylvania, New York, New Jersey, Delaware, Maryland, Kentucky, West Virginia, and New England—with the aggregate for the Southeast—states south of the statistic above and east of the Mississippi. In the Northeast, the annual extinction coefficient is virtually unchanged (Figure 2-12), but the Southeast shows a 60% increase in annual haze over the 35-year period. In the Northeast, winter haze (Figure 2-13) shows a 25% decline, while the Southeast shows a 40% increase. The summer extinction coefficient in the Northeast shows a moderate overall rise. In the southeastern states the summer extinction coefficient increased by 80%, the change occurring mainly in the 1960s.
If sulfates are the major contributor to haze in the East, as many studies imply (see, for example, Table 6-1), then visibility could be expected to be related in some way to sulfur dioxide (SO2) emissions. In light of the strong regional and seasonal differences discussed above, Husar et al. separately compared visibility trends with SO 2 emissions for the Northeast and the Southeast and for winter and summer (1989, pets. comm., Washington University, St. Louis, Mo.). Husar et al. compiled emission trends using the historical yearly emission data gathered by Gschwandnter et al. (1985) and Husar (1986) as well as the historical monthly emission data gathered by Knudson (1985).
Light extinction and sulfur dioxide (SO2) emissions trends for the Northeast in the winter and summer are depicted in Figures 2-14a and 2-14b. The corresponding trends for the Southeast are illustrated in Figures 2-15a and 2-15b. Regional and seasonal trends are well correlated with historical light-extinction and SO2 emission trends. Since the late 1940's, light extinction has declined moderately in the North during the winter and increased moderately during the summer; these trends are matched closely by the trends in SO2 emissions. Over the same period, emissions and haze increased moderately during the winter in the Southeast, and a very strong increase was observed in both during the summer. The trends of increased emissions and increased light extinction show the greatest rise during the 1950s and 1960s and level off or decrease after the 1970s. The data suggest that, since the late 1940s, changes in light extinction over the eastern United States largely have been driven by changes in SO2 emissions.
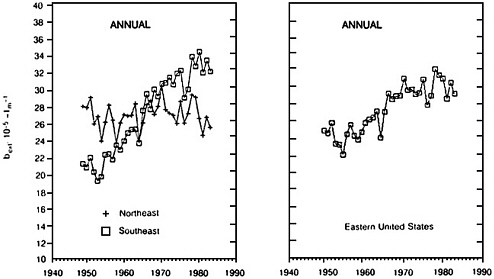
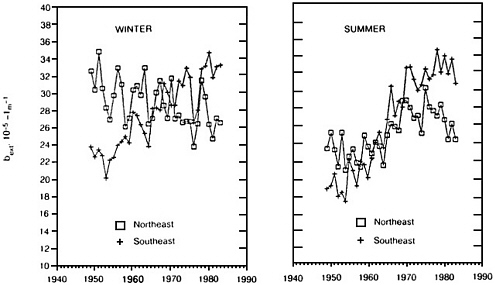
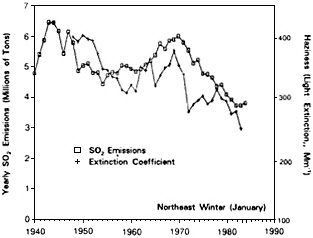
FIGURE 2-14a Comparison of SO2 emission trends (![]() ) and extinction coefficient (+) for the northeast United States during winter months. Source: R.B. Husar, pers. comm., Washington University, St. Louis, Mo., 1989 (From Trijonis et al., 1990; Husar and Wilson, 1993).
) and extinction coefficient (+) for the northeast United States during winter months. Source: R.B. Husar, pers. comm., Washington University, St. Louis, Mo., 1989 (From Trijonis et al., 1990; Husar and Wilson, 1993).
SOURCES OF VISIBILITY-IMPAIRING MATERIALS
Natural Sources
Trijonis (1982a, b) and Trijonis et al. (1990) have evaluated natural background visibility (i.e., visibility in the absence of anthropogenic pollution) and the types of materials present in the unpolluted atmosphere for the eastern and western United States. The evaluation incorporates data on the concentrations of the major components of airborne particles: SO42-, organic matter, elemental carbon, nitrates, soil dust, and water. The estimates of natural aerosol concentrations are developed from three types of information:
-
Compilations of data on emissions from natural and human sources;
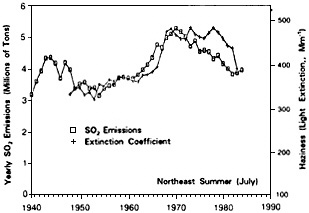
FIGURE 2-14b Comparison of SO2 emission trends (![]() ) and extinction coefficient (+) for the northeast United States during summer months. Source: R.B. Husar, pers. comm., Washington University, St. Louis, Mo., 1989 (From Trijonis et al., 1990; Husar and Wilson, 1993).
) and extinction coefficient (+) for the northeast United States during summer months. Source: R.B. Husar, pers. comm., Washington University, St. Louis, Mo., 1989 (From Trijonis et al., 1990; Husar and Wilson, 1993).
-
Ambient measurements of aerosol species in remote areas (especially in the southern hemisphere);
-
Regression studies of visibility against the concentrations of trace elements associated with anthropogenic and natural emissions.
The estimates exclude factors such as precipitation, fog, blowing snow, and sea spray. Because sea spray and fog are excluded, the results might not be representative of natural visibility in coastal areas, rather the natural background estimates are intended to be annual and spatial averages that exclude those areas.
For the East, the analysis yields an average natural background visual range of 150 ± 45 km. This is equivalent to a light extinction level of 26 ± 7 Mm-1, or a little more than twice the level caused by Rayleigh (clear-air, ''blue sky'') scattering of light by air molecules. For the arid West, the average background visual range is estimated as 230 ± 35 km, a value equivalent to a light extinction level of 17 ± 2 1/2 Mm-1, which is about 1.5 times the level caused by Rayleigh scattering alone. (The error bounds are estimates of uncertainties in the spatial and annual averages.)
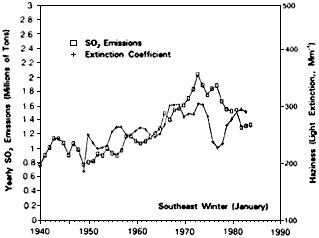
FIGURE 2-15a Comparison of SO2 emission trends (![]() ) and extinction coefficient (+) for the southeast United States during winter months. Source: R.B. Husar, pets. comm., Washington University, St. Louis, Mo., 1989 (From Trijonis et al., 1990).
) and extinction coefficient (+) for the southeast United States during winter months. Source: R.B. Husar, pets. comm., Washington University, St. Louis, Mo., 1989 (From Trijonis et al., 1990).
Trijonis et al. (1990) estimated that the major contributors to natural extinction levels in the East are Rayleigh scattering (46%), organics (22%), water (19%), and suspended dust, including coarse particles (9%). The major contributors in the West are Rayleigh scattering (64%), suspended dust (14%), organics (11%), and water (7%). The contribution of water is due to the hygroscopic components in airborne particles. Water is the most uncertain contributor, and it might be overestimated, given the very small amounts of SO42- and nitrates in the natural background particles (Trijonis et al., 1990). A significant fraction of the water in the natural background particles might be associated with organics because natural concentrations of organics are greater by a factor of 10 than those of SO42- or nitrate.
Based on the above assessment, the most important sources of natural visibility-reducing particles are sources that emit organic materials and dust particles. Natural organic particles are produced as primary emissions (e.g., wildfire smoke, plant waxes, and pollen) and as a result of conversion from volatile organic compound (VOC) emissions (e.g., terpenes and other hydrocarbons). Natural mineral dust comes from the action of wind on soils.
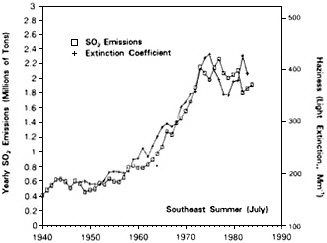
FIGURE 2-15b Comparison of SO2 emission trends (![]() ) and extinction coefficient (+) for the southeast United States during summer months. Source: R.B. Husar, pers. comm., Washington University, St. Louis, Mo., 1989 (From Trijonis et al., 1990).
) and extinction coefficient (+) for the southeast United States during summer months. Source: R.B. Husar, pers. comm., Washington University, St. Louis, Mo., 1989 (From Trijonis et al., 1990).
On an annual average basis, the concentrations of natural particles are generally small compared with concentrations of anthropogenic particles. However, two natural particle sources—wildfires and windblown dust—are extremely episodic, and they can be the dominant cause of visibility reduction at certain times. As illustrated in Figure 2-16, most of the wildfire activity (in terms of acres) occurs in the Rocky Mountain states, the Pacific Coast, and the Southeast. The area most affected by intense dust storms centers around the Texas panhandle (see Figure 2-17). It should be noted that, for both of the above sources, the distinction between natural and anthropogenic influences is somewhat blurred.
Anthropogenic Sources
Fine particles are the primary cause of anthropogenic haze. Coarse particles (predominantly soil dust) and gaseous nitrogen dioxide (NO2) can also play a significant role. Anthropogenic dry fine aerosol consists almost entirely of just five pollutants: sulfates, organics, elemental
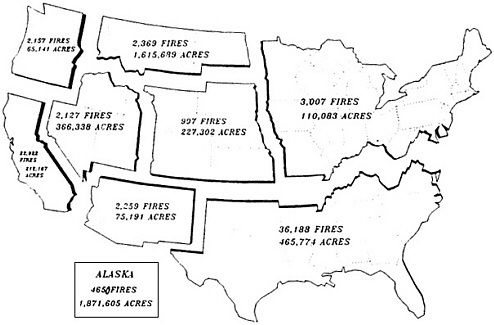
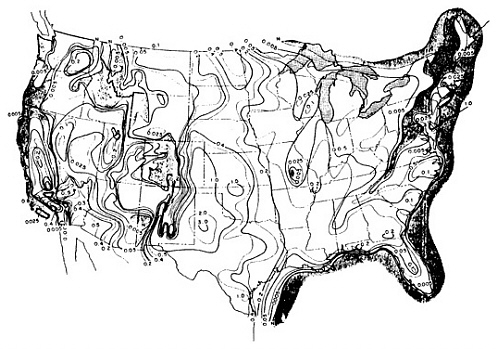
FIGURE 2-17 Annual percentage frequency of dusty hours based on hourly observations from 343 weather observation stations that recorded dust, blowing dust, and sand when prevailing visibility was less than 7 miles (11 km). Shaded areas represent no observations of dust. Period covered is approximately 1940 to 1970. Source: Orgill and Sehmel, 1976.
carbon, soil dust, and nitrates. Consequently, from the standpoint of visibility, the most important anthropogenic emissions are SO2 (precursor of SO42- particles), primary organic particles, gaseous VOCs (precursor of secondary organic particles), primary elemental carbon particles, soil-derived material, ammonia (NH3) (a precursor of ammonium nitrate), and nitrogen oxides (NOx, which are precursors of nitrate aerosols and NO2). Figure 2-18 illustrates the important anthropogenic sources of each emission in the United States. For some emissions, one source category stands out:
-
SOx: Electric utilities contribute about 70% of the total.
-
NH3: Livestock waste management operations are the dominant source.
-
Elemental carbon: Diesel-fueled mobile sources account for about half of the emissions.
-
Suspended soil dust: Vehicular traffic is presumably the predominant anthropogenic source.
For NOx, three categories stand out: electric utilities, gasoline-fueled vehicles, and diesel-fueled mobile sources. VOCs and primary organic particles are emitted in significant quantities from a wide variety of sources; the most important are gasoline-fueled vehicles, residential wood burning, petroleum and chemical industrial sources, solvent evaporation, and burning for forest management.
SUMMARY
Visibility impairment episodes range in scale from local plumes to widespread regional haze. The most intense regional haze in the United States occurs in the East, where the median standard visual range (calculated from airport data) is generally less than 30 km. The best visibility in the country is found in the arid, mountainous Southwest, where median standard visual range exceeds 150 km. In the adjoining regions to the north and south, median standard visual range is also good, exceeding 100 km. Median visual range falls to less than 50 km along the northern Pacific coast, less than 30 km in the central valley of California, and less than 15 km in the Los Angeles basin. Visibility generally improves with altitude.
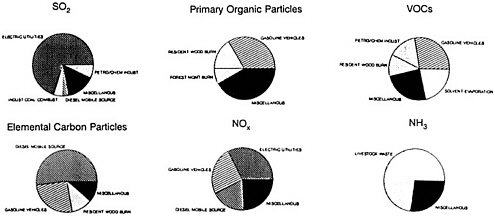
FIGURE 2-18 Anthropogenic inventory of visibility-related emissions for the United States. Based on the 1985 NAPAP inventory (Zimmerman et al., 1988a; Placet et al., 1990), except copper smelter emissions, which have been updated for 1988 (Trexler, pers. comm., DOE, Washington, D.C., 1990). A pie chart is not shown for suspended dust; vehicular traffic on paved and unpaved roads is assumed to be the predominate source.
National Park Service data show that sulfate particle concentrations are about six times greater in the rural East than in the rural West; elemental carbon and organic particle concentrations are about twice as great in the rural East as in the rural West; and concentrations of fine soil dust and nitrates are about the same in both regions. In the East, airport data and NPS camera data reveal a strong summertime visibility minimum that is strongly linked to a summertime maximum in sulfate concentrations.
Airport data from the late 1940s through the early 1980s show coherent visibility trends over large regions. In the Northeast, visibility has moderately improved during the winter and moderately decreased during the summer. Visibility in the Southeast has worsened moderately during the winter and substantially during the summer. The greatest increases occurred during the 1950s and 1960s. It is likely that changes in SO2 emissions are largely responsible for these changes in visibility.
The average natural background visual range varies from about 150 km in the eastern United States to 230 km in the arid West. The major contributors to natural extinction are Rayleigh scattering, organics, water, and suspended dust. The main constituents of anthropogenic haze are sulfates, organics, elemental carbon, soil dust, nitrates, and water. The principal anthropogenic haze-causing emissions are sulfur dioxide (SO2, a precursor of sulfate particles), primary organic particles, gaseous volatile organic compounds (VOCs, precursors of secondary organic particles), primary elemental carbon, primary crustal material, ammonia (NH3, a precursor of ammonium nitrate), and nitrogen oxides (NOx, precursors of nitrate particles and NO2). Except for VOCs and primary organics, the anthropogenic emission inventories for these species are dominated by relatively few source categories.


