
5
Food and Water Consumption
DIETARY EXPOSURE OF CHILDREN to pesticides can be estimated by combining data on levels of pesticide residues in foods with data on food consumption patterns for infants and children. Risks to health can be assessed by combining estimates of dietary exposure with information on the toxic potential of pesticides. Various data bases are available for use in these calculations. In this chapter, the committee reviews the dietary surveys conducted to assess patterns of food consumption by the U.S. population, including infants and children. It examines the methods used in these surveys and evaluates their relative strengths and weaknesses. The committee then describes the age-related differences in food consumption patterns demonstrated by survey data and discusses food consumption estimates. The committee also notes various factors and limitations that must be considered in determining the basis for estimating exposure to pesticides residues in food and assessing the risk to infants and children.
FOOD CONSUMPTION SURVEYS
Small-scale studies on food intake and nutrition were first conducted toward the end of the nineteenth century, when processing techniques were leading to rapid changes in the food supply. The variety of foods available to consumers again increased when in-home refrigerators and freezers became generally available, more sophisticated preservation techniques were introduced, and manufactured foods found their way into the retail market. By 1960 approximately 60% of the food items on supermarket shelves had come into existence during the preceding 15 years, that is, since the end of World War II (Hampe and Wittenberg, 1964).
It therefore became of great interest to researchers to determine what the people of this country were actually eating. In 1909 the U.S. Department of Agriculture (USDA) began to identify changes in the foods available to the civilian public by determining the disappearance of foods into the wholesale and retail markets. This is still done annually by subtracting data on exports, year-end inventories, nonfood uses, and military procurement from data on total production, imports, and beginning-of-the-year inventories. Overestimates result from this method, however, because losses that occur during processing, marketing, and home use are not taken into account. Thus, the resultant information is sometimes called availability or use of foods or nutrients (Stamler, 1979).
The USDA estimates national per capita use of foods or food groups by dividing the total available food by the total U.S. population. These data provide information on overall trends in available foods, but they do not indicate how use varies among population subgroups or individuals.
Since 1935 the USDA's Human Nutrition Information Service (HNIS) has conducted a series of Nationwide Food Consumption Surveys (NFCS). The first four (1935, 1942, 1948 [urban only], and 1955) surveyed household food use over a 7-day period. No record was made of waste or difference in use among household members. Surveys conducted in 1965–1966, 1977–1978, and 1987–1988 included information on the kinds and amounts of foods eaten by individuals in the household in addition to household food use. For the reasons given later in this chapter, the 1977–1978 survey served as the major source of consumption data used by the committee in the present study.
The USDA has conducted a planned series of surveys since 1985 solely concerned with individual food intake (USDA, 1985, 1986a,b, 1987a,b,c, 1988). The results of the most recent surveys have not yet been published. In these surveys, called Continuing Surveys of Food intakes of Individuals (CSFII), data are collected on three separates samples: women 19 to 50 years old and their children 1 to 5 years old (the core group); a sample of low-income women and their children; and in 1985 only, men 19 to 50 years old. In the 1989, 1990, and 1991 surveys, data were collected on all individuals.
The National Center for Health Statistics (NCHS), a division of the Department of Health and Human Services, has conducted the National Health and Nutrition Examination Surveys (NHANES) since 1971. The purpose of these surveys is to monitor the overall nutritional status of the population of the United States through comprehensive health and medical histories, dietary interviews, physical examinations, and laboratory measurements. The committee opted not to use the results from these surveys, however, because the number of observations within the age and demographic categories of interest were inadequate for the purposes of the present study.
The only national study of average intakes of pesticides, toxic substances, radionuclides, and industrial chemicals is the Total Diet Study conducted by the Food and Drug Administration (FDA). Four times a year, foods considered to be representative of the average U.S. diet are purchased from grocery stores across the United States and individually analyzed in FDA laboratories for the constituents mentioned above. Until April 1982 the food items used in the Total Diet Study were based on data from the 1965–1966 NFCS. Since then, they have been based on data from the 1977–1978 NFCS and second NHANES, which was conducted during 1976–1980. (The Total Diet Study is discussed further in Chapter 6, which focuses on pesticide residues in food.)
Infants, defined as less than 1 year of age, represent a separate and extremely critical population group with respect to purposes of this study. The number and classification of foods consumed by infants are almost exclusively processed and manufactured by a limited number of companies. Dietary intake studies have been conducted by Gerber Products Company and Ross Laboratories to evaluate intake for these populations, and those dietary studies were used by the committee.
SURVEY METHODOLOGY
Three basic types of methods are used to gather data in food consumption surveys (Burk and Pao, 1976; Dwyer, 1988): retrospective, prospective, and a combination of retrospective and prospective. Retrospective methods include the 24-hour (or 1-day) food recall and the food frequency questionnaire. Prospective methods require the used of food records or diaries—the weighed food record and the estimated food record (sometimes called the household measure food record). In combination surveys, investigators use both prospective and retrospective methods, e.g., the recall and weighed food record. (For a comprehensive overview, see Dwyer, 1988.)
Retrospective Methods
The 24-Hour (or 1-Day) Recall Method
In surveys conducted with this method, interviewers ask subjects to recall the quantities of particular foods and beverages consumed on the previous day or during the preceding 24 hours. More precise estimates of portions are obtained when the respondents are provided with measurement guides such as food models, abstract shapes, and tableware (DHHS, 1983); measuring cups, spoons, and rulers (USDA, 1987); and pictures (Frank et al., 1977; Posner et al., 1982).
Madden et al. (1976) found no significant differences between mean intake data obtained from the 24-hour recall and actual observed intake
over that period. They noted, however, that the data were not representative of an individual intake averaged over different days. Recalls of food consumption over a period longer than 24 hours produce more representative data on general intake patterns, but are less precise than the 24-hour recall because they depend to a greater extent on memory (Block et al., 1986).
In general, the validity of the recall method and the extent of bias depend on a variety of factors related to collection methods (Backstrom and Hursh-Cesar, 1981). In face-to-face interviews it is easier to elicit a response. Such interviews are more efficient when there are several family members or a long questionnaire; however, they are expensive primarily because of travel costs. In contrast, telephone interviews are relatively inexpensive, quick, easy to monitor, unlimited geographically, and can ensure a greater degree of anonymity ( Wilson and Rothschild, 1987). Telephones may be used in combination with, or as a follow up to, other interview techniques. They do have several disadvantages, however: subjects can easily terminate an interview prematurely, long or complicated questionnaires are difficult to administer, and many low-income families lack telephones. In all cases, selection and training of the interviewers are critical to the success of the survey.
The single, short (15- to 30-minute) guided interview produces higher response rates than all other methods. Moreover, accuracy is enhanced in several ways: the recall period is short and precise, measurement aids may be used to increase the accuracy of consumption estimates, and the quantities reported can be easily converted to nutrient equivalents.
Mail interviews are inexpensive, and they may be used in combination with other interview methods (Posner et al., 1982). Furthermore, interviewer bias is avoided. Negative aspects include low response rates, exclusion of illiterate persons, and lack of control over who responds and how they respond.
Food Frequency Questionnaires
In its simplest form, the food frequency questionnaire consists of a checklist of foods or food groups and a set of categories indicating daily, weekly, or monthly frequency of food consumption during a specified period—weeks, months, or a year. The checklists may contain as few as 20 items or more than 100. The questionnaire can be administered in person, over the telephone, or by mail, with the attendant advantages and disadvantages described above (Willett et al., 1985). Subjects may use a visual aid to estimate portion sizes (Chu et al.,1984). When the quantities have been estimated, the nutrient content of the foods consumed may in turn be estimated.
The food frequency questionnaire is a quick, inexpensive, and simple
method for obtaining information on food intake from large numbers of subjects (Sampson, 1985), and its administration does not require highly trained personnel. Epidemiologist have found the questionnaire useful in studying the relationship between diet and disease risk. Attempts have been made to validate the accuracy of consumption frequency estimates by comparing them to food records (Chu et al., 1984; Willett et al., 1985; Freudenheim et al., 1987).
The limitations of this method outweigh its strengths. Its accuracy may be compromised by the long recall period, estimates of past intake may be biased by current intake, and respondent burden is heavy if the checklist is long and complex. Moreover, the questionnaire may not be appropriate for people who consume unusual diets or for children. In the future, a combination of methods may be used to overcome these limitations.
Prospective Methods
Food Records or Diaries
These usually self-administered reports of current food intake can cover periods ranging from 1 day to as long as 1 year (Basiotis et al., 1987). Subjects or their surrogates, e.g., parents, record the portions of all foods and beverages ingested immediately after each eating occasion.
The foods are either weighed (the weighed food record) (Acheson et al., 1980; Anderson and Blendis, 1981; Marr and Heady, 1986) or measured with a cup, ruler, or other aid (the estimated food or household measure record) (McGee et al., 1982; Acosta et al., 1983; Elahi et al., 1983). Foods eaten away from home must be estimated. The latter method is used most often, but the weighed food record is widely regarded as the most accurate procedure and is often used to validate other methods. Both methods require trained personnel to demonstrate proper weighing, or measuring, and recording techniques. Written instructions are also provided (Sempos et al., 1984).
Reliance on memory is minimal, the recall period is precise, interviewer bias is avoided, omissions of foods and beverages consumed tend to be minimal, and the accuracy of portion estimates is enhanced by the weighing and measuring techniques. However, respondents must be literate and willing to accept the heavy burden of participation—factors that can bias the sample. In long-term surveys, boredom or fatigue may lead to a decline in accurate reporting.
Combined Retrospective and Prospective Methods
A combination of recall and records methods is sometimes used to obtain multiple-day intake data for individuals in a large survey or study
(Schnakenberg et al., 1981; USDA, 1983). Because the limitations of one method offset the limitations of the other, a greater accuracy of mean intake estimates can be expected. Examples of combinations include 1-day recall and 2-day record (Patterson, 1971; USDA, 1983), 3-day recall and 4-day record (Futrell et al., 1971), and 1-day recall and 14- to 17-day record (Schnakenberg et al., 1981). Diet histories may also involve a combination of methods (Dwyer, 1988).
Methods Used in USDA Surveys
Although the USDA has sought similar information in its various dietary intake surveys, it has changed the methods used in an attempt to obtain better measures of average intake. The agency has advanced from a 1-day recall only insuring (1965–1966 Household Food Consumption Survey) to a 3-day combination (1-day recall and 2-day record) during all four seasons in the 1977–1978 and 1987–1988 NFCS. The 3 days of intake data for more than 30,000 people, obtained by using this combination method, produced a better measure of an individual's average intake than did the 1-day measure used in 1965.
In the 1985 and 1986 CSFII, 6 nonconsecutive days of intake data were collected by trained interviewers who administered the 1-day recall method every 2 months over the course of the year. The first interview was conducted in person; the remaining five were accomplished over the telephone. Mothers provided the recall information for their children. This system proved costly, and the drop-out rates over the course of the year were high (Table 5-1). The substantial decrease in participation (approximately 50%) can be attributed to either the 145 respondents (10% of the sample) who moved to another geographical region or to such socioeconomic characteristics as being younger, having a low income, being in poor health, being on a special diet, having one or more children, being a suburban dweller, or working.
As a result of the drawbacks in the 1985 and 1986 CSFII, the combination of 1-day recall and 2-day record used in the 1977–1978 NFCS was reinstituted in the 1987–1988 NFCS and the 1989 and subsequent CSFII to obtain 3 consecutive days of dietary intake data. In both the NFCS and later CSFII, dietary information was collected on all individuals—not just the sex-age groups surveyed in the 1985 and 1986 CSFII.
SURVEY DESIGN
To determine the validity of a survey sample, it is necessary to consider a variety of factors such as the survey design, sample weighting, and comparison of resulting data to standards. The committee began by examining
TABLE 5-1 Unweighted Counts of Individuals for the 1985 and 1986 CSFII
|
|
|
|
Number of Subjects in Surveya |
|
|
Year |
Income Category |
Subjects |
First Day |
All 6 Days |
|
1985 |
All Incomes |
Children |
489 |
161 |
|
Women |
1,459 |
692 |
||
|
Men |
658 |
NAb |
||
|
1985 |
Low Incomes |
Children |
1,190(714)c |
221 |
|
Women |
2,081(1,322)c |
547 |
||
|
1986 |
All Incomes |
Children |
509 |
219 |
|
Women |
1,451 |
751 |
||
|
1986 |
Low Incomes |
Children |
762 |
307 |
|
Women |
1,320 |
595 |
||
|
a The numbers in these columns are not additive since the represent different study groups. b Men were sampled for only 1 day. c More responses than expected were received for day 1, and they included a large number of low-income households. To reduce the number of low-income households to the targeted number of 1,200 for interviewing on days 2-5, systematic subsamples were drawn for both women and children. The numbers in parentheses refer to those subsamples. SOURCE: USDA, 1988. |
||||
the design of the CSFII and the NFCS. The 1985 and 1986 CSFII and the 1977–1978 and 1987–1988 NFCS were designed to provide a multistage, stratified, probability sample that was representative of the 48 conterminous states.
A multistage sample is drawn by selecting random groups in stages. At each stage, groups of individuals are selected from increasingly smaller segments of the population. The term stratified indicates that the population is divided into mutually exclusive subsets, or strata, before the sample is drawn. Taken together, these subsets represent the total population that is being examined. However, the sampling plan is applied separately within each stratum. Because the strata are defined by geographic location, the sampling within each stratum is called an area sample.
In a probability sample, every group has a known probability of selection. Thus, every element in the population must be enumerated before the sample is drawn to facilitate determination of the likelihood of selecting any group of individuals into the sample. These probabilities may or may not be equal for all groups. The use of uniform criteria for each group helps minimize the extent of enumeration required to determine selection probabilities. Each group sampled, therefore, has a known probability of selection. Although this method is fairly complex, it provides data that
TABLE 5-2 Distribution of Strata within the Conterminous United States as Defined by the Bureau of Census Geographic Divisions
|
|
|
Number of Strata |
||
|
Region |
Census Division |
Central City |
Suburban |
Nonmetropolitan |
|
Northeast |
New England |
1 |
1 |
1 |
|
Middle Atlantic |
3 |
5 |
1 |
|
|
Midwest |
East North Central |
3 |
6 |
2 |
|
West North Central |
1 |
1 |
2 |
|
|
South |
South Atlantic |
2 |
5 |
3 |
|
East South Central |
1 |
1 |
2 |
|
|
West South Central |
2 |
3 |
2 |
|
|
West |
Mountain |
1 |
1 |
1 |
|
Pacific |
3 |
5 |
1 |
|
|
Total |
|
17 |
28 |
15 |
|
SOURCE: Adapted from the U.S. Department of Agriculture, 1985. |
||||
are statistically projectable, with known sampling error, to the entire conterminous United States. Nonprobability samples, where groups are not enumerated, are generally easier to obtain but do not provide data that are statistically projectable to the general population.
The 48 states were grouped into the nine census geographic divisions, which in turn were divided into three classifications: central city, suburban, and nonmetropolitan (Table 5-2). From these 27 superstrata, 60 strata (17 central city, 28 suburban, and 15 metropolitan) were obtained. Both the CSFII and the NFCS surveys consisted of four stages. During the first stage, the probability proportion to size (PPS) technique was used to select two primary sampling units (PSUs) from each of the 60 strata in both the CSFII and NFCS. These 120 PSUs included counties, cities, or parts of cities, and were relatively homogenous with regard to demographic characteristic.
In designing food surveys, care must be taken to ensure that the sample of consumers is representative of the general population. Even a scientifically designed probability sample may not be representative due to nonresponse and other practical problems. This could lead to bias in the estimates of mean intake, especially if there is a systematic component to the nonresponse. An accepted method for adjusting the estimates of intake would be to weight the data in such a way that they more closely reflect the general population. Fuller (1991) discusses using regression estimation for adjusting intake when appropriate auxiliary information exists. Fuller et al. (1991) adjusted intake for sociodemographic factors for the 1987–1988 NFCS and found a significant difference between the resulting mean intake as compared with mean intake calculated without such weighting.
Nusser et al. (1991) considered characterizing usual daily intake distributions as opposed to mean daily intake. Usual intake is useful in providing information about nutritional deficiencies occurring over a long period. They show that use of the distribution of mean intake as an estimate of the distribution of usual intake can lead to erroneous inferences regarding nutritional status. In particular, the variance of mean intakes contains intra individual variability and is thus greater than the variance of usual intakes. Other parameters of the two distributions may differ as well.
SAMPLE WEIGHTS
Although the CSFII and NFCS samples were designed to be self-weighting, adjustments to the samples were required because not all eligible households participated, not all eligible individuals in eligible households were interviewed, and not all interviews yielded complete dietary information. Weighting factors were developed for each individual participating in the survey and were applied to data from completed intake records to adjust for these sources of nonresponse. Other weighting considerations included economic homogeneity, geographic heterogeneity, and age.
SAMPLE SIZE
Sample size is an important determinant of sample variation and statistical precision. Decisions regarding sample sizes therefore depend on the level of precision desired for the data needed to estimate a population parameter of interest.
The size of the sample required an established goal of precision for an estimate can be determined through calculations that depend on the coefficient of variation (CV) and an assumed probability distribution for the data. The coefficient is the standard error of an estimate expressed as a fraction of the sample mean. As the CV of an estimate increases, its accuracy decreases. In general, NFCS and CSFII intake estimates with CVs exceeding 50% are not published. Estimates with CVs of 15% to 50% are published by USDA with caveats regarding their accuracy.
COMPARISONS OF INTAKE DATA WITH STANDARDS
Intake data are often compared with a widely accepted value such as the Recommended Dietary Allowances (RDAs). The RDAs are intended to meet ''the known nutrient needs of practically all healthy persons" in the United States (NRC, 1989); however, since nutrient needs vary among people, margins of safety are built into the RDAs for many nutrients. For
this reason, analysts have selected a fixed cutoff point, such as two-thirds or three-fourths of the RDA, as a point of comparison. One committee convened by the Food and Nutrition Board (FNB) of the National Research Council suggested that distributions of requirements or tolerances would be more appropriate for this purpose (NRC, 1986). This FNB committee recommended that a probability approach be used to estimate the prevalence of inadequate intake, i.e., the probability that a specific intake is inadequate to meet an individual's requirement (NRC, 1986).
VALIDATION OF FOOD CONSUMPTION DATA
Food consumption data must be validated before they are used to calculate risk, in part because the integrity of formulated and combined foods is compromised when those foods are broken down into their constituents. The method of calculation used by the EPA to estimate risk converts consumption data directly into food components, thereby eliminating the need to follow all the separate validation steps. (See "Quantification of Consumption Data," below, for a further discussion of the EPA method.)
Substantial uncertainty is inherent in food consumption data because of a variety of factors. Principal among these are recording errors and biases. It is therefore difficult to extrapolate results to the general U.S. population.
Of the different protocols that have been used in dietary surveys, none is uniformly better than all others. Even the most extensive dietary sampling schemes may be subject to biases or practical limitations. Because of this, a variety of survey methods have evolved to address different objectives, each with its own strengths and weaknesses.
Two primary objectives of food consumption surveys are to assess the mean intake of a group of individuals or the mean intake of a particular individual. Because food consumption varies markedly both within individuals and between individuals (Beaton et al., 1979; Beaton et al., 1983; Todd et al., 1983), methods that are appropriate for one objective may not be appropriate for the other.
The validity of the results relative to the study objectives is of central importance (Block, 1982). Validation of data on food consumption is a difficult task. Ideally, all types and quantities of food consumed by the survey respondents would be recorded in a complete and accurate fashion; this record of actual consumption could then be used as a reference value against which to compare estimates of consumption based on different survey protocols. Kim et al. (1984) studied a method whereby individuals are asked to set aside a duplicate portion of the food they ate for future
analysis. The investigators found that the process of setting aside the extra food actually led to smaller quantities consumed than in the usual pattern of intake. To avoid biases associated with self-reported food consumption data, an inconspicuous observer could maintain a diary of foods consumed—a technique used by Madden et al. (1976), Gersovitz et al. (1978), and Krantzler et al. (1982). However, these studies were carried out in controlled environments such as dormitories, dining halls, or other congregate meal sites, thus making it difficult to extrapolate conclusions to the general population.
Because of the difficulties in measuring actual intake, validation to a large extent tended to focus on the comparison of results obtained from different survey methods (Block, 1982). For example, relatively new survey methods such as questionnaires have been compared with established methods such as multiple-day records (Jain et al., 1980; Axelson and Csernus, 1983; Willett et al., 1985; Byers et al., 1987; Krall and Dwyer, 1987; Pietinen et al., 1988). Methods are also sometimes compared to determine which one will produce the most reliable estimates of intake of specific nutrients such as vitamin A (Young et al., 1952; Russell-Briefel et al., 1985; Sorenson et al., 1985).
THE STRENGTHS AND WEAKNESSES OF THE FOOD CONSUMPTION DATA BASES IN ESTIMATING PESTICIDE EXPOSURE OF CHILDREN
The 1977-1978 NFCS data have the following major limitations.
-
Over the years since that survey was conducted, average overall dietary patterns may have changed in response to advanced food technology, advertising, taste, and health consciousness, among other variables.
-
The sample of nursing infants was small (n = 106).
-
The 3-day survey period reflects too brief a consumption period, even though it was conducted over all four seasons.
-
Water consumption was not considered.
Despite these substantive limitations, the NFCS has provided the only comprehensive data currently available for comparisons of food consumption by all age classes in our population, which is the primary reason the committee chose the 1977–1978 NFCS as the basis for this report. Because the EPA also relies on the same food intake data, the committee's findings can easily be compared with the risks estimated by that agency. The committee compensated for the limited sample size for nursing infants by reviewing survey data reported by Purvis and Bartholmey (1988).
Appraisal of these results validated the similarity of results, even though methodology and sample selection were different.
The 1987–1988 NFCS data were not used by the committee because of the low response rate (34%) and resulting procedural problems. Furthermore, the committee found that the sampling units were so small that in some cases they were not representative of certain age or geographical sectors. At a later date, the U.S. Government Accounting Office (GAO, 1991) conducted an independent evaluation of the 1987–1988 NFCS data and came to similar conclusions. Thus, the data obtained in this survey were not adequate for use by the committee in fulfilling its mandate.
The CSFII provides a more recent view of consumption patterns; however, these surveys experienced high drop-out rates, as described above, and are limited to children between the ages of 1 and 5 years (USDA, 1985, 1986a). They provide no data on infants less than 1 year old or on children between the ages of 6 and 18 years.
To gain a clearer view of the consumption patterns of infants, the committee examined the results of an Infant Nutrition Survey conducted by the Gerber Products Company in 1986. This was one in a series of surveys conducted by Gerber since 1969 to monitor infant feeding practices, nutrient intake, and nutrition contribution and changes (Purvis, 1973; Johnson et al., 1981; Purvis and Bartholmey, 1988).
With the exception of minor refinements, the same method for collection and compilation of data has been used in each of the Gerber surveys to facilitate comparisons over time (Purvis, 1973; Johnson et al., 1981). Initial contact was made through mail questionnaire. The consumption data were collected in a 4-day diary maintained by a parent who had been given instructions for recording intake information and obtaining additional assistance. After the diaries had been completed and returned, interviewers used the telephone to clarify information when needed. The data were analyzed to determine usual nutrient intake, portion size, food preferences, and age at which supplemental foods were introduced.
The 1986 Gerber sample initially consisted of 1,000 infants between the ages of 2 and 12 months. Balance of age and geographic distribution was achieved to the extent possible through random sample generation (Table 5-3). There were 637 satisfactorily completed diaries—a return rate of 64% (G. Purvis, Gerber Products, personal commun., November 14, 1990).
The results of the Gerber survey were found to reflect the same consumption patterns for infants and children as did the USDA surveys (Figure 5-1). Furthermore, a comparison of data from the CSFII and the NFCS showed that some of the foods that dominate the diets of children have changed little in the decade between the 1977–1978 NFCS and the 1985 and 1986 CSFII. With this additional confidence in the larger NFCS
TABLE 5-3 Sample Selected in the 1986 Gerber Infant Nutrition Survey
|
|
Age, Months |
|||||||||||
|
Region |
2 |
3 |
4 |
5 |
6 |
7 |
8 |
9 |
10 |
11 |
12 |
Totals |
|
Northeast |
16 |
17 |
17 |
16 |
17 |
17 |
17 |
16 |
17 |
17 |
17 |
184 |
|
North Central |
22 |
22 |
22 |
22 |
22 |
22 |
22 |
22 |
22 |
22 |
23 |
243 |
|
South |
32 |
31 |
31 |
32 |
31 |
32 |
31 |
32 |
31 |
32 |
31 |
346 |
|
West |
21 |
21 |
20 |
21 |
21 |
20 |
21 |
21 |
21 |
20 |
20 |
227 |
|
Totals |
91 |
91 |
90 |
91 |
91 |
91 |
91 |
91 |
91 |
91 |
91 |
1,000 |
|
SOURCE: Based on data from Gerber Products Company, personal communication, 1992. |
||||||||||||
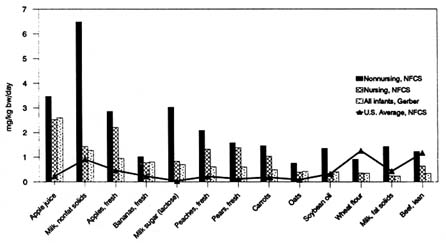
FIGURE 5-1 A comparison of infant intake data (on raw agricultural commodities) from Gerber Products, 1988, unpublished, and from USDA, 1983.
data base, the committee decided to use the results of the 1977–1978 NFCS as the basis for its consumption estimates. The 1985 and 1986 CSFIIs were used to account more fully for intraindividual variation and differences among ages for children less than 5 years of age.
WATER INTAKE
The National Cancer Institute (NCI) conducted an extensive analysis of the 1977–1978 NFCS data to develop more accurate estimates of water intake (Ershow and Cantor, 1989). Three types of water were considered:
-
water intrinsic to food,
-
tapwater added to food during preparation in the home, and
-
tapwater consumed by itself.
Since total food moisture was not part of the NFCS data base, the NCI investigators calculated the intake of water from this source by applying the following formula:
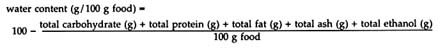
Data on tapwater intake were collected as part of the NFCS survey. When the amount of water added to foods was not clear in the USDA Food Code Description Files, the NCI investigators used standard dilutions
(e.g., for canned soups, frozen juices) or consulted cookbooks. The investigators acknowledged that their estimates of total water intake by nursing infants were low. In the absence of data on human milk consumption, they derived their estimates from other water sources. Tapwater intake estimates may also be low because ready-to-feed infant formula was assumed when the survey results did not specify the type of formula consumed. In fact, some of the infant formula not clearly identified may have been powder or concentrate to which tapwater had been added.
Dietary Sources of Water
The dietary sources of total water and tapwater reported by NCI are shown in Figure 5-2 (Ershow and Cantor, 1989). Relatively few beverage and food items contributed to total water and tapwater intake for most age groups. For infants less than 1 year old, formula provided 32.7% of total water intake, milk and milk drinks contributed 24.7%, and drinking water, 16.1%. For the 1- to 10-year age group, infant formula was no longer a factor, drinking water increased to 30.3%, and milk and milk products remained at levels similar to those for infant intake (25%). Of the tapwater intake by infants less than 1 year old, 69% was provided by drinking water and 11.9% by formula. For the 1- to 10-year age group, 64.8% was provided by drinking water, and 13.6% by fruit juices, tomato juice, and noncarbonated drinks—up from 4.5% for the infants.
Water Intake Estimates
As shown in Table 5-4, mean total water intake by infants during the first 6 months of life is, 1,014 ± 294g/day. Intake increases to 1,258 ± 322g/day before their first birthday. These estimates correspond to 189 ± 73.5 and 141.7 ± 43.0g/kg body weight (bw)/day, respectively. Mean tap water intakes for these age groups are 272 ± 247g/day (52.4 ± 53.2g/kg bw/day) and 328 ± 265g/day (36.2 ± 29.2g/kw bw/day).
There is a steady increase in both total water and tap water intake into adulthood and a gradual decrease after the age of 65 years. When viewed on a grams-per-kilogram-of-body-weight basis, however, the highest intakes are found for infants during the first 6 months of life (Figures 5-3 and 5-4). Daily total water intake decreases from 189 ± 73.5 g/kg bw during the first 6 months to 41.9 ± 15.6 g/kw bw for the 11- to 14-year age group (Table 5-4).
Males generally had higher mean intakes than females (p = 0.05) for all age groups over 1 year of age adjusting for race, region, season, body weight, urban residence, and age. As shown in Figures 5-5 and 5-6, these differences were relatively small for young children, and consumption
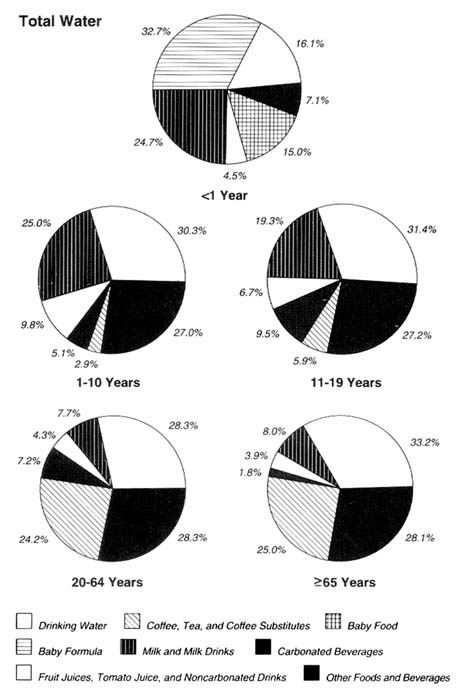
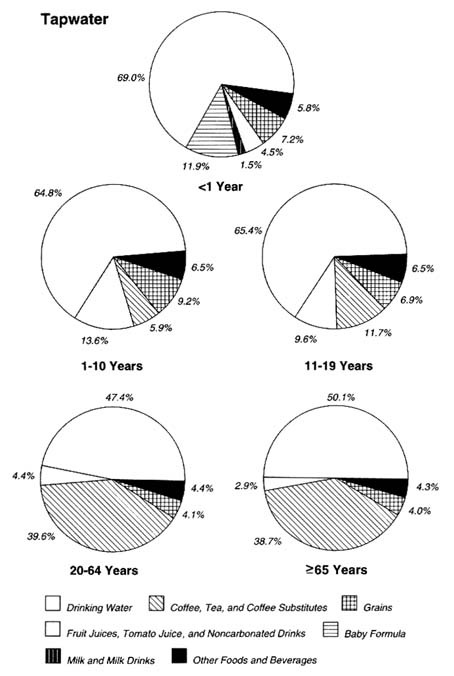
TABLE 5-4 Mean Intake of Total Water and Tap Water by All Ages, Both Sexes, All Regions, and All Seasons
|
|
Total Water |
|
Tap Water |
|
|
Age group, year |
g/day ± SD |
g/kg bw/day ± SD |
g/day ± SD |
g/kg bw/day ± SD |
|
<0.5 |
1,014 ± 294 |
189.0 ± 73.5 |
272 ± 247 |
52.4 ± 53.2 |
|
0.5–0.9 |
1,258 ± 322 |
141.7 ± 43.0 |
328 ± 265 |
36.2 ± 29.2 |
|
1–3 |
1,356 ± 450 |
99.7 ± 35.7 |
646 ± 390 |
46.8 ± 28.1 |
|
4–6 |
1,520 ± 482 |
77.7 ± 27.6 |
742 ± 406 |
37.9 ± 21.8 |
|
7–10 |
1,711 ± 508 |
58.7 ± 20.9 |
787 ± 417 |
26.9 ± 15.3 |
|
11–14 |
1,918 ± 651 |
41.9 ± 15.6 |
925 ± 521 |
20.2 ± 11.6 |
|
15–19 |
2,049 ± 768 |
33.8 ± 12.3 |
999 ± 593 |
16.4 ± 9.6 |
|
20–44 |
2,171 ± 839 |
32.1 ± 12.5 |
1,255 ± 709 |
18.6 ± 10.7 |
|
45–64 |
2,359 ± 826 |
33.5 ± 12.5 |
1,546 ± 723 |
22.0 ± 10.8 |
|
65–74 |
2,249 ± 739 |
32.9 ± 11.5 |
1,500 ± 660 |
21.9 ± 9.9 |
|
>75 |
2,103 ± 697 |
32.9 ± 11.4 |
1,381 ± 600 |
21.6 ± 9.5 |
|
All Ages |
2,072 ± 803 |
41.8 ± 27.4 |
1,193 ± 702 |
22.6 ± 15.9 |
|
SOURCE: Based on data from Ershow and Cantor, 1989, pp. 42, 51, 65, and 74. |
||||
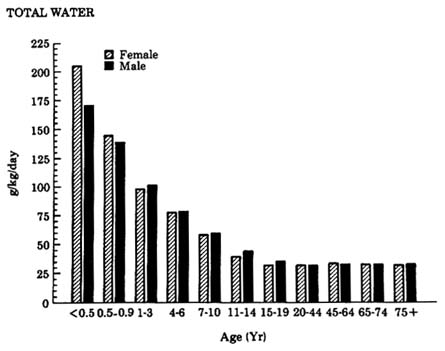
FIGURE 5-3 Mean daily intake of total water per unit of body weight by age group and sex.
SOURCE: Ershow and Cantor, 1989, p. 26.
figures for female infants were actually higher than those for males of the same age.
Variations between regions and smaller seasonal differences were observed for all age groups (Figures 5-7 and 5-8). For infants, total water and tap water consumption were lowest in the northeast, tap water was highest in the west, and total water was highest in the midwest. Intake of both tap water and total water was highest in the summer in all regions for all age groups.
Water consumption data reported by Gerber showed a wide variation among the various age groups. In general, however, the data supported those reported by NCI and described above (Gerber Products, personal commun., 1992).
QUANTIFICATION OF CONSUMPTION DATA
The 1977–1978 NFCS results were reported as daily consumption of individual foods. Gerber reported consumption data for foods as formulated and processed for feeding. Tolerance levels established by the EPA for pesticide residues in foods, however, are based on crop-based components
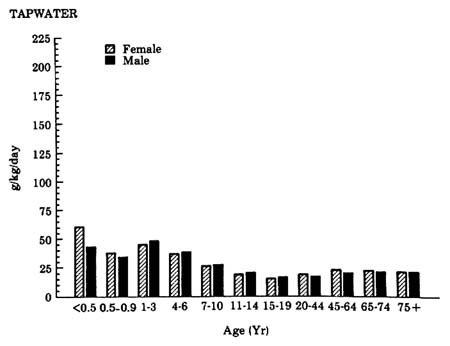
FIGURE 5-4 Mean daily intake of tap water per unit of body weight by age group and sex.
SOURCE: Ershow and Cantor, 1989, p. 26.
of the foods reported in the 1977–1978 NFCS. Therefore, to assess pesticide exposures and to compare those exposures with established reference doses, it is necessary to break down the foods consumed into raw agricultural commodities (RACs)—the components used by the regulatory agencies. For example, pizza is broken down into wheat flour, water, yeast, tomato paste, tomato sauce, cheese, and other ingredients and expressed in grams in order to match the form in which pesticide tolerances are reported in the Code of Federal Regulations (1986a,b). (RACs are discussed in more detail in Chapter 6.)
EPA developed and uses the Dietary Residue Evaluation System (DRES) to estimate dietary exposures of humans to pesticides through the diet. This system is based on pesticide residue concentrations found in RACs, which are sampled from harvested agricultural crops and analyzed at the farm gate. The residue estimates are then multiplied by the food consumption estimates to assess the extent of human exposure and to allow the development of new tolerance concentrations. DRES includes recipe files for each food tested. Furthermore, DRES may be used to estimate consumption of various foods in 22 different population groups
based on such characteristics as age, nursing or nonnursing status, and ethnic background from survey information available in the NFCS. The DRES method, formerly called the Tolerance Assessment System (TAS), and the use of RACs as derived by EPA from the NFCS to estimate the exposure of humans to pesticides have been described in detail in other publications (e.g., Research Triangle Institute, 1983; Saunders and Petersen, 1987).
Several problems are associated with this method of calculating food intake, however. The processing effects cannot be accurately considered because there is no compensation for the fractionation of food components (e.g., the stripping of soybean oil). Individual components of specialized foods cannot be identified when only the total of the components is presented. For example, the term milk solids applies to fresh milk, milk in formulated foods, and milk in infant formula. This practice fails to compensate for ingredient selection and processing differences for specialized infant foods.
With these caveats in mind, the committee used these data to develop tables showing the predominant foods in the average U.S. diet and in the diets of various subgroups: nursing and nonnursing infants (<1 year old),
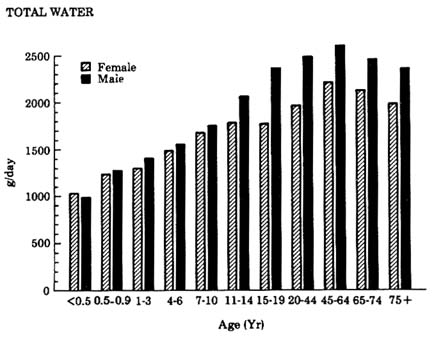
FIGURE 5-5 Mean daily intake of total water by age group and sex.
SOURCE: Ershow and Cantor, 1989, p. 24.
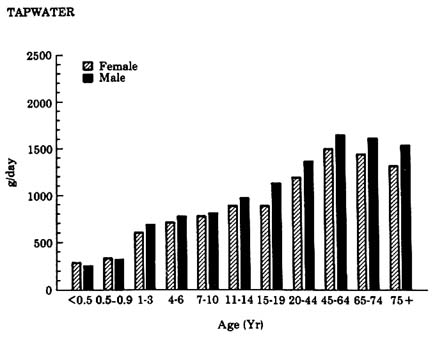
FIGURE 5-6 Mean daily intake of tap water given in grams by age group and sex.
SOURCE: Ershow and Cantor, 1989, p. 24.
children from 1 to 6 and 7 to 12 years old, teenagers from 13 to 19 years old, and adults over the age of 19. The result is a clear picture of the most commonly consumed foods in the diets of infants and children and how these differ from those consumed most frequently by adults, as discussed in the next section.
Because EPA presented intake data for milk as RACs (that is, as the dry constituents such as fat and nonfat milk solids and lactose), comparisons of intake to other foods consumed could not be reasonably made without making an adjustment for the water content of the milk. To accomplish this, the committee estimated the solid content of milk at 15% and its water content at 85% and adjusted the data for the dry constituents accordingly. In this way, percentages of the total diet for each of the age groups could be calculated to present a more representative approximation of their dietary patterns.
The 85% was derived from the DRES recipe files, which show that milk and infant formula are approximately 85% water, depending on the product. Other estimates are quite close. For example, Petersen and Associates (1992) reported the water content of milk-based baby formula as 87%, and of light cream, 74.1%. Clearly, the water component of milk
products consumed by infants and children is an important consideration in developing dietary comparisons.
AGE-RELATED DIFFERENCES IN DIETARY PATTERNS
Table 5-5 lists the 17 foods (expressed as RACs) that comprise more than 1% of the average U.S. diet, as reported in the 1977–1978 NFCS. Individual age categories were compared to the U.S. average and multiples determined. Only two age categories had multiples in excess of 2: nonnursing infants and 1- to 6-year-old children. Table 5-6 shows percentages for the foods comprising more than 1% of the average diets of various age groups. Table 5-7 presents the multiples of the intake of those foods compared with the U.S. average (e.g., 2.00 means twice the U.S. average; 5.25 means 5-and-a-quarter times the U.S. average). The information in these tables is also presented as RACs.
The numbers in these tables were derived from EPA intake data based on milligrams per kilograms of body weight and are presented as RACs consistent with regulatory practice. Water intake was not considered, except for the water component of milk products, as noted above.
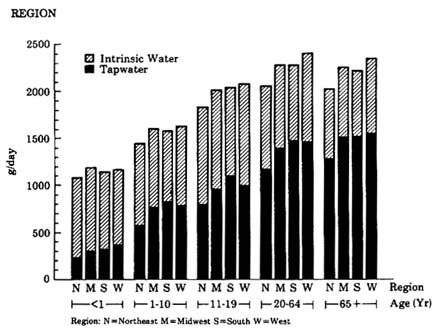
FIGURE 5-7 Mean daily total intake of water by source, age group, and region.
SOURCE: Ershow and Cantor, 1989, p. 27.
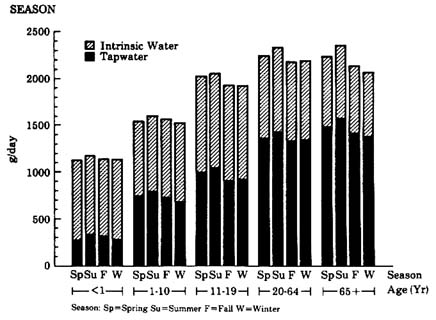
FIGURE 5-8 Mean daily total intake of water by source, age group, and season.
SOURCE: Ershow and Cantor, 1988 p. 27.
In the process of reviewing the data and developing the comparisons, the committee noted variances in dietary patterns across age categories, within age categories, within individuals, and over time. All these factors must be considered in estimating exposure to pesticide residues and assessing risk for infants and children. Clearly, the marked differences between children's diets and the diets of adults and their relationship to the U.S. average have implications for assessing patterns of dietary exposure to pesticides.
Milk in its entirety constitutes an extremely large portion of the U.S diet—not only for infants and children, but also for adults. This can be attributed to the relatively large quantities of milk contained in many of the foods consumed, e.g., formulated foods and baked goods, and its use as a diluent, e.g., for cereal.
Human milk is a dominant source of nutrition for nursing infants less than 3 months old and a substantial source for those less than 11 months. It is consumed exclusively by more than 60% of nursing infants until they reach 3 to 6 months of age. Data collected by Ross Laboratories in 1992 indicate that 53.3% of all mothers in the United States breastfed their
TABLE 5-5 The 17 Foods Comprising More than 1% of the Average U.S. Diet in 1977–1978 and the Age Class Consuming the Highest Multiple of That Average
TABLE 5-6 Foods Comprising More than 1% of the Average Diet of Age Groups Indicated
|
|
% of Average Diet of Age Group Indicated, 95th Percentile, Upper Limit |
|||||
|
|
Infants |
|
Age, years |
|
|
|
|
Foods Expressed as Raw Agricultural Commodity |
Nursing (n = 109) |
Nonnursing (n = 457) |
1-6 (n = 3,633) |
7-12 (n = 4,309) |
13-19 (n = 5,130) |
=20 (n = 16,801) |
|
Milk, nonfat solids |
28.4 |
44.2 |
30.4 |
28.5 |
28.6 |
18.2 |
|
Apple juice |
8.5 |
4.4 |
1.9 |
— |
— |
— |
|
Apple, fresh |
7.0 |
3.2 |
2.2 |
2.1 |
1.6 |
1.7 |
|
Orange juice |
4.5 |
3.2 |
5.7 |
4.6 |
4.2 |
4.4 |
|
Pears, fresh |
4.3 |
1.9 |
— |
— |
— |
— |
|
Milk, fat solids |
4.9 |
10.4 |
13.4 |
13.3 |
13.2 |
10.5 |
|
Peaches, fresh |
4.1 |
2.3 |
— |
— |
— |
— |
|
Carrots |
3.3 |
1.6 |
— |
— |
— |
— |
|
Beef, lean |
3.0 |
1.5 |
3.5 |
4.3 |
5.4 |
6.1 |
|
Milk sugar (lactose) |
2.8 |
3.4 |
— |
— |
— |
— |
|
Bananas, fresh |
2.7 |
1.1 |
1.3 |
— |
— |
— |
|
Rice, milled |
1.8 |
1.5 |
— |
— |
— |
— |
|
Peas, succulent, garden |
1.3 |
— |
— |
— |
— |
— |
|
Beans, succulent, green |
1.3 |
— |
— |
— |
— |
— |
|
Oats |
1.2 |
— |
— |
— |
— |
— |
TABLE 5-7 Foods Comprising More Than 1% of the Average Diets of Different Age Groups and Multiple of U.S. Average Consumption
|
|
Multiple of U.S. Average Consumption |
|
|
|
|
|
|
|
Infants |
|
Age, years |
|
|
|
|
Foods Expressed as Raw Agricultural Commodity |
Nursing (n = 109) |
Nonnursing (n = 457) |
1–6 (n = 3,663) |
7-12 (n = 4,309) |
13–19 (n = 5,130) |
=20 (n = 16,801) |
|
Milk, nonfat solids |
2.0 |
7.3 |
3.0 |
1.8 |
0.96 |
0.47 |
|
Apple juice |
14.9 |
16.7 |
4.8 |
— |
— |
— |
|
Apples, fresh |
6.3 |
6.9 |
2.8 |
1.7 |
0.76 |
0.58 |
|
Orange juice |
1.7 |
2.9 |
3.1 |
1.6 |
0.84 |
0.63 |
|
Pears, fresh |
14.4 |
15.0 |
— |
— |
— |
— |
|
Milk, fat solids |
7.3 |
3.6 |
2.8 |
1.8 |
1.00 |
0.57 |
|
Peaches, fresh |
7.7 |
10.6 |
— |
— |
— |
— |
|
Carrots |
7.9 |
9.1 |
— |
— |
— |
— |
|
Beef, lean |
1.1 |
1.3 |
1.8 |
1.4 |
1.01 |
0.81 |
|
Milk sugar (lactose) |
27.9 |
79.1 |
— |
— |
— |
— |
|
Bananas, fresh |
4.8 |
5.0 |
3.3 |
— |
— |
— |
|
Rice, milled |
4.7 |
8.7 |
— |
— |
— |
— |
|
Peas, succulent, garden |
3.1 |
— |
— |
— |
— |
— |
|
Beans, succulent, green |
2.6 |
— |
— |
— |
— |
— |
|
Oats |
5.9 |
— |
— |
— |
— |
— |
|
Soybean oil |
1.5 |
4.6 |
1.9 |
1.2 |
0.96 |
0.75 |
|
Coconut oil |
— |
49.8 |
— |
— |
— |
— |
|
Wheat flour |
— |
0.8 |
2.3 |
1.7 |
1.06 |
0.70 |
|
Cane sugar |
— |
— |
2.5 |
1.7 |
1.10 |
0.64 |
|
Potato, white, pulp |
— |
— |
2.1 |
1.6 |
1.09 |
0.73 |
|
Eggs, whole |
— |
— |
2.3 |
1.2 |
0.85 |
0.82 |
|
Chicken, with skin |
— |
— |
2.2 |
1.4 |
0.93 |
0.79 |
|
Tomatoes, whole |
— |
— |
1.7 |
1.3 |
0.93 |
0.88 |
|
Beet sugar |
— |
— |
2.5 |
1.7 |
1.10 |
0.64 |
|
Pork, lean |
— |
— |
1.8 |
1.3 |
0.98 |
0.84 |
|
Beef, fat |
— |
— |
1.8 |
1.4 |
1.02 |
0.82 |
|
Potato, white, whole |
— |
— |
1.8 |
1.2 |
0.88 |
0.89 |
|
Corn, sweet |
— |
— |
— |
1.8 |
0.99 |
0.67 |
|
Lettuce, head |
— |
— |
— |
— |
— |
1.07 |
|
Fish, fin, saltwater |
— |
— |
— |
— |
— |
0.89 |
|
Pork, fat |
— |
— |
— |
— |
— |
0.80 |
|
NOTE: No multiples are provided for foods comprising less than 1% of the diet of the age groups indicated. The multiples for fat and nonfat milk solids take into consideration their water content (see NOTE under Table 5-6). SOURCE: Based on data from the 1977–1978 Nationwide Food Consumption Survey. |
||||||
TABLE 5-8 Percentage of Mothers Breastfeeding Newborn Infants in the Hospitals and at 5 or 6 Months of Age in the United States in 1992, by Ethnic Background and Selected Demographic Variables
|
|
Total |
White |
Black |
Hispanica |
||||
|
Category |
Newborns |
5–6 mo Infants |
Newborns |
5–6 mo Infants |
Newborns |
5–6 mo Infants |
Newborns |
5–6 mo Infants |
|
All mothers |
53.3 |
19.7 |
59.2 |
22.6 |
25.8 |
7.3 |
51.8 |
16.1 |
|
Parity |
||||||||
|
Primiparous |
54.5 |
17.0 |
59.6 |
19.1 |
26.9 |
6.8 |
55.1 |
15.0 |
|
Multiparous |
52.3 |
22.0 |
58.8 |
25.9 |
24.9 |
7.6 |
49.1 |
17.0 |
|
Marital status |
||||||||
|
Married |
61.2 |
24.5 |
63.0 |
25.4 |
40.0 |
13.3 |
58.0 |
19.8 |
|
Unmarried |
31.4 |
7.5 |
41.6 |
10.0 |
19.3 |
4.6 |
41.4 |
10.0 |
|
Maternal age |
||||||||
|
<20 yr |
32.2 |
6.5 |
37.9 |
7.6 |
16.7 |
3.2 |
39.3 |
8.7 |
|
20–24 yr |
45.7 |
12.4 |
50.8 |
13.9 |
22.8 |
5.5 |
50.6 |
13.1 |
|
25–29 yr |
57.8 |
21.4 |
62.1 |
23.5 |
29.9 |
9.1 |
56.1 |
18.8 |
|
30–34 yr |
65.2 |
29.3 |
69.3 |
32.0 |
37.0 |
12.6 |
59.0 |
22.7 |
|
>35 yr |
66.7 |
35.1 |
71.6 |
39.1 |
37.8 |
14.3 |
57.5 |
24.3 |
|
Maternal education |
||||||||
|
No college |
42.6 |
13.2 |
48.2 |
15.2 |
20.3 |
5.3 |
45.9 |
13.4 |
|
Collegeb |
70.2 |
29.8 |
74.0 |
32.5 |
41.8 |
12.9 |
67.0 |
23.3 |
TABLE 5-9 Percentages of Breastfeeding Respondents in the 1988 National Maternal and Infant Health Survey
|
|
Respondents Still Breastfeeding, % |
|
|
Infant Age, months |
Low-Income Womena |
U.S. Population |
|
0 |
39.0 |
52.4 |
|
1 |
25.8 |
37.1 |
|
2 |
19.8 |
29.1 |
|
3 |
14.7 |
22.9 |
|
4 |
12.0 |
18.7 |
|
5 |
10.1 |
16.2 |
|
6 |
7.2 |
11.8 |
|
7 |
6.1 |
9.8 |
|
8 |
4.7 |
7.7 |
|
9 |
3.8 |
5.8 |
|
10 |
2.9 |
4.3 |
|
11 |
2.4 |
3.2 |
|
12 |
1.0 |
1.5 |
|
a ''In this table, low income is defined as total income less than or equal to 185% of the federal poverty line. SOURCE: Unpublished data from the 1988 National Maternal and Infant Health Survey. Provided by J. Tognetti, Office of Analysis and Evaluation, Food and Nutrition Service, U.S. Department of Agriculture. |
||
newborn children but only 19.7% of them continued the practice when their infants were 5 to 6 months of age (Table 5-8). The highest percentages were noted for white mothers (59.2% for newborns; 22.6% at 5 to 6 months) and Hispanic mothers (51.8% for newborns; 16.1% at 5 to 6 months), in contrast to black mothers (25.8% for newborns; 7.3% at 5 to 6 months). There were also wide differences that correlated with socioeconomic status across all ethnic groups. For all mothers in families with annual incomes of $25,000 or more, breastfeeding rates were 67.1% for newborns and 27.4% for 5- to 6-month-old infants. At incomes less than $10,000, the rates were 33.3% and 8.5%, respectively. Data from the 1988 National Maternal and Infant Health Survey show similar trends: 52.4% of new mothers in the United States were breastfeeding their newborns and that percentage dropped to 11.8% at 6 months and to 1.5% at 1 year (Table 5-9). They also show that breastfeeding rates among low-income women are lower than the national average.
A number of studies demonstrate that the volume of milk intake among healthy, exclusively breastfeed infants also ranges widely (Figure 5-9).
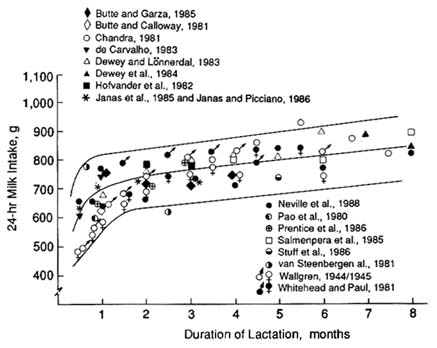
FIGURE 5-9. Milk intakes during established lactation. The lines represent the smoothed mean ± standard deviation. The points represent average intakes obtained in 16 studies that included test weighing, validated exclusive breastfeeding, three or more subjects, and monthly reports on milk transfer.
SOURCE: Neville et al., 1988, with permission.
After the first 4 to 5 months, the variance is even greater. For infants who were breast-fed for at least 12 months and given solid foods beginning at 4 to 7 months, milk intake averaged 769 g/day (range, 335 to 1,144 g/day) at 6 months (n = 56), 637 g/day (range, 205 to 1,185 g/day) at 9 months (n = 46), and 445 g/day (range, 27 to 1,154 g/day) at 12 months (n = 40) (Dewey et al., 1990; K. Dewey, personal commun., 1992)
Milk intake is most often determined by weighing the infant before and after feeding. This method leads to underestimations of intake ranging from approximately 1 to 5% (Brown et al., 1982; Woolridge et al., 1985) because of water loss through evaporation from the infant between weighings. Newer techniques based on stable isotopes have been developed to measure breast milk intake (Coward et al., 1982; Butte et al., 1988), but few data have been generated by this method to date (e.g.,
Orr-Ewing, 1986; Butte et al., 1992). For a more detailed review of these data, see Nutrition During Lactation (NRC, 1991).
Because the volume of human milk consumption varies widely, the estimates of supplementary food consumption shown in Table 5-6 are conservative, i.e., they are higher than the amounts likely to be consumed by these infants. The 1988 National Maternal and Infant Health Survey contained a number of questions that promise to shed more light on infant food consumption during the first 6 months of life. Unfortunately, the analysis could not be made available to the committee in time for inclusion in this report.
As demonstrated by the preceding discussion and accompanying tables, use of available intake data to assess dietary exposures of nursing infants is complex. Human milk is the major food and source of essential nutrients consumed by these infants during their first year of life, but a vast range of variables must be considered: the age at which supplementary foods are introduced, the selection of foods given to them, and the volume of human milk consumed. Factors greatly affecting the feeding patterns of this group include economic status, ethnic background, region, and the age, marital status, educational level, parity, and employment of the mother.
Infant formula is the sole source of food for nonnursing infants for the first 3 months of life. Milk or milk-based food remains the predominant source of energy and nutrients for all infants throughout their first year of life. Averaged over the first 12 months, nonfat and fat milk solids provide 44.2% and 10.4%, respectively, of their diet. These figures were derived from DRES conversion of formula into its component parts: fat and nonfat milk solids, milk sugar, coconut oil, and soybean oil. Coconut oil represents only 1.4% of the average diet of nonnursing infants, but the consumption is almost 50 times greater than that of the national average (Table 5-6).
The diet of infants is gradually supplemented with specially prepared, predominantly processed foods produced by a small number of manufacturers. When presented as RACs, fruit and fruit juice constitute the highest proportion of the early supplemental foods, accounting for an estimated 16.1% of the diet, averaged over the first year of life. These are led by apple juice (4.4% as RAC) and fresh apples (3.2% as RAC).
Caloric consumption by infants per unit of body weight is higher than that for adults—approximately 2.5 times higher for the very young infant (NRC, 1989). Therefore, comparison of the consumption data for infants and adults on the basis of grams per kilogram of body weight results in an elevated value for infants.
The diets of infants and children are less diverse than those of the general population. The 1977–1978 NFCS reports intakes of
375 foods (reported as RACs), for the entire sample of more than 30,000 people. In contrast, 148 RACs were reported for the 457 nonnursing infants sampled, indicating a relative lack of diversity in the diets of this subgroup. It is therefore important to monitor both the percentage of total diet and the multiple of the national average consumption for each food and for each age group to identify areas relative to dietary exposure to pesticides.
Several factors must be considered when evaluating the consumption data on infants. For example, caution must be exercised not to overestimate introduced foods to avoid estimates of intake that greatly exceed the consumption capacity of the infant. Furthermore, changes resulting from various processing techniques, especially fractionation (e.g., for soybean oil), must not be overlooked. Other influences include many of those noted earlier for nursing infants, e.g., region, socioeconomic status, and other variables.
Milk also predominates in the diet of 1- to 6-year-ld children, as shown by the values for nonfat and fat milk solids (30.4% and 13.4%, respectively). Orange juice, fresh apples, apple juice, and bananas together constitute 11.1% of their diet. The data also show that the diets of this group have become more diverse to include wheat, beef, sugar, eggs, and chicken, and more varieties of vegetables are consumed. The number of foods eaten above the U.S. average, and the multiples of their excess, have declined. This is most likely attributable not only to the rapid increase in dietary diversity after the age of 1 year, but also to a diminishing effect of the body weight conversion factor as average childhood weights approach average adult weights.
The diets of children from 7 to 12 years old have attained a greater level of diversity and show changes in proportion. Wheat flour, beef, and potatoes have reached higher percentages of the diet, whereas the intake levels of some foods (e.g., milk constituents and orange juice) have declined slightly. Many of the foods that constitute the greatest percentages of the diet are the same as those for 1to 6-year-old children, although there are differences in the rankings of the percentages of the total diet of those age groups. As shown by the multiples of the U.S. average consumption, the intakes by 7- to 12-year-old children are approaching those of the overall population.
Among teenagers from 13 to 19 years old, wheat flour, beef, potatoes, and eggs continue their ascendance in dietary predominance over fruits and vegetables with the exceptions of orange juice, apples, and tomatoes. Orange juice ranks fifth among the foods that constitute the highest percentages of the diet consumed by this age group. The multiples of the U.S. average consumption have declined, and for 10 food items, are below the national average.
There is a dramatic drop in nonfat milk solids for adults 20 years old and older (from 28.6% of the total diet of teenagers to 18.2% for adults). All the foods comprising more than 1% of the diet of teenagers appear again for adults along with lettuce, fin fish, and fat pork. All food items listed except lettuce are consumed in amounts less than the national average, showing the greater diversity of the adult diet.
ISSUES RELATED TO THE EVALUATION OF FOOD MONITORING DATA
Differences in Consumption Among Age Groups
As demonstrated by the NFCS data (Tables 5-5, 5-6 and 5-7), infant and early childhood consumption patterns differ greatly from those of adults and the population as a whole. The most dominant factor that emerges from interpretive evaluation of intake data remains as milk in some form. The proportion of the balance of the diet represented by fruits, by liquids, especially fruit juices and by vegetables is much higher for infants than for older children or adults. For several fruit juices, this relationship is maintained even when commodity intake is not adjusted by body weight. Thus, use of the U.S. average intake as a basis for estimating pesticide exposures of infants and children may result in underestimates of pesticide residues in their diet.
As noted earlier in this chapter, water intake is considerably higher for infants than for other age categories. The sources of this high intake include foods such as concentrated juices, cereals, and infant formula that are mixed with water prior to consumption. Therefore, water must be a major consideration in estimating of the risk from dietary exposure to pesticides for infants and children.
The Gerber data show several changes in the diet over the first year of life that have potentially important implications for the exposure of infants to pesticides (Johnson et al., 1981). There is a gradual substitution of cow's milk and apple juice for human milk and infant formula. Soybean oil and coconut oil consumption decreases, reflecting the declining intake of infant formula. Intakes of fruits and vegetables increase steadily, and the diet in general begins to diversify.
Because of the young ages of the study population, the 90th percentile of the Gerber sample often shows consumption of such foods as peaches, pears, carrots, and oats for only a few individuals. As the percentage of eaters increases as the children grow older, the 90th percentile commonly exceeds the mean of eaters only and would therefore provide a higher degree of protection if used as the basis of risk projections and tolerance setting.
Differences in Consumption within Age Groups
Variations in consumption patterns within age groups may be considerable. Consider, for example, the great differences among the diets of vegetarians, certain ethnic and religious groups, individuals with medically restricted diets, and populations in different regions of the country. It is quite probable that subgroups within the various age categories consume both average daily and daily high levels of food considerably above the NFCS values, but an analysis of these variations is not possible with current survey data.
For chronic risk assessment, EPA has traditionally relied on mean consumption estimates for large groups such as the entire U.S. population or children between the ages of 1 and 6 years or 7 and 12 years. The 90th percentile has been avoided, because no individual consumes the 90th percentile of all foods regulated by the FDA and USDA. Some individuals may, however, consistently consume a few foods at the 90th percentile for their age group. Obviously, these clusters would vary among individuals and eventually resolve to the mean for the age group.
To determine the significance of this observation, the committee identified the 25 foods most consumed by 170 1-year-old children in the 1985–1986 CSFII. Results from DRES calculations based on CSFII results illustrate that mean intake data clearly do not reflect the actual intakes of some foods by some subjects and therefore that their use can lead to underestimates of pesticide exposure. For example, 88 of the children (52%) consumed 6 to 10 foods over the mean, and only 5 (2.9%) consumed no foods over the mean. The many foods over the mean. The many foods consumed at levels lower than the mean constituted a minor portion of the diet.
These considerations regarding consumption are used as the basis for the committee's discussions in the remaining chapters of this report.
CONCLUSIONS AND RECOMMENDATIONS
The committee reached its conclusions and recommendations for this chapter after an extensive review of information available on food and water consumption. All major sources of data on food consumption by infants and children compiled by government agencies and the food industry were considered and evaluated. Information on water intake was derived from an extensive evaluation of food survey information conducted for the National Cancer Institute. The committee weighed the strengths and the limitations of each source of information in order to identify the most acceptable data to be used in conjunction with pesticide residue information to determine exposure, as discussed in Chapters 6 and 7.
Information on foods as consumed was broken down into constituents of foods by the same process currently used by government to establish regulatory policy. This conversion process—the Dietary Residue Evaluation System (DRES)—expresses foods in terms of individual raw agricultural commodities (RACs).
Potential dietary exposures to pesticides are related to food and water intake. To identify the differences in exposures of infants and children compared with adults, intake data were grouped into various age categories. Consumption of water, human milk, and processed foods were considered separately in order to assess their respective contributions to dietary pesticide exposure for infants and young children.
Conclusions
-
Food consumption patterns for infants and children differ markedly from those of adults.
-
Children consume more calories relative to body weight than do adults.
-
Dietary diversity increases with age: infants and young children consume fewer distinct foods than do adults.
-
On a body weight basis, infants and young children consume notably more of certain foods than do adults.
-
-
Water, as drinking water and as a component of food, is not adequately considered in most consumption surveys.
-
Examination of intake data by age categories clearly illustrates the differences in consumption patterns that must be considered when estimating exposure of infants and children to pesticides; however, current information on food and water intake by age category is insufficient to produce credible exposure estimates.
-
Processed foods are predominant in the diets of younger age groups.
Recommendations
Knowledge of food consumption is an important consideration in assessing the risk to infants and children from dietary exposures to pesticides. Therefore, more focused, direct, comprehensive, and contemporary dietary information is required for infants and children. Because of the myriad and rapid changes in diet that occur during the developmental stages of life, intake data must be precisely divided into age subdivisions and the sample must be large enough to produce meaningful results.
-
A simple, uniform method needs to be developed for conversion of
-
a product as consumed to its components in terms of raw agricultural commodities.
-
Those foods most frequently consumed by young children and infants need to be identified and quantified more specifically. Reporting should be specific and discrete foods clearly identified.
-
Water intake and food intake should both receive full consideration in estimating dietary exposure and assessing risk, especially for infants and young children.
-
Because of the changing nature of children's diets during growth, food consumption surveys should include adequate sample sizes of children aged 0 to 12 months, 13 to 24 months, 25 to 36 months, 37 to 48 months, 49 to 60 months, 5 to 10 years, and 11 to 18 years.
-
Intake data and survey methodology need to be standardized to make them more useful in a variety of applications, including estimating exposure and assessing risk.
-
Food consumption surveys should be coordinated among the involved organizations and performed on a continuing basis in order to examine trends of food and water consumption, especially by infants and children.
REFERENCES
Acheson, K.J., I.T. Campbell, O.G. Edholm, D.S. Miller, and M.J. Stock. 1980. The measurement of food and energy intake in man: An evaluation of some techniques. Am. J. Clin. Nutr. 33:1147–1154.
Acosta, P.B., C. Trahms, N.S. Wellman, and M. Williamson. 1983.Phenylalanine intakes of 1- to 6-year-old children with phenylketonuria undergoing therapy. Am. J. Clin. Nutr. 38:694–700.
Anderson, G.H., and L.M. Blendis. 1981. Plasma neutral amino acid ratios in normal man and in patients with hepatic encephalopathy: Correlations with self-selected protein and energy consumption. Am. J. Clin. Nutr. 34:377–385.
Axelson, J.M., and M.M. Csernus. 1983. Reliability and validity of a food frequency checklist. J. Am. Diet. Assoc. 83:152–155.
Backstrom, C.H., and G.D. Hursh-Cesar. 1981. Survey Research, 2nd ed. New York: Macmillan.
Basiotis, P.P., S.O. Welsh, F.J. Cronin, J.L. Kelsay, and W. Mertz. 1987. Number of days of food intake records required to estimate individual and group nutrient intakes with defined confidence. J. Nutr. 117:1638–1641.
Beaton, G.H., J. Milner, P. Corey, V. McGuire, M. Cousins, E. Stewart, M. de Ramos, D. Hewitt, P.V. Grambsch, N. Kassim, and J.A. Little. 1979. Sources of variance in 24-hour dietary recall data: Implications for nutrition study design and interpretation. Am. J. Clin. Nutr. 32:2546–2549.
Beaton, G.H., J. Milner, V. McGuire, T.E. Feather, and J.A. Little. 1983. Source of variance in 24-hour dietary recall data: Implications for nutrition study design and interpretation. Carbohydrate sources, vitamins, and minerals. Am. J. Clin. Nutr. 37:986–995.
Block, G. 1982. A review of validations of dietary assessment methods. Am. J. Epidemiol. 115:492–505.
Block, G., A.M. Hartman, C.M. Dresser, M.D. Carroll, J. Gannon, and L. Gardner. 1986. A data-based approach to diet questionnaire design and testing. Am. J. Epidemiol. 124:453–469.
Brown, K.H., R.E. Black, A.D. Robertson, N.A. Akhtar, G. Ahmed, and S. Becker. 1982. Clinical and field studies of human lactation: Methodological considerations. Am. J. Clin. Nutr. 35:745–756.
Burk, M.C., and E.M. Pao. 1976. Methodology for Large-Scale Surveys of Household and Individual Diets. HERR No. 40. Washington, D.C.: U.S. Department of Agriculture.
Butte, N.F., W.W. Wong, B.W. Patterson, C. Garza, and P.D. Klein. 1988. Human-milk intake measured by administration of deuterium oxide to the mother: A comparison with the test-weighing technique. Am. J. Clin. Nutr. 47:815–821.
Butte, N.F., S. Villalpando, W.W. Wong, S. Flores-Huerta, M.J. Hernandez-Beltran, E.O. Smith, and C. Garza. 1992. Human milk intake and growth faltering of rural Mesoamerindian infants. Am. J. Clin. Nutr. 55:1109–1116.
Byers, T., J. Marshall, E. Antony, R. Fiedler, and M. Zielezny. 1987. The reliability of dietary history from the distant past. Am. J. Epidemiol. 125:999–1011.
Chu, S.Y., L. N. Kolonel, J.H. Hankin, and J. Lee. 1984. A comparison of frequency and quantitative dietary methods for epidemiologic studies of diet and disease. Am. J. Epidemiol. 119:323–334.
Code of Federal Regulations (CFR). 1986a. Tolerances and Exemptions from Tolerances for Pesticide Chemicals in or on Raw Agricultural Commodities. 40 CFR 1, Part 180.
Code of Federal Regulations (CFR). 1986b. Tolerances for Pesticides in Food Administered by EPA. 21 CFR 1, Part 193.
Coward, W.A., T.J. Cole, H. Guber, S.B. Roberts, and I. Fleet. 1982. Water turnover and measurement of milk intake. Pfleugers. Arch. 393:344–347.
Dewey, K.G., M.J. Heinig, L.A. Nommsen, and B. Lönnerdal. 1990. Low energy intakes and growth velocities of breast-fed infants: Are there functional consequences? Pp. 35–44 in Activity, Energy Expenditure, and Energy Requirements of Infants and Children, B. Schürch and N. Scrimshaw, eds., Lausanne, Switzerland: International Dietary Energy Consulting Group-Nestlé Foundation.
DHHS (Department of Health and Human Services). 1983. Dietary Intake Source Data: United States 1976–80. DHHS Pub. No. (PHS)83-1681. National Center for Health Statistics. Washington, D.C.: U.S. Government Printing Office. 483 pp.
Dwyer, J.T. 1988. Assessment of dietary intake. Pp. 887–905 in Modern Nutrition in Health and Disease, 7th ed., M.E. Shils and V.R. Young, eds. Philadelphia: Lea and Febiger.
Elahi, V.K., D. Elahi, R Andres, J.D. Tobin, M.G. Butler, and A.H. Norris. 1983. A longitudinal study of nutritional intake in men. J. Gerontol. 38:162–180.
Ershow, A.B., and K.P Cantor. 1989. Total Water and Tapwater Intake in the United States: Population-Based Estimates of Quantities and Sources . Bethesda, Md.: Life Sciences Research Office, Federation of American Societies for Experimental Biology.
Frank, G.C., A.W. Voors, P.E. Schilling, and G.S. Berenson. 1977. Dietary studies of rural school children in a cardiovascular survey. J. Am. Diet. Assoc. 71:31–35.
Freudenheim, J.L., N.E. Johnson, and R.L. Wardrop. 1987. Misclassification of nutrient intake of individuals and groups using one-, two-, three-, and seven-day food records. Am. J. Epidemiol. 126:703–713.
Fuller, W.A. 1991. I. Regression estimation for sample survey data. In Regression Estimation for the 1987–1988 Nationwide Food Consumption Survey. Washington, D.C.: U.S. Department of Agriculture.
Fuller, W.A., M.M. Loughin, and H. Baker. 1991. II. Application to the Nationwide Food Consumption Survey. In Regression Estimation for the 1987–1988 Nationwide Food Consumption Survey. Washington, D.C.: U.S. Department of Agriculture.
Futrell, M.F., L.T. Kilgore, and F. Windham. 1971. Nutritional status of Negro preschool children in Mississippi: Evaluation of HOP index. J. Am. Diet. Assoc. 59:218–223.
GAO (General Accounting Office). 1991. Nutrition Monitoring: Mismanagement of Nutrition Survey Has Resulted in Questionable Data . (GAO/RCED-91-117) Washington, D.C.: U.S. General Accounting Office.
Gersovitz, M., J.P. Madden, and H. Smiciklas-Wright. 1978. Validity of the 24-hour-dietary recall and seven-day record for group comparisons. J. Am. Diet. Assoc. 73:48–55.
Hampe, E.C., Jr., and M. Wittenberg. 1964. The Lifeline of America: Development of the Food Industry. New York: McGraw-Hill.
Jain, M., G.R. Howe, K.G. Johnson, and A.B. Miller. 1980. Evaluation of a dietary history questionnaire for epidemiologic studies. Am. J. Epidemiol. 111:212–219.
Johnson, G.H., G.A. Purvis, and R.D. Wallace. 1981. What nutrients do our infants really get? Nutr. Today 16:4–10, 23—27.
Kim, W.W., W. Mertz, J.T. Judd, M.W. Marshall, J.L. Kelsay, and E.S. Prather. 1984. Effect of making duplicate food collections on nutrient intakes calculated from diet records. Am. J. Clin. Nutr. 40:1333–1337.
Krall, E.A., and J.T. Dwyer. 1987. Validity of a food frequency questionnaire and a food diary in a short-term recall situation. J. Am. Diet. Assoc. 87:1374–1377.
Krantzler, N.J., B.J. Mullen, H.G. Schutz, L.E. Grivetti, C.A. Holden, and H.L. Meiselman. 1982. Validity of telephoned diet recalls and records for assessment of individual food intake. Am. J. Clin. Nutr. 36:1234–1242.
Madden, J.P., S.J. Goodman, and H.A. Guthrie. 1976. Validity of the 24 hr. recall: Analysis of data obtained from elderly subjects. J. Am. Diet. Assoc. 68:143–147.
Marr, J.W., and J.A. Heady. 1986. Within- and between-person variation in dietary surveys: Number of days needed classify individuals. Hum. Nutr. Appl. Nutr. 40:347–364.
McGee, D., G. Rhoads, J. Hankin, K. Yano, and J. Tillotson. 1982. Within-person variability of nutrient intake in a group of Hawaiian men of Japanese ancestry. Am. J. Clin. Nutr. 36:657–663.
Neville, M.C., R. Keller, J. Seacat, V. Lutes, M. Neifert, C. Casey, J. Allen, and P. Archer. 1988. Studies in human lactation. Milk volumes in lactating women during the onset lactation and full lactation. Am. J. Clin. Nutr. 48:1375–1386.
NRC (National Research Council). 1986. Nutrient Adequacy: Assessment Using Food Consumption Surveys. Washington, D.C.: National Academy Press.
NRC (National Research Council). 1989. Recommended Dietary Allowances: 10th ed. Washington, D.C.: National Academy Press.
NRC (National Research Council). 1991. Nutrition During Lactation. Washington, D.C.: National Academy Press.
Nusser, S.M., A.L. Carriquiry, and W.A. Fuller. 1991. A semiparametric transformation approach to estimating usual daily intake distributions. Unpublished.
Orr-Ewing, A.K., P.F. Heywood, and W.A. Coward. 1986. Longitudinal measurements of breast milk output by a 2H2O tracer technique in rural Papua New Guinean women. Hum. Nutr. Clin. Nutr. 40:451–467.
Patterson, L. 1971. Dietary intake and physical development of Phoenix area children. J. Am. Diet. Assoc. 59:106–110.
Petersen and Associates, Inc. 1992. Background: Derivation of Water Consumption Estimates Used by the Tolerance Assessment System. Bethesda, Md.: Petersen and Associates.
Pietinen, P., A.M. Hartman, E. Haapa. L. Rasanen, J. Haapakoski, J. Palmgren, D. Albanes, J. Virtamo, and J.K. Huttunen. 1988. Reproductibility and validity of dietary assessment instruments. II. A qualitative food frequency questionnaire. Am. J. Epidemiol. 128:667–676.
Posner, B.M., C.L. Borman, J.L. Morgan, W.S. Borden, and J.C. Ohls. 1982. The validity of a telephone-administered 24-hour dietary recall methodology. Am. J. Clin. Nutr. 36:546–553.
Purvis, G.A. 1973. What nutrients do our infants really get? Nutr. Today 8:28–34.
Purvis, G.A., and S.J. Bartholmey. 1988. Infant feeding practices: Commercially prepared baby foods. Pp. 399–417 in Nutrition During Infancy, R.C. Tsang and B.L. Nichols, eds. Philadelphia: Hanley & Belfus .
Research Triangle Institute. 1983. Interim Report Number 1: The Construction of a Raw Agricultural Commodity Consumption Data Base. RTI Project No. 252U-2123-7. Research Triangle Park, N.C.: Research Triangle Institute.
Russell-Briefel, R., A.W. Caggiula, and L.H. Kuller. 1985. A comparison of three dietary methods for estimating vitamin A intake. Am. J. Epidemiol. 122:628–636.
Sampson, L. 1985. Food frequency questionnaire as a research instrument. Clin. Nutr. 4:171–178.
Saunders, D.S., and B.J. Petersen. 1987. An Introduction to the Tolerance Assessment System. Hazard Evaluation Division, Office of Pesticide Programs. Washington, D.C.: U.S. Environmental Protection Agency.
Schnakenberg, D.D., T.M. Hill, M.J. Kretsch, and B.S. Morris. 1981. Dietary-interview technique to assess food consumption patterns of individual military personnel. Pp. 180–197 in Assessing Changing Food Consumption Patterns, Committee on Food Consumption Patterns, National Research Council. Washington, D.C.: National Academy Press.
Sempos, C.T., N.E. Johnson, E.L. Smith, and C. Gilligan. 1984. A two-year dietary survey of middle-aged women: Repeated dietary records as a measure of usual intake. J. Am. Diet. Assoc. 84:1008–1013.
Sorenson, A.W., B.M. Calkins, M.A. Connolly, and E. Diamond. 1985. Comparison of nutrient intake determined by four dietary intake instruments. J. Nutr. Educ. 17:92–99.
Stamler, J. 1979. Population studies. Pp. 25–88 in Nutrition, Lipids, and Coronary Heart Disease, R.I. Levy, B.M. Rifkind, B.H. Dennis, and N. Ernst, eds. New York: Raven Press.
Todd, K.S., M. Hudes, and D.H. Calloway. 1983. Food intake measurement: Problems and approaches. Am. J. Clin. Nutr. 37:139–146.
USDA (U.S. Department of Agriculture). 1983. Nationwide Food Consumption Survey. Food Intakes: Individuals in 48 States, Year 1977–78. Report No. I-1. Hyattsville, Md.: Consumer Nutrition Division, Human Nutrition Information Service.
USDA (U.S. Department of Agriculture). 1985. Nationwide Food Consumption Survey. Continuing Survey of Food Intakes of Individuals: Women 19–50 Years and Their Children 1–5 Years, 1 Day, 1985. Report No. 85-1. Hyattsville, Md.: Nutrition Monitoring Division, Human Nutrition Information Service.
USDA (U.S. Department of Agriculture). 1986a. Nationwide Food Consumption Survey. Continuing Survey of Food Intakes of Individuals: Low-Income Women 19–50 Years and Their Children 1–5 Years, 1 Day, 1985. Report No. 85-2. Hyattsville, Md.: Nutrition Monitoring Division, Human Nutrition Information Service.
USDA (U.S. Department of Agriculture). 1986b. Nationwide Food Consumption Survey. Continuing Survey of Food Intakes of Individuals: Men 19–50 Years, 1 Day, 1985. Report No. 85-3. Hyattsville, Md.: Nutrition Monitoring Division, Human Nutrition Information Service.
USDA (U.S. Department of Agriculture). 1987a. Nationwide Food Consumption Survey. Continuing Survey of Food Intakes of Individuals: Low-Income Women 19–50 Years and Their Children 1–5 Years, 1 Day, 1986. Report No. 86-2. Hyattsville, Md.: Nutrition Monitoring Division, Human Nutrition Information Service.
USDA (U.S. Department of Agriculture). 1987b. Nationwide Food Consumption Survey. Continuing Survey of Food Intakes of Individuals: Women 19–50 Years and Their children 1–5 Years, 1 Day, 1986. Report No, 86-1. Hyattsville, Md.: Nutrition Monitoring Division, Human Nutrition Information Service.
USDA (U.S. Department of Agriculture). 1987c. Nationwide Food Consumption Survey. Continuing Survey of Food Intakes of Individuals: Women 19–50 Years and Their Children 1–5 Years, 4 Days, 1985. Report No. 85-4. Hyattsville, Md.: Nutrition Monitoring Division, Human Nutrition Information Service.
USDA (U.S. Department of Agriculture). 1988. Nationwide Food Consumption Survey. Continuing Survey of Food Intakes of Individuals: Low-Income Women 19–50 Years and Their Children 1–5 Years, 4 Days, 1985. Report No. 85-5. Hyattsville, Md.: Nutrition Monitoring Division, Human Nutrition Information Service.
Willett, W.C., L. Sampson, M.J. Stampfer, B. Rosner, C. Bain, J. Witschi, C.H. Hennekens, and F.E. Speizer. 1985. Reproducibility and validity of a semiquantified food frequency questionnaire. Am. J. Epidemiol. 122:51–65.
Wilson, L.B., and B.B. Rothschild. 1987. Results of an Exploratory study of longitudinal measures of individual food intake. Pp. 9–19 in Research on Survey methodology: Proceedings of a Symposium. USDA Admin. Rep. No. 382. Washington, D.C.: U.S. Department of Agriculture.
Woolridge, M.W., N. Butte, K.G. Dewey, A.M. Ferris, C. Garza, and R.P. Keller. 1985. Methods for the measurement of milk volume intake of the breastfeed infant. Pp. 5–21 in Human Lactation: Milk Components and Methodologies, R.G. Jensen and M.C. Neville, eds. New York: Plenum.
Young, C.M., G.C. Hagan, R.E. Tucker, and W.D. Foster. 1952. A comparison of a dietary study methods II. Dietary history vs. seven-day record vs. 24-hr. recall. J. Am. Diet. Assoc. 28:218–221.


