3
Mortality Trends
CHILD MORTALITY
Child Mortality Before the Mid-1970s
Prior to the National Demographic Survey (NDS) of 1977 and the Kenya Fertility Survey (KFS) of 1977–1978, the only information on child mortality that covered all or most of the country came from the censuses. The first census in 1948 included questions on lifetime births to mothers, deaths at under 1 year of age, and deaths at over 1 year. These questions were asked in a purposive sample of communities. There was a broad age division of mothers between those within the reproductive ages and those past them. (Ages in calendar years were recorded for women who knew them, but the numbers were very small and unevenly distributed over the country.) From the responses, crude estimates of child mortality can be derived. At the censuses of 1962, 1969, and 1979, data were collected for all women in the reproductive period, by age, of total children born, surviving, and dead. The proportion dead by age group of mothers can be translated into approximate estimates of child mortality at different times by standard indirect methods.1 The measures provide mortality trends over some 30 years from the 1940s.
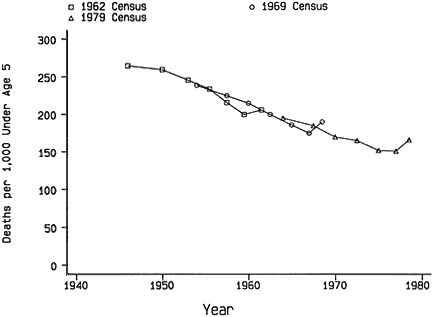
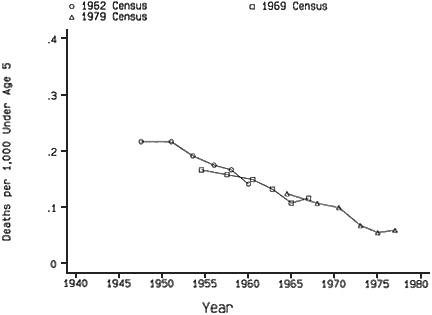
Figure 3-1 Trends in child mortality—indirect estimates of proportions dying.
These data have been thoroughly analyzed, particularly by John Blacker and colleagues (1987). Results are available down to the district level, although they are not fully published. Aggregate estimates of mortality up to age 5 years from the censuses (including a measure from the rather different 1948 source) are given in Figure 3-1. They show a consistency among the different censuses that is remarkable relative to experience with the methods in other developing countries, particularly in Africa. Thus the estimate for 1954 from the 1969 census (reports of women aged 45–49 years) is almost identical to the level at that time indicated by the 1962 census (women aged 30–34 and 35–39 years). Similarly, the estimate for 1964 from 45-to 49-year-old women at the 1979 census is in excellent
TABLE 3-1 Indirect Estimates of Probability of Dying by Age 5 (5q0) per 1,000 Births from Census Reports of Children Who Have Died
|
Approximate Year of Estimate |
5q0 |
Decrease per Year in Interval |
Year of Census Data Source |
|
1940 |
270 |
— |
1948 |
|
1954 |
239 |
2.2 |
1969 |
|
1964 |
197 |
4.2 |
1979 |
|
1974 |
153 |
4.4 |
1979 |
agreement, with the points in the early 1960s derived from reports at the 1962 and 1969 censuses. Even the measure obtained from the 1948 census sample located around 1940 (not shown), which is less secure, is in accord with the extrapolation backward from later points. It can be concluded with confidence that the trend demonstrated by the series is valid, although reservations should be noted. There could be biases in the measures from errors common to censuses, for example, in the classification of stillbirths or the choice of model patterns of mortality by age in the estimation procedure. There are several alternative methods for arriving at estimates of the probability of dying by age 5 (5q0) and their time locations. However, the range of values from different assumptions is much smaller than the changes in incidence shown by the trend.
Child mortality fell from about 250 deaths per 1,000 births in 1950 to almost 150 by 1975, or at a rate of about 4 deaths per 1,000 births per year. Because the proportion of children dead for an age group of mothers is an average over a substantial range of child birth cohorts, the measures at calendar years are smoothed values around these points. The dips and upturns in the estimates from the reports for the younger mothers, apparent at all the censuses, can be attributed to selection by birth order and possibly social and economic factors such as illegitimacy. A fitted trend should smooth out these deviations. The trend is very nearly linear from 1950, and because this trend is based on a series of overlapping measures from three censuses there is no reason to believe it is an artifact of the method of estimation. Table 3-1 gives the estimates of 5q0 at selected times based on the census data.
Child Mortality After the Mid-1970s
Between 1977 and 1984 there was a series of national surveys that collected information on children born and died by age of mother. Two of these, the 1977–1978 KFS and the 1984 Kenya Contraceptive Prevalence Survey (KCPS) were conducted with comparatively small samples (about
TABLE 3-2A Indirect Estimates of Probability of Dying by Age 5 (5q0) from Reports of Proportions of Children Who Have Died: Comparisons of Three Surveys and 1979 Census Data
|
|
1978 KFS |
1983 NDS |
1984 KCPS |
1979 Census |
||||
|
Age of Mother |
Year of Estimate |
5q0 |
Year of Estimate |
5q0 |
Year of Estimate |
5q0 |
Year of Estimate |
5q0 |
|
20–24 |
1975 |
.156 |
1980 |
.124 |
1981 |
.143 |
1976 |
.152 |
|
25–29 |
1973 |
.158 |
1978 |
.121 |
1979 |
.167 |
1974 |
.153 |
|
30–34 |
1970 |
.154 |
1976 |
.132 |
1977 |
.143 |
1972 |
.166 |
|
35–39 |
1968 |
.164 |
1973 |
.137 |
1975 |
.171 |
1970 |
.169 |
|
40–44 |
1965 |
.164 |
1971 |
.147 |
1972 |
.176 |
1967 |
.185 |
|
45–49 |
1962 |
.188 |
1967 |
.157 |
1968 |
.176 |
1964 |
.198 |
8,100 and 6,600 women interviewed, respectively) but obtained complete maternity histories. In the first survey, ages at death of children were also recorded and mortality rates in the time periods can be calculated directly. Three rounds of the NDS were completed in 1977, 1978, and 1983. There were problems with the analysis of the data from the first two dates, but some results are available for 1977. These are very similar to the measures estimated from the KFS but are rather erratic. They are not presented here. Table 3-2A gives estimates of 5q0 derived from the proportions of children dead by age group of mothers, reported in three surveys, and compares them with the measures from the 1979 census. The values are also plotted in Figure 3-2.
The agreement among the four sets of indirect estimates is not as good as would be hoped. In assessing their characteristics it should be noted that the three surveys had essentially the same sampling frame, which excluded seven of the more remote districts of the country, as noted in Chapter 2. However, because only about 5 percent of the Kenyan population lived in these districts, the bias introduced in comparisons with the census results is very small. The sample errors of the estimates from the KFS and KCPS are considerable and may explain the erratic features of the individual measures of 5q0. The census estimates are in best agreement overall with the KCPS
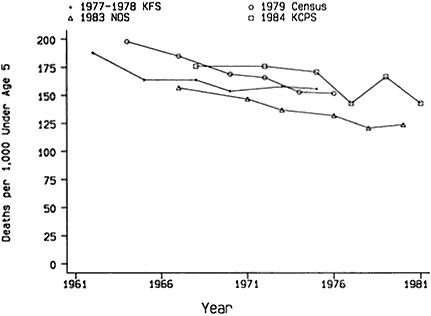
Figure 3-2 Trends in child mortality—indirect estimates of proportions dying.
child mortality levels, with both indicating quite a steep decrease in rates in the 10 years from the late 1960s. The measures derived from the reports of younger women in the KFS, providing child mortality levels around the mid-1970s, are also close to the census estimates. However, the KFS measures from reports of older women are considerably lower than the census values at equivalent times. The trend from the KFS is much flatter and fits rather poorly with the pattern of declines deduced from the 1962, 1969, and 1979 censuses. The outlying set of estimates is from the 1983 NDS, the general level being 20 to 30 deaths per 1,000 lower than the census rates, although the trend downward with time is steeper than for the KFS values.
Although there is some uncertainty about childhood mortality in the 1970s, a 5q0 of about 155 deaths per 1,000 seems acceptable for around 1975. This estimate is in accord with the data from the 1979 census and the KFS. The proportions of children reported as dead by older women at the KFS may be a little understated, but the discrepancy here could be due to sample error. The level of child mortality shown by the NDS estimates is so inconsistent with the evidence from other sources that it must be rejected. There is no plausible explanation of why the NDS measures should be right, and the remaining series all show higher proportions of child mortality to much the same extent.
Of the surveys reviewed in Figure 3-2, only the KFS recorded dates of births and deaths of children. It is thus possible from these data to calculate the child mortality in calendar periods directly. (The estimates presented thus far have relied on indirect techniques and data that do not allow direct calendar period estimates.) Figure 3-3 compares the direct and indirect estimates from the KFS. The agreement is satisfactory. In accordance with the foregoing discussion, the KFS reports of child deaths in a recent period before the survey (here taken as 10 years) can serve as a reliable base for the examination of subsequent trends.
As discussed in Chapter 2, the Kenya Demographic and Health Survey (KDHS) of 1988–1989 collected maternity histories with details of births and deaths of children from 7,150 women aged 15–49 years. The sample frame was the same as for the KFS; the questions and procedures for obtaining information on child deaths were also very similar, but in the later survey there was a substantial additional section on child health. The comparability of data and coverage in the two surveys makes them the obvious sources for the measurement of child mortality changes over the 11-year interval.
Table 3-2B gives the indirect estimates of 5q0 from data from the KFS and KDHS on proportions of children dead by age of mothers. The results are disquieting. The mortality rate in the mid-1970s of around 100 deaths per 1,000 births from the KDHS is only two-thirds of the rate from the KFS for the same period. The relative underreporting of child deaths in the
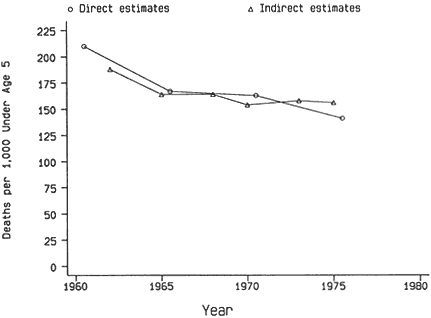
Figure 3-3 Estimates of 5q0 (probability of dying by age 5) from 1978 KFS.
KDHS can be seen even more directly and obviously. At the KFS, 1.20 children per woman aged 35–39 years were reported to have died. Eleven years later at the KDHS, these women would have been 46–50 years old with additional deaths of children, including some of those born in the interval but failing to survive the heavy risks of infancy. However, only 1.08 dead children were recorded per woman aged 45–49 years.
It does not necessarily follow from the heavy relative underreporting of child deaths at the KDHS by the older women that there was a similar error for the younger women. The time trend in the 5q0 derived from the age groups of mothers in the KDHS is effectively zero. The implication that there was no decline in child mortality over the 15 years or so before the date of the KDHS is, of course, completely at variance with the comparative levels of the two surveys and other evidence of regular improvements. Indeed, if a rate of decline in 5q0 of 4 deaths per 1,000 per year is extrapolated from the experience of the 20 years before 1975 (based on census data), the resulting level of mortality by the mid-1980s is not very far from the KDHS estimates from the recent reports.
More incisive comparisons of the recording of child deaths at the KFS and KDHS are given in Tables 3-3A and 3-3B. Here the data from the later
TABLE 3-2B Indirect Estimates of Probability of Dying by Age 5 (5q0) from Reports of Proportions of Children Who Have Died, 1978–1989: KFS and KDHS Data
|
|
1978 KFS |
1989 KDHS |
||||
|
Age of Mother |
Year of Estimate |
Children Dead per Woman |
5q0 |
Year of Estimate |
Children Dead per Woman |
5q0 |
|
20–24 |
1975 |
0.23 |
.156 |
1986 |
0.14 |
.113 |
|
25–29 |
1973 |
0.54 |
.158 |
1984 |
0.28 |
.092 |
|
30–34 |
1970 |
0.85 |
.154 |
1982 |
0.52 |
.106 |
|
35–39 |
1968 |
1.20 |
.164 |
1979 |
0.67 |
.097 |
|
40–44 |
1965 |
1.45 |
.164 |
1977 |
0.84 |
.097 |
|
45–49 |
1962 |
1.88 |
.188 |
1973 |
1.08 |
.110 |
TABLE 3-3A Child Deaths per Woman Reported from Births in Approximately the Same Periods—KDHS Estimates as a Percentage of KFS Estimates
|
|
Years Before KDHS |
|||||
|
Age of Women at KDHS |
10–14 |
15–19 |
20–24 |
25–29 |
30–34 |
More than 10 |
|
Under 35 |
91 |
99a |
|
|
|
93 |
|
35–39 |
69 |
72 |
81a |
|
|
72 |
|
40–44 |
72 |
73 |
69 |
65a |
|
70 |
|
45–49 |
96 |
60 |
64 |
68 |
60a |
67 |
|
a Including small numbers from earlier periods. |
||||||
survey are backdated 10 years, and measures are calculated for 5-year age cohorts and preceding periods. This process is essentially a reconstruction of the KDHS results relevant to the years prior to 1979, slightly more than a year later than the KFS. Table 3-3A shows the ratios of child deaths reported per woman at the KDHS to those at the KFS for age cohorts of women in preceding time periods. Although the ratios are erratic in some of the marginal cells where the numbers of child deaths are low, the general pattern is coherent. The relative underreporting in the KDHS is about 30 percent for women aged 35 years and over, with only a slight tendency to become worse as age increases. At ages under 35 years, the discrepancy is much less, but because in this comparison only children of mothers under 25 years at the KFS are covered, the numbers of deaths are fairly small. A significant feature is the lack of any clear tendency for the ratios to be smaller for reports from the more distant past when the age group of the
TABLE 3-3B Proportions of Children Reported Dead at KDHS and KFS from Births for Approximately the Same Time Periods and Cohorts of Mothers by Age Group
|
Age of Mothers at KDHS |
KFS at Survey Date |
10 Years Before KDHS |
KDHS as a Percentage of KFS |
|
25–29 |
.102 |
.087 |
85 |
|
30–34 |
.130 |
.107 |
82 |
|
35–39 |
.143 |
.103 |
72 |
|
40–44 |
.155 |
.115 |
74 |
|
45–49 |
.175 |
.127 |
73 |
mothers is fixed (comparing across the table). In Table 3-3B, the proportions of children dead as recorded at the two surveys for approximately the same cohorts and time periods are displayed. The findings are in close accord with the conclusions from Table 3-3A. The measures for the older cohorts are about 27 percent lower from the KDHS than the KFS, with a reduced shortfall for the younger cohorts. The discrepancies between the reporting of child deaths in the two surveys decrease as the age of mother decreases and also as births become more recent since the two characteristics are strongly correlated. It should be remembered, however, that the comparisons are of deaths from births that occurred 10 more years before the KDHS than the KFS.
Differentials in Child Mortality
Table 3-4 gives the comparisons of proportions of children reported dead at the KFS and KDHS for approximately the same time periods and cohorts by province, residence, and education. The cohorts distinguished are the mothers under and over 35 years at the later survey. The numbers of child deaths for the former category are frequently rather small for the earlier date. Although the ratios of the measures at the two surveys are fairly erratic, as expected in view of the sample errors, there is little indication of substantial variations in the relative completeness of reporting. Notably, the educational groups are in good agreement, with the smallest overall discrepancy in fact for the women with no education. The ratios for the relative proportions of child deaths reported are higher for urban than for rural women but only modestly; this suggests that reporting in urban areas may be slightly better than in rural areas. For the provinces there are two aberrant indices. In the Coast, the proportions of children reported as dead by mothers under 35 years at the KDHS were much higher than at the KFS, but the measures for mothers over 35 were in accord with the general pattern. The recorded proportions dead in Rift Valley for mothers over 35 at the KDHS were exceptionally low. Although notable, these deviations do not provide an adequate base for the derivation of incompleteness assessments that differ for subgroups.
The reasons for the severe underreporting of child deaths at the KDHS have not been established. One possibility is that the addition of more detailed questions on birth intervals, contraception, and illness of children overloaded the interviewers. There is no direct evidence that overloading of the questionnaire affected the completeness of the reporting of deaths of children who were born in the 10 years before the KDHS. The pattern of error does not rule out the possibility that the reports for the recent period were correct. There is, in fact, some evidence supporting this conclusion from the distribution of child deaths over the 10 years before the surveys.
TABLE 3-4 Proportions of Children Reported Dead at KDHS and KFS from Births for Approximately the Same Time Periods and Cohorts of Mothers by Province, Residence, and Education
|
|
Mothers Under Age 35 |
Mothers Age 35 and Over |
||||
|
Residence and Education |
KFS |
KDHS |
KDHS as Percentage of KFS |
KFS |
KDHS |
KDHS as Percentage of KFS |
|
Province |
|
|
|
|
|
|
|
Kenya |
.125 |
.102 |
82 |
.158 |
.115 |
73 |
|
Nairobi |
.083 |
.075 |
90 |
.129 |
.078 |
60 |
|
Central |
.080 |
.045 |
56 |
.099 |
.080 |
81 |
|
Coast |
.139 |
.265 |
191 |
.201 |
.168 |
84 |
|
Nyanza |
.192 |
.142 |
74 |
.225 |
.179 |
80 |
|
Eastern |
.091 |
.065 |
72 |
.142 |
.120 |
85 |
|
RiftValley |
.084 |
.063 |
75 |
.106 |
.046 |
43 |
|
Western |
.143 |
.107 |
75 |
.194 |
.141 |
73 |
|
Residence |
|
|
|
|
|
|
|
Urban |
.100 |
.085 |
85 |
.121 |
.098 |
81 |
|
Rural |
.128 |
.104 |
81 |
.162 |
.116 |
72 |
|
Education |
|
|
|
|
|
|
|
None |
.161 |
.135 |
84 |
.184 |
.140 |
76 |
|
1–4 years |
.138 |
.126 |
91 |
146 |
.097 |
66 |
|
5+ years |
.092 |
.060 |
66 |
.109 |
.079 |
72 |
Calculations for the African Standard model life table (United Nations, 1982) give 5q0 as 1.36 times the proportion of children dead from births in the preceding 5 years and 0.92 times the proportion for the 5 years before that (a ratio of 1.36/0.92, or 1.48). Thus, if child mortality is approximately constant, the proportion dead of births 5 to 10 years before should be about 50 percent greater than the proportion for 0 to 5 years. For the KFS the observed ratio of 1.60 is in good agreement with expectation, particularly if there is some decrease in mortality. For the KDHS the observed ratio at 1.17 seems much too low. Despite the crudeness of these calculations, they suggest that death reporting for recent births was much better than for the more distant events in the KDHS.
A measure of child mortality from the ratios of deaths to births in the 10 years preceding the surveys has been constructed as 0.685δ0 + 0.465δ5 where 5δ0 and 5δ5 are the proportions of children dead from births in the preceding 5 years and the 5 years before that, respectively. The multiplying factors are derived from the relationships in the African Standard model life table with a simple averaging of the estimates from the two time periods. This measure is a satisfactory approximation for child mortality up to 5 years. It is, of course, possible from the maternity histories to calculate 5q0 by more refined life table methods. Such calculations have indeed been made by Rutstein (1984) from the KFS data for provinces. The estimates from the approximate formula above are very close to the Rutstein values for the KFS, and the sample errors are considerable because of the small numbers of deaths. The simple procedure is adequate for the present purposes.
That there were substantial omissions of dead children in the KDHS reports has been established but the effect for births in the most recent 10 years is clearly much less than for more distant events. The trends and patterns by time suggest that an increase in the 5q0 of 20 percent (a 17 percent omission of child deaths) would be a generous allowance for underreporting.2
Table 3-5 gives the estimates of 5q0 by province, derived from survey reports of child deaths from births in the preceding 10 years, with and without adjustments for underreporting at the KDHS. Also given are the 5q0 estimates for around 1954 obtained from the proportions of children dead at the 1969 census for women aged 45–49 years. As noted previously, these estimates lie on the trend line of national child mortality estimated from the
|
2 |
The basis for the adjustment is the comparison of the KDHS and KFS birth histories (Table 3-3) and the trends from the age group estimates from the KDHS compared with the other censuses and surveys. This reasoning does not depend on the mortality levels in the periods preceding the KFS and the KDHS, which were used to estimate trends. In later discussions of the KDHS data, the 20 percent correction is applied to all subgroups. |
TABLE 3-5 Estimates of Trends in Probability of Dying by Age 5 (5q0) by Province
|
|
|
|
|
|
Ratios |
|
|
|
|
|
|
1984 c |
|
1984/1973 |
||
|
Province |
1954 a |
1973 b |
Unadjusted |
Adjusted d |
1973/1954 |
Unadjusted |
Adjusted d |
|
Nairobi |
.133 |
.103 |
.086 |
.103 |
77 |
84 |
100 |
|
Central |
.192 |
.090 |
.049 |
.059 |
47 |
54 |
66 |
|
Coast |
.223 |
.195 |
.151 |
.181 |
87 |
77 |
93 |
|
Nyanza |
.328 |
.221 |
.153 |
.184 |
67 |
69 |
83 |
|
Eastern |
.210 |
.130 |
.063 |
.076 |
62 |
48 |
58 |
|
Rift Valley |
.167 |
.095 |
.051 |
.061 |
57 |
54 |
64 |
|
Western |
.283 |
.191 |
.128 |
.154 |
67 |
67 |
81 |
|
Kenya |
.239 |
.149 |
.091 |
.109 |
62 |
61 |
73 |
|
a From 1969 census. b From births in 10 years before the KFS. c From births in 10 years before the KDHS. d Increased by 20 percent for omissions of deaths. |
|||||||
series of censuses. The ratios of the mortality levels in 1973 to 1954 and in 1984 to 1973 are also shown as summary indices of the trends. For Kenya as a whole, the decrease in 5q0 is calculated to be 38 percent between 1954 and 1973, and 27 percent between 1973 and 1984, if the adjusted level is accepted. The assumption that no adjustment is needed gives a 39 percent decrease between 1973 and 1984. In either case, because the first interval is 19 years and the second 11, the rate of child mortality decrease accelerated in the late 1970s to 1980s.
The striking feature of the provincial breakdown is the high correlation between the reductions from 1973 to 1984 and from 1954 to 1973. The rankings of the decreases by size in the two periods for the provinces are very similar. It seems likely that the underlying determinants of improved child mortality in the recent period were the same as those operating over the previous 20 years or more. The provinces that appear as outliers from the average are Central, where an initial 5q0 of 192 deaths per 1,000 becomes 59 deaths per 1,000 (adjusted), a reduction of 70 percent by the 1980s. At the other extreme, the Coast child mortality rate of 223 deaths per 1,000 in 1954 was below the national average; by the 1980s, it was two-thirds above the average at 181 per 1,000 (adjusted), a reduction of only 19 percent. Nairobi also appears to do rather badly in improvement from an exceptionally good level in 1954, but the changing composition of the city population must be borne in mind. The reductions in child mortality in the four remaining provinces were much closer to the national value of 54 percent, although it may be noted that the two with the higher initial levels (Nyanza and Western) did worse than the two that started from a more favorable base (Eastern and Rift Valley). As a result of these movements the variation in child mortality among provinces was relatively greater in the 1980s than in the 1950s, ranging from 59 to 184 per 1,000 (more than threefold) in the latter period compared with 167 to 328 per 1,000 (twofold) earlier if Nairobi is excluded.
The trends in 5q0 between the 10 years preceding the KFS and the corresponding period before the KDHS are estimated in Table 3-6 by residence and education. The reduction appears to be slightly greater for rural areas, although if the indication that reporting of child deaths at the KDHS was a little better in urban communities was relied upon, the relative improvements would be virtually identical. The pattern of change by length of schooling does not suggest that education was a directly meaningful factor in the mortality declines. The differentials in the 1970s by residence and length of schooling were substantial and in the expected direction, but the further decreases in child mortality by the 1980s did not after the relationships.
Measures of the levels of 5q0 by education can be derived from the 1969 and 1979 census reports for the period 1954–1974 approximately, but
TABLE 3-6 Estimates of Trends in Probability of Dying by Age 5 (5q0 ) by Residence and Education
|
|
|
1984 b |
Ratio 1984/1973 |
||
|
Residence and Education |
1973 a |
Unadjusted |
Adjusted c |
Adjusted |
Unadjusted c |
|
Residence |
|||||
|
Urban |
.120 |
.090 |
.108 |
75 |
90 |
|
Rural |
.152 |
.092 |
.110 |
61 |
72 |
|
Education |
|||||
|
None |
.169 |
.106 |
.127 |
63 |
75 |
|
1–4 years |
.139 |
.099 |
.119 |
71 |
86 |
|
5–8 years |
.126 |
.087 |
.104 |
69 |
83 |
|
9+ years |
.081 |
.062 |
.074 |
77 |
91 |
|
a From births in 10 years before the KFS. b From births in 10 years before the KDHS. c Increased by 20 percent for omissions of deaths. |
|||||
the education categories are slightly different from those of the KFS and KDHS estimates, namely, none, primary, and secondary or above. The trends, however, are consistent with the 1973–1984 pattern of decline. They show a reduction from 244 deaths per 1,000 in 1954 to 184 per 1,000 in 1974 (75 percent) for children of mothers with no schooling; 160 to 121 (76 percent) for mothers with primary education; and a flat 67 deaths per 1,000 for the group with secondary schooling or higher. The low mortality of children of the well-educated mothers as long ago as 1954 reflects the highly selected composition of this very small class. However, by the time of the KDHS, about one-third of the women aged 20–24 years had been at school for 9 years or more. They represented a much wider cross-section of social and economic conditions. In 1954, the 5q0 ranged from 244 per 1,000 to 67 per 1,000 for children of mothers with no schooling to those with secondary or above (nearly a fourfold ratio). The approximately corresponding estimates in 1984 (mothers with no education and those with 9 years or more) were 121 and 67 per 1,000, respectively (with a 20 percent upward adjustment to the KDHS reports of child deaths). The ratio at the later date was less than twofold. The reduction in variability and the very substantial improvement in the mortality of children for mothers with no schooling (a halving approximately between 1954 and 1984) show that factors other than formal education were powerful determinants of the changes over time, although in the cross-section, educational differentials remain.
The levels and trends in childhood mortality need to be examined at greater geographical disaggregation. Although some of the provinces in Kenya cover districts that are homogeneous in tribal composition, physical
environment, and economic development, others are very diverse. Measures for districts have been calculated by Blacker and Airey3 from the census reports by mothers of children born and died. Their results are not fully published but have been utilized in papers. Very similar results have been obtained by Ewbank et al. (1986). Unfortunately, it is not possible at present to extend these estimates to the late 1970s and 1980s. Calculations from the 1983 NDS have been made, but as shown previously the mortality levels are too low to be consistent with the other series. In any case the estimates would be brought forward only a few years. The combination of the underreporting of child deaths and the small sample sizes for districts in the 1989 KDHS makes the derived 5q0 too unreliable for interpretation.
However, the strong correlation between the child mortality trends in the provinces from 1973 to 1984 and from 1954 to 1973 suggests that the district trends for the earlier years are broadly valid for the more recent period also. Of course there could still be individual exceptions. Evidence in appendix Table 3A-1 supports the general conclusion by demonstrating that the decreases in child mortality by district in Rift Valley Province in 1954 to 1964 were highly correlated with the declines in 1964 to 1974. It seems reasonable therefore to take the trends for 1954 to 1974 as good indicators of the variations in improvement by district over the past 30 years or so. Many of the districts show series of 5q0 by period from the censuses that are in excellent agreement, as was the case for the national measures. In some cases the consistency is not so impressive. Examples in both categories are given in the appendix. In all, however, the calculations based on data from the 1969 and 1979 censuses provide a convincing trend.
Table 3-7 presents estimates of 5q0 in 1954 and 1974 by district and the ratios of the latter values to the former. In all cases the 1974 measure is derived from the proportion of children reported as dead by mothers aged 25–29 years at the 1979 census. The corresponding child mortalities for provinces are not the same as the values for 1973 obtained from the KFS and utilized in Table 3-5, but the differences are remarkably small with the exception of Rift Valley Province where the 1979 census estimate is considerably higher than the KFS value (132 per 1,000 compared with 95 per 1,000). In this province, unlike the others, the proportion of dead children from births 5 to 10 years before the survey is exceptionally low, with an upward jump at 10 to 15 years. The value of 95 per 1,000 is likely to be an underestimate, but the gap to 132 is uncomfortably large. The estimates of 5q0 in 1954 are derived from the reports of proportions of children dead by women aged 45–49 and 40–44 years at the 1969 census. In most districts the measure taken was that calculated from child deaths for the oldest group
TABLE 3-7 Estimates of Trends in Probability of Dying by Age 5 (5q0) by District
|
Province |
District |
1954 |
1974 |
Ratio 1974/1954 |
|
Nairobi |
Nairobi |
.133 |
.112 |
84 |
|
Central |
Kiambu |
.168 |
.077 |
46 |
|
|
Kirinyaga |
.255 |
.117 |
46 |
|
|
Muranga |
.214 |
.089 |
42 |
|
|
Nyandarua |
.188 |
.083 |
44 |
|
|
Nyeri |
.167 |
.062 |
37 |
|
Coast |
Kilifi |
.254 |
.236 |
93 |
|
|
Kwale |
.229 |
.224 |
98 |
|
|
Lamu |
.198 |
.198 |
100 |
|
|
Mombasa |
.168 |
.140 |
83 |
|
|
Taita |
.275 |
.142 |
52 |
|
|
Tana River |
.177 |
.189 |
107 |
|
Eastern |
Embu |
.217 |
.110 |
51 |
|
|
Isiolo |
.229 |
.153 |
67 |
|
|
Kitui |
.263 |
.177 |
67 |
|
|
Machakos |
.209 |
.119 |
57 |
|
|
Marsabit |
.152 |
.144 |
95 |
|
|
Meru |
.178 |
.103 |
58 |
|
Northeastern |
Garissa |
.176 |
.148 |
84 |
|
|
Mandera |
.141 |
.157 |
111 |
|
|
Wajir |
.207 |
.153 |
74 |
|
Nyanza |
Kisii |
.234 |
.133 |
57 |
|
|
Kisumu |
.337 |
.243 |
72 |
|
|
Siaya |
.355 |
.252 |
71 |
|
|
South Nyanza |
.370 |
.262 |
71 |
|
Rift Valley |
Baringo |
.206 |
.189 |
92 |
|
|
Elgeyo Marakwet |
.111 |
.150 |
135 |
|
|
Kajiado |
.146 |
.088 |
60 |
|
|
Kericho |
.156 |
.115 |
74 |
|
|
Laikipia |
.168 |
.098 |
58 |
|
|
Nakuru |
.190 |
.120 |
63 |
|
|
Nandi |
.187 |
.130 |
70 |
|
|
Narok |
.158 |
.120 |
76 |
|
|
Samburu |
.089 |
.098 |
110 |
|
|
Trans Nzoia |
.215 |
.138 |
64 |
|
|
Turkana |
.173 |
.158 |
91 |
|
|
Uasin Gishu |
.159 |
.114 |
72 |
|
|
West Pokot |
.253 |
.230 |
91 |
|
Western |
Bungoma |
.258 |
.170 |
66 |
|
|
Busia |
.362 |
.236 |
65 |
|
|
Kakamega |
.271 |
.168 |
62 |
of mothers (45 to 49 years). In a minority of districts, the series of 5q0 values at time points derived from the 1979 and 1969 (and, in some instances, 1962) censuses indicated a trend line fitting poorly the estimate from the oldest group of mothers. In eight of these ten districts (as indicated in the table), the 5q0 measure obtained from the reports of the 40-to 44-year-old mothers was selected as a better estimate for 1954, that is, more consistent with other points. In the other two districts, Marsabit and Laikipia, an average of the values from mothers aged 45–49 years and 40–44 years was taken. Although Marsabit is in Eastern Province, it is geographically in the remote north and was excluded from the KFS and KDHS samples. Three of the other districts with inconsistent reports of proportions of children dead by the oldest mothers in 1969 are in the Coast Province where improvement in child mortality was slight. The modified procedure of estimation makes the indices slightly more favorable but does not change the conclusion of poor gains. The other six districts are all in the diverse Rift Valley Province. Two of them, Baringo and Turkana, can be assessed in much the same way as the Coast Province districts above, but Narok, Laikipia, Trans Nzoia, and Uasin Gishu showed moderate improvements in child mortality and would still have done so, although to a different degree, if the estimation procedure had not been modified.
In the discussion of the levels and trends of 5q0 by district, emphasis is placed on the cohesion or discrepancies with the provincial findings in Table 3-5. The outstanding gains in Central Province were shared by all of its districts fairly equally but with some advantage to Nyeri, both in level (62 per 1,000 in 1974) and in trend (a 63 percent improvement from 1954 to 1974). The three districts of Western Province were also notably similar in the 5q0 trends, with reductions of about one-third from the high levels of 1954. The three districts in Eastern Province that adjoin Central (Embu, Machakos, and Meru) experienced falls in child mortality that were almost as great as for districts in Central and achieved respectably low levels in 1974. The areas of Isiolo and Kitui had average performances. As noted above, Marsabit is a geographically remote district compared with the rest of Eastern Province. Its child mortality appears to have improved little, although the 1974 level is not exceptionally high, when compared, for example, to most of Nyanza and Western provinces. The comments on Marsabit also apply to the three districts of Northeastern Province, which are also remote and were excluded from the KFS and KDHS samples. For these districts, there must be some suspicion about the accuracy of the estimates based on the reports of older women at the 1969 census and hence of the derived trends.
In 1954, Nyanza Province exhibited clearly the highest 5q0 but by 1984 it had moved to a less extreme ranking. This change in ranking was due to average progress in three of the four districts (some 30 percent reduction
from 1954 to 1974) and an impressive mortality decline of 43 percent in Kisii to a level of 133 deaths per 1,000, only about one-half of the measure in the rest of the province. Only one district in the Coast Province contradicted the trend as the province moved from average child mortality in 1954 to the highest incidence in 1974. This district was Taita-Taveta, the most distant from the Indian Ocean, where child mortality almost halved from 1954 to 1974 although from an initially high level. The 13 districts of the Rift Valley Province stretch from Kajiado, bordering Tanzania in the central-south to Turkana touching the Sudan in the remote northwest. Not surprisingly, the child mortality levels and trends are very diverse. The three districts that adjoin the Central Province (Nakuru, Laikipia, and Kajiado) experienced strong improvement to low levels, whereas the five in the northwest (Baringo, Elgeyo Marakwet, West Pokot, Samburu, and Turkana) made little gain. The remainder, lying between the central area and the west did comparatively well, although the mortality reductions were not as large as in Central Province and its immediately surrounding areas.
The Possible Effects of AIDS on Child Mortality
There has been increased concern about the spread of acquired immune deficiency syndrome (AIDS) in Kenya, as well as other regions of sub-Saharan Africa. One study of blood donors conducted in Nairobi indicated that the prevalence rate of human immunodeficiency virus (HIV), which causes AIDS, was 6.2 for men and 2.9 for women. In Nyanza and Coast provinces, the prevalence of HIV infection in blood donors was 4.3 and 3.5 percent, respectively. HIV seroprevalence rates for prostitutes in Nairobi have risen dramatically between 1980 and 1990, from 7.1 to 87.8 (Center for International Research, 1991).
There is little evidence on the effects of AIDS on child mortality in Kenya. There are certainly both direct and indirect effects. HIV is transmitted directly from infected mothers to their children during delivery (about 30 percent of the time), and possibly through breastfeeding. Children who are HIV negative, but whose mothers suffer from or die of AIDS face additional mortality risks from being orphaned (Working Group on the Effects of Child Survival and General Health Programs on Mortality, 1993). The mortality rates examined in this chapter are mainly for periods some time in the past when the effects of AIDS were very small. Recent child mortality rates most likely have been affected by AIDS, but the estimated addition to deaths is still probably small relative to the degree of measurement error. For Africa as a whole, the Working Group on the Effects of Child Survival and General Health Programs on Mortality (1993) estimates that AIDS is the primary cause of death in about 3 percent of all infant and child deaths.
ADULT MORTALITY
Information on adult mortality in sub-Saharan Africa is limited and uncertain. It is difficult to draw firm conclusions from the evidence for a single country such as Kenya. In particular, although broad trends in adult mortality for subnational aggregates can be explored, any findings are greatly restricted in time and must be hedged with cautions. A general review of the topic over a range of countries is given by Timæus (1993). The 1969 and 1979 censuses of Kenya included questions on the survivorship of parents. Both Ewbank et al. (1986) and Blacker et al. (1987), by similar techniques, used the responses to estimate the levels of adult mortality for Kenya as a whole as well as for its provinces and districts. A primary objective of the latter authors was to examine the relation between adult and childhood mortality. The account here is based on their estimates.
The method used was developed by Timæus (1986), following suggestions made by Preston and Bennett (1983). The proportion of persons in each age group with mothers (fathers) alive at the two censuses were averaged and adjusted to produce a single set of measures for females (males)
TABLE 3-8 Estimates of Adult Mortality, 1969–1979, Both Sexes
|
Province and District |
Expectation of Life at Age 15, e(15) |
Province and District |
Expectation of Life at Age 15, e(15) |
|
Kenya |
52.9 |
Western |
54.1 |
|
Nairobi |
54.5 |
Bungoma |
54.8 |
|
Central |
55.7 |
Busia |
50.7 |
|
Kirinyaga |
57.1 |
Kakamega |
54.9 |
|
Muranga |
55.5 |
Northeastern |
50.8 |
|
Kiambu |
54.0 |
Garissa |
49.9 |
|
Nyandarua |
56.7 |
Mandera |
50.6 |
|
Nyeri |
56.3 |
Wajir |
51.9 |
|
Eastern |
54.4 |
Rift Valley |
54.4 |
|
Embu |
54.9 |
Baringo |
50.5 |
|
Isiolo |
50.5 |
Elgeyo Marakwet |
52.4 |
|
Kitui |
53.9 |
Kajiado |
52.5 |
|
Machakos |
55.5 |
Kericho |
53.6 |
|
Marsabit |
51.1 |
Laikipia |
55.0 |
|
Meru |
53.6 |
Nakuru |
54.7 |
|
Coast |
53.9 |
Nandi |
54.7 |
|
Kilifi |
54.0 |
Narok |
56.6 |
|
Kwale |
53.6 |
Samburua |
51.9 |
|
Lamu |
52.2 |
Trans Nzoia |
54.0 |
|
Mombasa |
52.7 |
Turkanaa |
45.1 |
|
Taita Tavetaa |
50.7 |
Uasin Gishu |
54.9 |
|
Tana Rivera |
46.5 |
West Pokot |
49.8 |
|
a Estimates based on 1979 orphanhood data only. |
|||
for the intercensal period. These proportions were then translated into probabilities of survival by the original weighting method devised by Brass and Hill (1973). The probabilities were finally converted into equivalent values of life expectancies at age 15, e(15), by using the logit model life table system. The resulting e(15) values were 55.2 and 50.5 years for females and males, respectively, for the country as a whole. The corresponding measures for 1979 derived by Ewbank et al. (1986) using slightly different methods were 55.2 and 51.4, in good agreement.
Table 3-8 presents the e(15) values for provinces and districts. The measures for the two sexes have been combined. Although the variations in differentials by sex over the districts are by no means extraordinary, it is considered that little weight can be put on their precise values. The provincial indices of e(15) are all close to the country-wide level. Although Central Province with the lowest child mortality has the highest life expectancy at age 15 (55.7 years), this level is only slightly greater than the measures for Western and Coast provinces, whose probabilities of child death by age 5 are more than double that of Central. The only province with an appreciably lower e(15) is the remote Northeastern Province where, in any case, the estimates are of doubtful reliability. In Figure 3-4, the
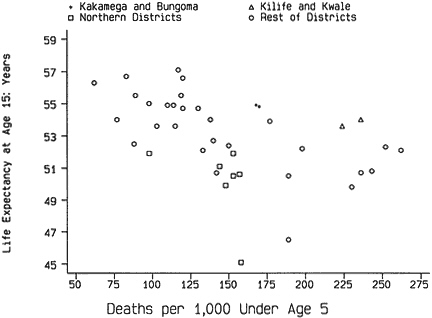
Figure 3-4 Child and adult mortality by district, specified districts, and rest of Kenya.
e(15) measures are plotted against the 5q0 estimates for 1974 by district. There is a general relationship of the kind expected but of very moderate strength. This result is perhaps not surprising in view of the comparatively small range of the e(15)s and their likely errors. The main divergences from a broadly linear relationship between adult and child mortality are for the remote districts of the north (indicated by squares). All seven of these, the areas not included in the KFS and KDHS samples, have adult life expectancies that are low relative to their 5q0 estimates. It is possible that these inconsistencies are due to underreporting of child deaths, but it is equally plausible that nomadic ways of life lead to differences in the life table patterns. Some, but not all, of the districts in Coast and Western provinces present the reverse phenomenon, comparatively high adult life expectancies with heavy child mortality as in Kilifi and Kwale (shown as triangles), and Kakamega and Bungoma (pluses).
SUMMARY
From 1950 to 1975, child mortality in Kenya fell from about 250 to about 155 deaths per 1,000 births or at a rate of approximately 4 deaths per 1,000 each year. Analysis of the Kenya Demographic and Health Survey indicates substantial underreporting of child deaths, particularly by women aged 35 years and over, which makes the exact measurement of child mortality more difficult for the recent period. However, the evidence points to a more rapid decline from the mid-1970s to the mid-1980s to about 110 deaths per 1,000 (adjusted for underreporting) in 1984.
Mortality declines by province for the two periods, 1954–1973 and 1973–1984, were highly correlated, suggesting that the factors affecting decreased child mortality were similar for both periods. The pattern of declines between these two periods resulted in a greater variation among the provinces in child mortality in the 1980s than in the 1950s. The sizes of the reductions in mortality were similar for both urban and rural areas, although differentials in mortality by residence remain. Differentials in mortality by education were reduced, and remarkable gains were made in the mortality of children for mothers with no education.
APPENDIX
TABLE 3A-1 Estimates of Trends in the Probability of Dying by Age Five (5q0) by District
|
|
Ratio |
|||||
|
Province and District |
A 1954 |
B 1964 |
C 1974 |
B/A |
C/B |
C/A |
|
Central |
||||||
|
Kirinyaga |
.255 |
.184 |
.117 |
72 |
64 |
46 |
|
Muranga |
.214 |
.148 |
.089 |
69 |
60 |
42 |
|
Kiambu |
.168 |
.116 |
.077 |
69 |
66 |
46 |
|
Nyandarua |
.188 |
.135 |
.083 |
72 |
61 |
44 |
|
Nyeri |
.167 |
.111 |
.062 |
66 |
56 |
37 |
|
Coast |
||||||
|
Kilifi |
.254 |
.250 |
.236 |
98 |
94 |
93 |
|
Kwale |
.229 |
.232 |
.224 |
101 |
97 |
98 |
|
Lamua |
.198 |
.198 |
.198 |
100 |
100 |
100 |
|
Mombasaa |
.168 |
.154 |
.140 |
92 |
91 |
83 |
|
Taita |
.275 |
.206 |
.142 |
75 |
69 |
52 |
|
Tana Rivera |
.177 |
.219 |
.189 |
124 |
86 |
107 |
|
Eastern |
||||||
|
Embu |
.217 |
.162 |
.110 |
75 |
68 |
51 |
|
Isiolo |
.229 |
.189 |
.153 |
83 |
81 |
67 |
|
Kitui |
.263 |
.219 |
.177 |
83 |
81 |
67 |
|
Machakos |
.209 |
.157 |
.119 |
75 |
76 |
57 |
|
Marsabitb |
.152 |
.150 |
.144 |
99 |
96 |
95 |
|
Meru |
.178 |
.148 |
.103 |
83 |
70 |
58 |
|
Northeastern |
||||||
|
Garissa |
.176 |
.160 |
.148 |
91 |
92 |
84 |
|
Mandera |
.141 |
.167 |
.157 |
118 |
94 |
111 |
|
Wajir |
.207 |
.164 |
.153 |
79 |
93 |
74 |
|
Rift Valley |
||||||
|
Baringoa |
.206 |
.209 |
.189 |
101 |
90 |
92 |
|
Elgeyo |
.111 |
.156 |
.150 |
141 |
96 |
135 |
|
Kajiado |
.146 |
.103 |
.088 |
71 |
85 |
60 |
|
Kericho |
.156 |
.132 |
.115 |
85 |
87 |
74 |
|
Laikipiab |
.168 |
.141 |
.098 |
84 |
70 |
58 |
|
Nakuru |
.190 |
.158 |
.120 |
83 |
76 |
63 |
|
Nandi |
.187 |
.163 |
.130 |
87 |
80 |
70 |
|
Naroka |
.158 |
.139 |
.120 |
88 |
86 |
76 |
|
Samburu |
.089 |
.109 |
.098 |
122 |
90 |
110 |
|
Trans Nzoiaa |
.215 |
.176 |
.138 |
82 |
79 |
64 |
|
Turkanaa |
.173 |
.173 |
.158 |
100 |
91 |
91 |
|
Uasin Gishua |
.159 |
.147 |
.114 |
92 |
78 |
72 |
|
West Pokot |
.253 |
.263 |
.230 |
104 |
97 |
91 |
|
a 1954 measure is estimated from the proportion of children dead for women aged 40–44 years. b 1954 measure is average of estimates for women aged 40–44 and 45–49 years. |
||||||