
2
Demographic and Socioeconomic Background
Kenya has long been considered a "success story" in the developing world and most particularly in Africa (World Bank, 1963, 1975; Parkhurst, 1970; Hazlewood, 1979; Killick, 1981). It has achieved impressive economic gains in the some 30 years of its independent existence as a nation, and it has enjoyed for the most part political stability and social tranquility. But its economic gains have been mitigated in per capita terms by a very rapid rate of population growth. In essence, Kenya's economic growth has been sufficient to allow it to make modest gains in living standards and social welfare in spite of rapid population growth. The country has managed to stay ahead of its population growth, but just barely (World Bank, 1983; Kelley and Nobbe, 1990). Recently, under pressure of both external and internal factors, economic growth has slackened. It appears that population growth has also begun to decrease, but large annual increments to the population will continue for decades to come (Rempel and House, 1978; World Bank, 1983). This chapter reviews the main economic, social, and demographic trends in Kenya since independence in 1963, concentrating on the relatively recent past. Later chapters examine in greater detail the present demographic situation (fertility and mortality) as well as the factors that can be shown to be linked to these recent demographic changes.
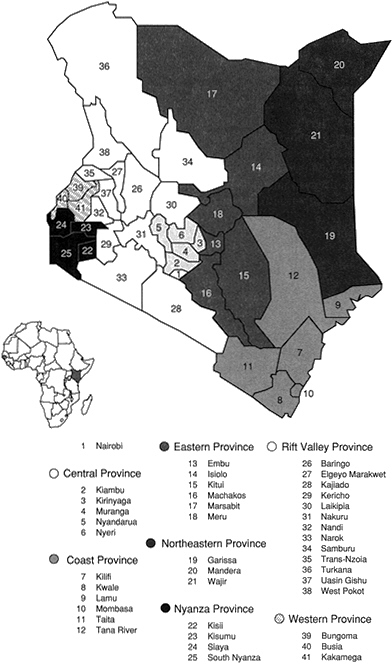
By African standards, Kenya is not a large country (Kenya 1989a,b, 1991a,b). Its 569,250 square kilometers rank it twenty-second in size among the nations of sub-Saharan Africa. For administrative purposes, Kenya is divided into seven provinces, with the capital city, Nairobi, also having special status as a province. The provinces are divided into 40 districts that
in fact form the primary unit for program purposes, as well as socioeconomic and demographic data collection and analysis (see Chapter 7 and Appendix Tables 7A-1A and 7A-1B for additional socioeconomic information by district). Figure 2-1 shows the provincial and district boundaries of Kenya.
Like many other countries of the region, Kenya's land area is remarkably diverse, with inhospitable deserts in the north, broad semiarid plateaus in the south, and rich, rolling highlands in the center. There are seven main geographic regions: the coastal region, the coastal hinterland and Tana Plains region, the eastern plateau region, the northern plainlands region, the Kenya highlands region, the rift valley region, and the western plateaus region (Nelson, 1983). The coastal region—which includes Kilifi, Kwale, Lamu, and Mombasa plus parts of Garissa, Tana River, and Taita districts—lies along the Indian Ocean. Rainfall is sufficient for agriculture to be practiced in a narrow plain and low plateau area inland from the shore. The southern part is more heavily populated, due partly to better rainfall. Historically, Arab trade flourished along the coast, particularly around Lamu. The coastal hinterland and Tana Plains region, which borders the coastal region, comprises parts of Tana River district and the southern portion of Northeastern Province (parts of Garissa and Wajir districts). There is very little rainfall in this region, and thus, little agriculture, except along the Tana River. Most of the inhabitants are pastoralists.
Moving further inland, one reaches the eastern plateau region, a series of plains comprising the northeastern part of Eastern Province, as well as the southern portion of Rift Valley Province. Rainfall is unpredictable and relatively sparse, particularly in the northern section, which is semidesert. The northern plainlands region covers the northernmost sections of Northeastern, Eastern, and Rift Valley Provinces. It is a very arid region inhabited primarily by nomadic pastoralists, except for some agriculturalists around Mount Marsabit and the base of the Ethiopian foothills, where rainfall is heavier. The Kenya highlands region, which borders the east and west sides of the rift valley in the western and central part of Kenya, is composed of the southwestern portion of Eastern Province, as well as most of Central Province and the western portion of Rift Valley Province. The area, which is characterized by relatively high altitudes, good soil, lower temperatures, and more rainfall, is intensely cultivated and many of Kenya's export crops are grown there.
The rift valley region, lying primarily in the eastern portion of Rift Valley Province, is part of the great rift valley that extends through much of eastern Africa. The population is primarily pastoralist in the northern and southern sections, which receive little rainfall and are semidesert. The central section receives greater rainfall and is suitable for growing grain crops. The western plateaus region, encompassing primarily the Western
and Nyanza Provinces, is mainly a series of plateaus that form part of the Lake Victoria basin. The region is characterized by relatively good soils and sufficient rainfall for agriculture, and thus supports a fairly high population density (Nelson, 1983).
Kenya is still mainly an agricultural country, with some 80 percent of the population living and working on 17 percent of the land. Overall, population density is a low 38 persons per square kilometer, but the rich, high-potential agricultural districts of the west and central regions show densities of 200 to 300 persons per square kilometer. Only about 18 percent of the population lives in urban centers, and more than one-third of the urban population is accounted for by the Nairobi Metropolitan Area. The vast majority of Kenyans are small-scale farmers, but larger-scale farms dominate in the export-oriented sector of agriculture—chiefly coffee, tea, cereals, and livestock products.
Ethnically, Kenya consists of some 70 tribes belonging, for the most part, to the Bantu, Nilotic, Nilo-Hamitic, or Cushitic language groups. The Bantu-related group includes the Kikuyu (the largest single tribal group) and others of the central region as well as the Luhya. The Luo are the largest single Nilotic group and are concentrated in the western region. The smaller tribes making up the other language groups tend to be concentrated in the north, the northeast, and the coastal regions, with smaller enclaves scattered elsewhere in the country.
Kenya is religiously quite diverse, although the majority of Kenyans state that they are Christian. There have been decades of missionary activity, except among nomadic pastoralists in the northernmost regions, and centuries of Islamic influence resulting from trade in the coastal region. Most Kenyans practice a combination of one of these two religions, along with an indigenous religion. Most pastoral groups adhere primarily to indigenous religious beliefs (Nelson, 1983).
SOCIOECONOMIC DEVELOPMENT
Kenya's economic prospects at the time of independence did not appear bright to many observers (Forrester, 1962; Stewart, 1976). Years of domestic unrest verging on civil war had caused considerable damage to an already inadequate infrastructure and had led to an outflow of capital and key technical personnel from some sectors of the economy. The early transition years were halting and uncertain, but the situation soon corrected itself, and by the end of the 1960s the World Bank economic reports were hailing Kenya's "remarkable achievements" and holding it up as a model for other African states. The real growth rate in gross national product (GNP) between 1965 and 1970 was 8.2 percent per annum, the domestic savings rate averaged 15 to 20 percent of gross output, the government budget typically
showed a surplus of receipts over expenditures, and the money supply was kept under tight control (World Bank, 1975). These generally cautious, conservative fiscal and monetary policies did not prevent the Kenyan government from launching extensive and ambitious economic and social programs or from pursuing "Kenyanization" of the civil service and of key positions in the private sector. Programs included land redistribution and massive expansion of largely free health and education services focused mainly in rural areas. They were implemented with little or no disruption of previous services, and the gains quickly became apparent to all concerned (Kelley and Nobbe, 1990).
Kenya chose to pursue a market-oriented approach to its development. Economic five-year plans were prepared (and still are), and the state undertook some types of economic activity directly. But private enterprise, local and foreign, was allowed and encouraged to participate in the economy. The government professed a socialist ideal for the nation but carried it no further than occasional rhetoric, a stand that stood in sharp contrast to many of its neighbors who collectivized and nationalized and made war on the private sector. These liberal economic policies undoubtedly helped Kenya in the crucial transition period and also helped fuel her early economic success. This success, as well as the continuing liberal policies, made Kenya attractive to Western aid donors and multinational corporations in the 1970s.
This pattern prevailed throughout the 1970s and 1980s, but with a gradual slowing of the rate of economic growth and a gradual abandonment by the government of the policies that had been responsible for Kenya's early economic success. As shown in Table 2-1, the real growth rate in gross domestic product (GDP) for the 1965–1980 period was nearly 6.0 percent per annum, but for the decade 1980–1990 it fell to roughly 4.0 percent per annum. By the end of this decade and thus far in the 1990s, growth has continued to be modest and is probably negative in the most recent period.
TABLE 2-1 Economic Indicators for Kenya
|
|
Annual Growth Rate (%) |
|
|
Economic Indicators |
1965–1980 |
1980–1990 |
|
GDP |
5.8 |
4.2 |
|
GDP per capita |
2.8 |
-0.3 |
|
Agricultural production per capita |
1.3 |
-0.7 |
|
Industrial production per capita |
6.2 |
-4.4 |
|
SOURCES: Kelley and Nobbe (1990); Kenya (1999b, 1991a,b). |
||
This slowing down has affected both the agricultural and the industrial sectors with the service sector now emerging as the chief source of new employment (World Bank, 1991a).
The driving forces behind this sustained growth in the past were an export-oriented agriculture, tourism, light manufacturing for domestic markets, and Nairobi's emergence as a regional center for clerical and financial services. The public sector has generally avoided direct ownership or operation of productive economic activity. Most utilities and public services were publicly owned at the time of independence and have remained so. Parastatals—publicly owned companies with a private sector-like organization and autonomy from usual governmental administrative and financial controls—have been used to promote particular sectoral or regional development objectives. They have contributed to the slow loss of the early fiscal and financial discipline, but they have not dominated the economy.
Kenya's quite respectable economic growth has not, however, been sufficient to produce any substantial increase in measured output per capita. The present GNP per capita according to the World Bank is about U.S.$370, which ranks Kenya as a low-income country (World Bank, 1992). Per capita income rose by some 2 to 3 percent per annum during the period of most rapid growth but leveled off in the late 1970s and declined in the early 1980s, under the combined effects of stagnating output and continued rapid population growth. Real wages of both public and private sector employees, who comprise the bulk of the modern sector, appear to have fallen sharply in the last decade and now may be only 70 percent of the figure for 1970 (World Bank, 1983, 1991a). Generally, surplus supply in the labor market, lack of unions with any real market power, and a deliberate policy of wage restraint by the government for both the public and the private sectors, to control inflation, seem to explain this trend. What has expanded steadily has been the supply of public services, particularly education, health, and transport and communications infrastructure. The availability of these services is connected with, but not totally dependent on, market-based household or individual income, because these services have been supplied well below cost. Thus, the overall quality of life has probably improved for the bulk of the population (Bates, 1989).
It is difficult to estimate how much of the Kenyan success story has been due to the strong and steady support that was rendered by the international donor community. The World Bank alone has supplied grants and concessionary loans amounting to some U.S.$2.5 billion since 1970 (World Bank, 1991b). Other donors, including the U.S. Agency for International Development, the Overseas Development Administration, the Swedish International Development Authority, and the Finnish International Development Agency, have probably equaled this amount (World Bank, 1991b), and all the major private nongovernmental organizations—Ford Foundation,
Rockefeller Foundation, and others—have also had important roles in Kenya. The relatively open, market-oriented development strategy plus stable, cooperative governments have made it an ideal place for foreign donors to work, and Kenya has certainly benefited. Recent events suggest that this scenario is now being played out in reverse. That is, slowing economic growth and domestic disturbances have led to less liberal, open policies by the government, which in turn have alarmed international donors and caused reductions in the volume of aid, thus increasing economic pressure and further reducing the options open to the government. Success breeds more success, but the same is often true of difficulties.
The economic changes have had a substantial social and perhaps psychological impact in Kenya as well. All sectors and regions of Kenya have become linked to the cash/market economy. The mobility of the population has increased, and modern media reach all groups. Values, perceptions, and attitudes have changed rapidly and continue to change. These ideational changes seem irreversible and are the important link through which the material changes affect demographic behavior, but it is extremely difficult to quantify or measure these relationships.
In a later chapter, we examine at some length those government policies and programs that appear to have had the most direct links to and effects on demographic trends in Kenya during the past 30 years. These have included, in particular, large-scale expansions of the educational and health systems, massive investment in transport and communications infrastructure, and more recently, public sector promotion of family planning.
DEMOGRAPHIC CHANGE
Data Sources
Compared to many sub-Saharan African nations, Kenya is blessed with reasonably good demographic data going back to before independence in 1963 (Henin, 1987; United Nations Fund for Population Activities, 1979). The first conventional census of the population of Kenya took place in 1948. Prior to that, there had been administrative counts. At the 1948 census, ages were recorded only in broad classes and no information on births was collected. However, in each district, certain areas that included approximately 10 percent of the population were selected as representative of the district. For each woman in the selected areas, the total children born to her, the number who died, and the deaths under I year of age were recorded.
In the 1962 and 1969 censuses, the detailed information was collected from samples of the population and in all cases these were probability samples. The only questions in the general census were on tribe, sex, and whether the respondent was an adult or a child; the expanded questionnaire
collected reports of age in years, births to adult women, and number of living children to adult women. In the 1969 expanded schedule, mothers were asked the number of children born to them now living with them, the number living elsewhere, and the number who had died. Questions on whether mothers and fathers were still alive, for the estimation of adult mortality, were used in a Kenya census for the first time. The information collected at the 1979 census was almost the same as in 1969 but there was no sampling. The general schedule included the questions in the expanded questionnaire of 1969, as well as items on relationships to head of household, sex, age, tribe, birthplace, marital status, education, and residence a year previously. It included questions on whether parents were still alive and, for females aged 12 years or more, details as in 1969 on children born and died. The 1989 census schedule and organization were the same as in 1979, but with an additional question on literacy and a section on economic activity, covering employment in the previous week, main occupation, and work status. There was also a series of items on housing conditions. However, at the time of preparation of this report, only the preliminary counts of numbers by district for 1989 have been released.
The main sources of data on fertility and mortality trends are the censuses and a series of household surveys carried out from the 1970s on. These include several programs that did not cover the entire country, for example, the POPLAB project, an experimental dual-record system for recording vital events, undertaken by the Central Statistical Bureau with financial and technical assistance from the United States from 1973 to 1976, and the Rural Household Budget Survey of 1982. Data from these are not examined here. There were four major country-wide surveys: the National Demographic Survey (NDS) in three rounds, 1977, 1978, and 1983; the Kenya Fertility Survey (KFS) of 1977–1978; the Kenya Contraceptive Prevalence Survey (KCPS) of 1984; and the Kenya Demographic and Health Survey (KDHS) of 1988–1989. All of these projects used the master sample frame of the Central Bureau of Statistics. This frame covers the entire country, with the exception of the three districts of Northeastern Province, Samburu and Turkana in Rift Valley Province, and Isiolo and Marsabit in Eastern Province. Although these are large areas, the population residing there is mainly nomadic and small in number—about 5 percent of the total in 1989 (Kenya National Council for Population and Development, and Institute for Resource Development, 1989). An inspection of the fertility and child mortality measures for these districts, as reported at the earlier censuses, suggests that their omission from the national aggregates of the surveys leads to insignificant biases.
The NDS covered a probability sample of approximately 100,000 persons in both urban and rural areas. The fertility and mortality questions in the NDS were basically identical to those of the 1969 and 1979 censuses.
The KFS covered a sample of 8,100 women. The procedures used were those common to all the countries participating in the World Fertility Survey program (Kenya, 1980). Only female interviewers were used, and they obtained answers directly from the women selected in the sample; proxy answers by their husbands or other members of the household were not accepted. The survey used a detailed questionnaire that was translated into the major tribal languages. The interviewers were thus provided with the exact wording of the questions in contrast to the censuses and the NDS for which they worked from schedules printed in English. The questions on fertility and child mortality were in the form of a detailed birth history that required the date of each birth, the sex of the child, and if applicable, the date of death.
The KCPS of 1984 was a project in the series of investigations in selected developing countries coordinated by Westinghouse Health Systems. The organization and conduct of the fieldwork were undertaken by the Central Bureau of Statistics as part of its National Sample Survey Programme, which also included the NDS and the KFS. The 6,581 women interviewed were asked about births and deaths of children but not about individual detail of dates except for the last born.
The KDHS was a part of the Demographic and Health Survey program (Kenya National Council for Population and Development, and Institute for Resource Development, 1989), which was the successor to the World Fertility Survey. The questionnaires and fieldwork methods of the former evolved from the latter. Essentially the same information on population dynamics was obtained by similar procedures, but there was considerably more detail in the KDHS schedule on contraceptive usage and child health. Completed questionnaires were collected from 7,150 women. Because of the continuity in aims, design, and field methods between the KFS and the KDHS, it is to be expected that comparisons of the two sets of results will not be distorted by operational differences.
Census and Survey Results
Table 2-2 gives the census counts of the population and the intercensal growth rates. There is evidence of differential undercoverage, but it is not adequate for reliable adjustments to be made. The population size from the 1948 census was much larger than the then-current estimate based on the earlier counts updated by an assumed growth rate. How much of the discrepancy was due to undercounts and how much to an erroneous growth rate cannot be determined. It is probable that part of the high growth rate recorded for 1948–1962 was due to the improved completeness of the census, but there is no reason to doubt the rapid expansion of the population recorded from 1962 onward.
TABLE 2-2 Population Size and Growth Rates
|
|
Population (thousands) |
Annual Intercensal Growth Rate (%) |
||
|
Census Year |
Males |
Females |
Total |
|
|
1948 |
2,680 |
2,726 |
5,406 |
— |
|
1962 |
4,277 |
4,359 |
8,636 |
3.34 |
|
1969 |
5,482 |
5,460 |
10,943 |
3.38 |
|
1979 |
7,607 |
7,720 |
15,327 |
3.37 |
|
1989a |
NA |
NA |
21,397 |
3.34 |
|
NOTE: NA = not available. a Provisional. |
||||
International migration has made only a small contribution to population growth. The dynamics of change are driven by the balance of births over deaths. The major element that is missing in any attempt to trace this balance over time is a reliable estimate of the course of adult mortality. The measures that have been calculated from the reports of orphanhood at the 1969 and 1979 censuses are restricted in period and uncertain in accuracy. Levels of child mortality and fertility can be determined with fair confidence from the 1950s onward, but with a degree of precision that steadily improves toward the 1970s.
Table 2-3 presents population sizes for 1979 and 1989, plus the intercensal growth rate and population density for each of the districts and provinces of Kenya. Table 2-4 presents estimates of the underlying components of population growth at the national level from 1940 to 1989 in terms of the crude birth and death rates. There is a rising trend in the rate of natural increase (birth rate minus death rate) from the 1940s, reaching a peak in 1975–1979 and declining in the most recent past. The crude death rate declined steadily, but only recently has the crude birth rate begun to do so. The intercensal growth rate and increase in density from 1979 to 1989 reported in Table 2-3 are 3.3 and 40.7 percent, respectively, but the 1989 figures are preliminary and have not been adjusted for underenumeration. Presumably the final, adjusted intercensal growth rate will be somewhat higher. The rate of 3.3 percent for the most recent past—that is, at the end of this intercensal period—would not appear to be too far out of line. In any case, the earlier trend was clear and, thanks to the availability of estimates such as these, this trend became known to Kenyan government policymakers. The first indications of a rising trend in population growth in the 1960s undoubtedly helped spur the adoption of a national population policy and program in 1972. Similarly, the later estimates of natural increase as high as 3.8 percent led to a renewed effort culminating in the creation of the National
TABLE 2-3 Kenya's Current and Recent Past Population
|
Province/District |
Population, 1979 (thousands) |
Provisional Population, 1989 (thousands) |
Intercensal Growth Rate (%) |
Density Per Km2, 1979 |
Provisional Density Per Km2, 1989 |
|
Nairobi |
828 |
1,346 |
4.86 |
1,211 |
1,968 |
|
Central |
|
|
|
|
|
|
Kiambu |
686 |
914 |
2.87 |
280 |
373 |
|
Kirinyaga |
291 |
388 |
2.88 |
203 |
270 |
|
Muranga |
648 |
846 |
2.67 |
262 |
342 |
|
Nyeri |
486 |
613 |
2,32 |
148 |
187 |
|
Nyandarua |
233 |
349 |
4.04 |
66 |
99 |
|
Total |
2,344 |
3,110 |
2.83 |
178 |
236 |
|
Coast |
|
|
|
|
|
|
Kilifi |
431 |
611 |
3.49 |
35 |
49 |
|
Kwale |
288 |
384 |
2.88 |
35 |
47 |
|
Lamu |
42 |
57 |
3.05 |
6 |
9 |
|
Mombasa |
341 |
467 |
3.14 |
1,624 |
2,224 |
|
Taita Taveta |
148 |
202 |
3.11 |
9 |
12 |
|
Tana River |
92 |
129 |
3.38 |
2 |
3 |
|
Total |
1,342 |
1,850 |
3.21 |
16 |
22 |
|
Eastern |
|
|
|
|
|
|
Embu |
263 |
358 |
3.08 |
97 |
132 |
|
Isiolo |
43 |
70 |
4.87 |
2 |
3 |
|
Kitui |
464 |
640 |
3.22 |
16 |
22 |
|
Machakos |
1,023 |
1,393 |
3.09 |
72 |
98 |
|
Marsabit |
96 |
125 |
2.64 |
1 |
2 |
|
Meru |
830 |
1,138 |
3.16 |
84 |
115 |
|
Total |
2,719 |
3.724 |
3.15 |
18 |
24 |
|
Northeastern |
|
|
|
|
|
|
Garissa |
129 |
124 |
-0.40 |
3 |
3 |
|
Mandera |
106 |
123 |
1.49 |
4 |
5 |
|
Wajir |
139 |
125 |
-1.06 |
2 |
2 |
|
Total |
374 |
372 |
-0.05 |
3 |
3 |
|
Province/District |
Population, 1979 (thousands) |
Provisional Population, 1989 (thousands) |
Intercensal Growth Rate (%) |
Density Per Km2, 1979 |
Provisional Density Per Km2, 1989 |
|
Nyanza |
|
|
|
|
|
|
Kisii |
870 |
1,146 |
2.76 |
396 |
522 |
|
Kisumu |
482 |
674 |
3.35 |
232 |
324 |
|
Siaya |
475 |
643 |
3.03 |
187 |
254 |
|
South Nyanza |
818 |
1,095 |
2.92 |
143 |
192 |
|
Total |
2,645 |
3,558 |
2.97 |
211 |
284 |
|
Rift Valley |
|
|
|
|
|
|
Kajiado |
149 |
262 |
5.64 |
6 |
10 |
|
Kericho |
633 |
859 |
3.05 |
107 |
176 |
|
Laikipia |
135 |
213 |
4.56 |
31 |
45 |
|
Nakuru |
523 |
862 |
5.00 |
30 |
57 |
|
Nandi |
299 |
440 |
3.86 |
74 |
104 |
|
Narok |
210 |
402 |
6.49 |
8 |
11 |
|
Baringo |
204 |
286 |
3.38 |
14 |
25 |
|
Elgeyo Marakwet |
149 |
212 |
3.53 |
233 |
316 |
|
Samburu |
77 |
114 |
3.92 |
4 |
5 |
|
Trans-Nzoia |
260 |
394 |
4.16 |
105 |
160 |
|
Turkana |
143 |
179 |
2.25 |
2 |
3 |
|
Uasin Gishu |
301 |
440 |
3.80 |
80 |
116 |
|
West Pokot |
159 |
231 |
3.74 |
31 |
46 |
|
Total |
3,242 |
4,894 |
4.12 |
19 |
29 |
|
Western |
|
|
|
|
|
|
Bungoma |
504 |
731 |
3.72 |
164 |
238 |
|
Busia |
298 |
423 |
3.50 |
183 |
260 |
|
Kakamega |
1,031 |
1,389 |
2.98 |
293 |
395 |
|
Total |
1,833 |
2,543 |
3.27 |
223 |
309 |
|
National total |
15,327 |
21,397 |
3.34 |
27 |
38 |
|
SOURCE: Kenya (1991a). |
|||||
TABLE 2-4 Vital Rates per 1,000 Population
|
Period |
Crude Birth Rate |
Crude Death Rate |
Natural Increase |
|
ca. 1940a |
40 |
25 |
15 |
|
1958–1962a |
48 |
20 |
28 |
|
1965–1969a |
50 |
17 |
33 |
|
1975–1979a |
52 |
14 |
38 |
|
1985–1989b |
45 |
11 |
34 |
|
a Approximate estimates from census data for recent preceding period. b Provisional estimates from KDHS. |
|||
Council on Population and Development, and numerous new initiatives in the 1980s. Better data and analysis influenced policy and program development in Kenya in a nearly textbook fashion.
Table 2-5 examines more closely the underlying vital processes of fertility and mortality. The total fertility rates (TFRs) shown in Table 2-5 suggest an increase from before the 1960s to the 1970s, after which fertility plateaued and then began falling in the 1980s. There is some doubt about this early upward movement, however. A detailed, unpublished examination of fertility in Kenya, undertaken in the early 1980s, concluded that fertility had been essentially constant for the previous 15 to 20 years at a TFR of roughly 8.0 children per woman (Panel on Tropical Africa, 1981). The apparent increase, this study argued, was due to the improved accuracy of data. On the other hand, the study did find evidence of slight increases in fertility in some regions, notably the coast, as well as slight declines in others, and therefore, slight changes in the overall TFR could not be totally ruled out. An increase would, moreover, be consistent with increases in
TABLE 2-5 Measures of Fertility and Mortality
|
Period |
Total Fertility Rate |
Probability of Dying by Age 5 (per 1,000) |
Life Expectancy at Birth (years) |
|
ca. 1940a |
5.5 |
270 |
37 |
|
1958–1962a |
7.0 |
220 |
43 |
|
1965–1969a |
7.6 |
190 |
49 |
|
1975–1979a |
7.9 |
150 |
54 |
|
1985–1989b |
6.7 |
110 |
NA |
|
NOTE: NA = not available. a Approximate estimates from census data for recent preceding period. b Provisional estimates from KDHS. |
|||
nutrition and prenatal health care, and reduced fetal mortality, all of which were presumably occurring during this period. These changes in fertility 20 years ago are mainly of academic interest, however, since they seem to have little bearing on present or future trends.
Fertility began to fall in the 1980s. The 1984 KCPS gave an indication of this change with a reported TFR of 7.7 compared to previous estimates of close to 8.0. The 1984 data showed that contraceptive attitudes, knowledge, and practice were also in the process of change. The 1989 KDHS made clear that these changes continued and accelerated in the most recent past, which surprised many knowledgeable observers. The apparent constancy or even increases of fertility in the earlier data had led to a conventional wisdom that fertility in Kenya was high and would remain high (Frank and McNicoll, 1987). This point of view saw Kenya, and most of sub-Saharan Africa, as being staunchly pronatalist and anti-family planning, and unlikely to change for years to come. The recent data from Kenya being considered here would seem to provide a refutation of this argument (Robinson, 1992). This recent evidence, and the KDHS in particular, are considered at length in Chapter 4.
Let us turn now to the mortality trends shown in Table 2-5. The child mortality rate has fallen by 50 percent in the last 30 years, and expectation of life at birth has increased by roughly one-third. These trends are reflected, as we have seen, in the steady decline in the crude death rate (Table 2-4). Even if one accepts that fertility may have risen slightly in the past, it has clearly been this rapid, sustained decline in mortality that has generated the explosive growth rates of the Kenyan population in the last several decades. In sum, Kenya has undergone the first phase of a classic demographic transition, declining mortality coupled with relatively constant fertility. This phase would now appear to be complete, because future mortality declines will be more modest and therefore not affect the overall growth rate as much. Fertility is now the crucial process governing growth.
It is important to include here information on the trends in the contraceptive prevalence rate over this longer-term period. Table 2-6 presents the relevant data for the three most recent surveys, which cover some 15 years. In 1988–1989, 27 percent of married women in Kenya were using a contraceptive method, compared to 17 percent in 1984 and 6 percent in 1977–1978. Contraceptive prevalence increased almost fourfold over 12 years. The KDHS showed a shift from traditional toward modern methods of contraception. Nearly all of the increase between 1984 and 1989 was in the use of modern methods, which now account for two-thirds of all use.
The other indicators of knowledge and attitudes about family planning also showed considerable change over the 12-year period. In 1988–1989, 40 percent of all women reported having ever used contraception, compared to 30 percent in 1984. Almost 90 percent were familiar with at least one
TABLE 2-6 Indicators of Family Planning Knowledge, Attitude, and Practice in Kenya
|
Indicators |
1977–1978 KFS |
1984 KCPS |
1988–1989 KDHS |
|
Current use of any method (%)a |
5.6 |
17.0 |
27.0 |
|
Current use of modern methods (%)a |
4.3 |
9.0 |
18.0 |
|
Ever use of any method (%)b |
29.0 |
29.0 |
39.0 |
|
Knows any method (%)b |
81.0 |
88.0 |
90.0 |
|
Knows a modern method (%)b |
84.0 |
83.0 |
88.4 |
|
Currently pregnant (%)b |
13.0 |
11.0 |
8.9 |
|
Desires no more children (%)a |
32.0 |
41.0 |
49.4 |
|
Mean ideal family size (number of children)b |
6.2 |
5.8 |
4.4 |
|
a Among currently married women. b Among all women. SOURCES: Kenya (1980, 1986); Kenya National Council for Population and Development, and Institute for Resource Development (1989). |
|||
modern method and also knew where to obtain such a method, and this level of knowledge is true for both husbands and wives (data not shown). Some 90 percent of both husbands and wives approved of the use of family planning. This congruence of attitudes of husbands and wives extended also to childbearing desires and intentions. Roughly half of both groups reported that they wanted no more children. Ideal family size for both groups was about 4.4 children, compared to 5.8 as recently as 1984. Thus, there is a clear picture of widespread awareness and approval of family planning, and of sharply increasing (and also more efficient) use of contraception.
We complete this overview of the main demographic trends in Kenya with a brief look at the population distribution. Table 2-7 shows the number of urban centers (defined as having more than 2,000 inhabitants) in Kenya for the four most recent census years, the growth rate of the urban population, and the percentage of the population living in urban centers. In general, the proportion living in urban areas is low, even in the most recent census, but the rate of growth is considerably higher than the national rate of growth, which suggests that considerable rural to urban migration has been under way. Nairobi dominates the urban hierarchy and accounts for some 40 percent of the total urban population (data not shown). Nairobi has a drawing power that reaches throughout the country, although the majority of its migrants still appear to come from the Central and Eastern provinces. Kisumu is the urban growth pole for the Western Province (the
TABLE 2-7 National Trends in Urbanization in Kenya Since 1962
|
Trend |
1962 |
1969 |
1979 |
1989a |
|
Total urban centerb population (thousands) |
748 |
1,080 |
2,309 |
3705 |
|
Average annual rate of growth in population in urban centers between censuses |
NA |
5.4 |
7.6 |
4.7 |
|
Population living in urban centers (%) |
9 |
10 |
15 |
17 |
|
Number of urban centers |
34 |
47 |
92 |
124 |
|
Percentage of urban population living in Nairobi and Mombasa |
70 |
70 |
51 |
49 |
|
Percentage of districts having urban population of |
|
|
|
|
|
<5% |
NA |
27 |
14 |
10 |
|
5–19% |
NA |
9 |
19 |
21 |
|
>20% |
NA |
5 |
8 |
10 |
|
NOTE: NA = not available. a Provisional results from 1989 census. b Defined as having more than 2,000 inhabitants. SOURCE: Government of Kenya, Central Bureau of Statistics, data contributed for this report. |
||||
Lakes region) and Mombasa for the coast and northeast (see Shapiro, 1991, for more information on migration).1
SUMMARY
Kenya has experienced enormous economic and social changes in the 30 years since independence. Early economic success provided opportunities that have been taken. This bright beginning has become cloudy in the recent period. External shocks such as rising oil prices and falling prices of coffee have hurt the economy, and an apparent loss of domestic monetary and fiscal control has shaken donor confidence in the government's credibility. Even with past economic growth there is substantial poverty in Kenya, and social progress has brought rising expectations on the part of the Kenyan population. Distribution of income is almost certainly no less
unequal than before, and for large segments of the population, per capita income has probably declined in the last 5 years. Because it will be many years before decreasing fertility brings a decline in new labor force entrants, employment creation will be a continuing problem in Kenya. The Kenyan economy is at an important turning point.
Demographically, Kenya seems well launched into its transition. Mortality has fallen and fertility now seems to be following, but overall growth remains rapid. Economic and social changes have led the way, with demographic changes following after a delay. Changes in the material conditions of life and also in the attitudes, aspirations, and motivations of the people seem to have been the driving forces behind the demographic changes. But government policies and programs have played a major role as well. Each of these factors is examined in later chapters.


