
5
Proximate Determinants of Fertility
From the analysis in Chapter 4, it is clear that fertility declined substantially between the times of the Kenya Fertility Survey (KFS, 1977–1978) and Kenya Demographic and Health Survey (KDHS, 1998–1989). This chapter takes a closer look at the proximate determinants that contributed to this decline by using the Bongaarts framework to quantify the effects on fertility of marriage patterns, contraception, postpartum infecundability, primary sterility, and abortion.
FRAMEWORK
Bongaarts et al. (1984) enumerated nine proximate determinants of fertility:
-
percentage of women in sexual union,
-
frequency of sexual intercourse,
-
postpartum abstinence,
-
lactational amenorrhea,
-
contraceptive use,
-
induced abortion,
-
spontaneous intrauterine mortality,
-
natural sterility, and
-
pathological sterility.
These factors are the behavioral and biological factors that influence fertility directly. Cultural, psychological, economic, social, health, and environ-
mental factors affect fertility indirectly through these proximate determinants.
Bongaarts and Potter (1983) quantified the effects of six of the nine proximate determinants of fertility that were shown to have the greatest effect on fertility in 41 populations: percentage of women in sexual union, postpartum abstinence and lactational amenorrhea (taken together), contraceptive use, abortion, and pathological sterility. They summarized the effect of each determinant on fertility in an index, which generally ranges from 0 to 1, with 0 having the greatest inhibiting effect on fertility and I having the least inhibiting effect (i.e., the lower the index, the more it reduces fertility). Each index (not equal to 1) reduces the total fecundity rate (TF), which is the level of fertility expected in the absence of any of the nine proximate determinants outlined above. Of course, no one knows what TF really is, but Bongaarts and Potter (1983) estimated that it ranges from 13 to 17, with an average of approximately 15, Below is a description of each of the proximate determinants used in this analysis and how they affect fertility. The computational procedures used to estimate each index are described in the appendix to this chapter.
Percentage of Women in Sexual Union
It is assumed that the number of women of reproductive age married or living with someone determines the proportion of women in a society exposed to the risk of becoming pregnant. The greater the number of women exposed, the higher is the resulting fertility. In sub-Saharan Africa, entry into union1 has generally occurred at an early age, and although union dissolution is frequent in many regions, remarriage occurs rapidly (Cochrane and Farid, 1989). Kenya has been no exception to this general pattern. Table 5-1 shows the median age at first union for women 20 to 49 years. In 1977–1978 the median age at first union at the national level was 17.5 years. At the province level, Coast Province had the lowest age at first union, 16.4; followed closely by Nyanza, 16.5; and Western, 16.8. As expected, Nairobi had the highest age at first union, 19.1; with Central, 18.8, and Eastern, 18.7, not far behind.
Results from the KDHS show that age at first marriage has risen across all provinces, ranging from an increase of 0.4 year for Nyanza to 1.1 years for Nairobi, Central, and Western provinces. At the national level, age at
TABLE 5-1 Median Age at First Marriagea Among Women Age 20–49 by Subgroup, 1977–1978 KFS and 1988–1989 KDHS (years)
first union increased by one year to 18.5. Among other sub-Saharan African populations, where the Demographic and Health Surveys (DHS) were conducted, age at first union ranges from 15.7 in Mali to 19.7 in Ondo State, Nigeria, placing Kenya toward the upper end of these two extremes. Furthermore, there are other indications that age at first union is increasing in Kenya; younger women are marrying at older ages. As indicated in Table 5-1, for women age 20 to 24 the median age at first union in 1989 was 19.8 years.
The index measuring the effect of marriage patterns on fertility is denoted as Cm. It takes the value of 1 when all women of reproductive age are in union and 0 when none are in union.
Contraception
Use of contraception to delay or limit the number of children born clearly affects a society's fertility level. Historically, contraceptive use in sub-Saharan Africa, including Kenya, has been very low. However, substantial increases in the use of contraception have been identified in Kenya, Botswana, and Zimbabwe on the basis of data from the DHS (Jolly and Gribble, 1993; Working Group on Factors Affecting Contraceptive Use, 1993).
Tables 5-2 and 5-3 show contraceptive prevalence rates by subgroup and specific method used for Kenya at the times of the KFS and the KDHS, respectively. In 1977–1978, contraceptive use was very low, with only 5.6
TABLE 5-2 Women Currently in Union Using Contraception by Subgroup, 1977–1978 KFS (percent)
|
Subgroup |
Any Method |
Pill |
IUD |
Injection |
Vaginal Method |
Condom |
Female Sterilization |
Periodic Abstinence |
Withdrawal |
Other |
|
National |
5.6 |
2.0 |
0.7 |
0.6 |
0.0 |
0.1 |
0.9 |
1.1 |
1.1 |
0.0 |
|
15–24 |
3.9 |
2.0 |
0.2 |
0.1 |
0.0 |
0.2 |
0.0 |
1.2 |
0.1 |
0.1 |
|
25–34 |
6.6 |
2.6 |
0.9 |
0.7 |
0.0 |
0.1 |
0.9 |
1.2 |
0.1 |
0.1 |
|
35–49 |
5.9 |
1.4 |
0.8 |
O.8 |
0.1 |
0.1 |
1.4 |
0.9 |
0.2 |
0.2 |
|
Residence |
|
|
|
|
|
|
|
|
|
|
|
Rural |
4.7 |
1.6 |
0.5 |
0.5 |
0.0 |
0.1 |
0.8 |
1.1 |
0.1 |
0.0 |
|
Urban |
11.6 |
5.1 |
1.9 |
1.4 |
0.0 |
0.2 |
1.4 |
1.3 |
0.2 |
0.1 |
|
Education |
|
|
|
|
|
|
|
|
|
|
|
None |
3.2 |
0.7 |
0.4 |
0.3 |
0.0 |
0.1 |
0.7 |
0.8 |
0.2 |
0.0 |
|
1–4 years |
5.4 |
1.3 |
0.8 |
0.9 |
0.1 |
0.1 |
0.7 |
1.5 |
0.0 |
0.0 |
|
5–7 years |
7.5 |
3.4 |
0.7 |
0.6 |
0.0 |
0.2 |
0.8 |
1.2 |
0.3 |
0.3 |
|
8+ years |
18.4 |
9.6 |
2.6 |
1.4 |
0.0 |
0.5 |
2.5 |
1.8 |
0.0 |
0.0 |
|
Parity |
|
|
|
|
|
|
|
|
|
|
|
0 |
1.1 |
0.1 |
0.0 |
0.0 |
0.0 |
0.0 |
0.5 |
0.3 |
0.0 |
0.2 |
|
1 |
2.4 |
1.2 |
0.1 |
0.0 |
0.0 |
0.2 |
0.0 |
0.8 |
0.0 |
0.1 |
|
2 |
4.7 |
2.5 |
0.4 |
0.0 |
0.0 |
0.3 |
0.5 |
0.9 |
0.0 |
0.1 |
|
3 |
5.6 |
2.4 |
0.3 |
0.2 |
0.0 |
0.0 |
0.6 |
1.6 |
0.3 |
0.2 |
|
4+ |
7.0 |
2.2 |
1.1 |
1.0 |
0.0 |
0.1 |
1.2 |
1.2 |
0.2 |
0.0 |
|
Province |
|
|
|
|
|
|
|
|
|
|
|
Nairobi |
15.9 |
7.3 |
2.6 |
2.1 |
0.0 |
0.1 |
2.0 |
1.5 |
0.0 |
0.3 |
|
Central |
9.0 |
3.3 |
2.1 |
1.4 |
0.0 |
0.2 |
0.7 |
0.9 |
0.4 |
0.0 |
|
Coast |
4.4 |
1.6 |
0.3 |
1.0 |
0.0 |
0.0 |
1.0 |
0.4 |
0.1 |
0.0 |
|
Eastern |
6.8 |
2.3 |
1.2 |
0.1 |
0.1 |
0.6 |
1.3 |
0.8 |
0.4 |
0.0 |
|
Nyanza |
3.1 |
0.9 |
0.1 |
0.3 |
0.0 |
0.0 |
0.3 |
1.5 |
0.0 |
0.0 |
|
Rift Valley |
5.5 |
1.5 |
0.1 |
0.5 |
0.0 |
0.0 |
1.3 |
1.9 |
0.2 |
0.0 |
|
Western |
2.9 |
1.5 |
0.1 |
0.0 |
0.0 |
0.0 |
0.5 |
0.1 |
0.0 |
0.7 |
TABLE 5-3 Women Currently in Union Using Contraception by Subgroup, 1988–1989 KDHS (percent)
|
Subgroup |
Any Method |
Pill |
IUD |
Injection |
Vaginal Methods |
Condom |
Female Sterilization |
Periodic Abstinence |
Withdrawal |
Other |
|
National |
26.8 |
5.2 |
3.7 |
3.3 |
0.4 |
0.5 |
4.7 |
7.5 |
0.2 |
1.3 |
|
15–24 |
18.4 |
6.3 |
2.0 |
0.9 |
0.1 |
0.8 |
0.5 |
6.8 |
0.2 |
0.8 |
|
25–34 |
28.4 |
6.7 |
4.1 |
4.2 |
0.4 |
0.5 |
3.3 |
7.4 |
0.3 |
1.5 |
|
35–49 |
30.7 |
2.9 |
4.4 |
3.9 |
0.7 |
0.2 |
9.0 |
8.0 |
0.2 |
1.4 |
|
Residence |
|
|
|
|
|
|
|
|
|
|
|
Rural |
26.0 |
4.3 |
2.9 |
3.4 |
0.4 |
0.4 |
4.9 |
8.1 |
0.2 |
1.4 |
|
Urban |
30.5 |
9.8 |
8.0 |
2.8 |
0.5 |
0.8 |
3.6 |
4.0 |
0.4 |
0.6 |
|
Education |
|
|
|
|
|
|
|
|
|
|
|
None |
18.3 |
2.1 |
1.3 |
2.2 |
0.1 |
0.3 |
3.7 |
6.9 |
0.0 |
1.7 |
|
1–4 years |
25.5 |
4.3 |
2.7 |
4.3 |
0.6 |
0.1 |
6.0 |
6.6 |
0.0 |
0.9 |
|
5–7 years |
29.4 |
6.2 |
3.5 |
4.7 |
0.3 |
0.3 |
4.9 |
7.7 |
0.4 |
1.4 |
|
8+ years |
37.9 |
9.2 |
8.8 |
2.2 |
1.1 |
1.4 |
4.8 |
9.0 |
0.6 |
0.8 |
|
Parity |
|
|
|
|
|
|
|
|
|
|
|
0 |
4.6 |
0.6 |
0.0 |
0.2 |
0.0 |
0.0 |
0.0 |
3.4 |
0.4 |
0.0 |
|
1 |
16.8 |
5.2 |
1.8 |
0.7 |
0.0 |
0.5 |
0.3 |
8.1 |
0.0 |
0.2 |
|
2 |
24.2 |
6.7 |
4.4 |
1.6 |
0.2 |
1.2 |
1.9 |
7.2 |
0.1 |
0.9 |
|
3 |
28.4 |
9.3 |
3.3 |
2.4 |
0.3 |
0.5 |
2.7 |
8.4 |
0.9 |
0.6 |
|
4+ |
31.4 |
4.3 |
4.4 |
4.8 |
0.7 |
0.4 |
7.1 |
7.7 |
0.1 |
1.9 |
|
Subgroup |
Any Method |
Pill |
IUD |
Injection |
Vaginal Methods |
Condom |
Female Sterilization |
Periodic Abstinence |
Withdrawal |
Other |
|
Province |
|
|
|
|
|
|
|
|
|
|
|
Nairobi |
33.6 |
11.8 |
7.9 |
2.3 |
1.2 |
0.4 |
4.4 |
4.0 |
0.8 |
0.8 |
|
Central |
39.7 |
8.1 |
10.0 |
3.6 |
0.3 |
1.3 |
7.7 |
7.1 |
0.3 |
1.3 |
|
Coast |
18.1 |
5.5 |
1.7 |
3.6 |
0.1 |
0.3 |
3.6 |
3.0 |
0.3 |
0.0 |
|
Eastern |
40.1 |
5.9 |
4.7 |
3.5 |
0.4 |
0.4 |
4.5 |
17.9 |
0.3 |
2.5 |
|
Nyanza |
13.7 |
2.7 |
0.8 |
2.5 |
0.0 |
0.3 |
3.9 |
3.0 |
0.0 |
0.5 |
|
Rift Valley |
29.6 |
3.6 |
2.3 |
5.3 |
1.0 |
0.5 |
5.5 |
9.0 |
0.3 |
2.1 |
|
Western |
13.7 |
3.8 |
1.6 |
1.6 |
0.2 |
0.2 |
2.6 |
3.0 |
0.0 |
0.7 |
|
District |
|
|
|
|
|
|
|
|
|
|
|
Bungoma |
9.3 |
2.7 |
1.5 |
0.5 |
0.0 |
0.3 |
1.3 |
1.1 |
0.0 |
1.9 |
|
Kakamega |
14.9 |
3.1 |
1.1 |
2.3 |
0.3 |
0.3 |
3.8 |
3.7 |
0.0 |
0.3 |
|
Kericho |
23.1 |
3.4 |
0.8 |
5.3 |
0.4 |
0.0 |
5.3 |
6.8 |
0.0 |
1.1 |
|
Kilifi |
10.8 |
4.6 |
0.6 |
2.5 |
0.3 |
0.3 |
0.8 |
1.4 |
0.3 |
0.0 |
|
Kirinyaga |
52.2 |
12.4 |
18.6 |
8.0 |
0.4 |
0.9 |
4.0 |
7.1 |
0.4 |
0.4 |
|
Kisii |
21.5 |
2.5 |
2.0 |
5.7 |
0.0 |
0.4 |
6.4 |
4.1 |
0.0 |
0.4 |
|
Kisumu |
17.9 |
4.8 |
1.0 |
3.0 |
0.0 |
0.0 |
5.3 |
3.5 |
0.0 |
0.3 |
|
Machakos |
40.4 |
5.3 |
1.4 |
1.1 |
0.0 |
0.7 |
3.5 |
24.5 |
0.7 |
3.2 |
|
Meru |
36.3 |
12.4 |
8.3 |
5.7 |
1.6 |
0.5 |
5.7 |
2.1 |
0.0 |
0.0 |
|
Mombasa |
24.4 |
8.8 |
5.4 |
2.0 |
0.0 |
0.7 |
4.1 |
2.7 |
0.7 |
0.0 |
|
Muranga |
33.9 |
3.8 |
10.5 |
3.0 |
0.4 |
1.3 |
7.5 |
6.6 |
0.4 |
0.4 |
|
Nakuru |
47.1 |
1.7 |
5.4 |
4.9 |
2.0 |
1.2 |
12.7 |
14.7 |
0.0 |
4.5 |
|
Nyeri |
40.7 |
9.2 |
9.1 |
2.5 |
0.4 |
0.8 |
12.6 |
5.3 |
0.4 |
0.4 |
|
Siaya |
8.4 |
0.6 |
0.0 |
1.2 |
0.0 |
1.2 |
2.4 |
2.4 |
0.0 |
0.6 |
|
South Nyanza |
6.1 |
2.0 |
0.0 |
0.0 |
0.0 |
0.0 |
1.4 |
2.0 |
0.0 |
0.7 |
|
Uasin Gishu |
13.4 |
3.8 |
0.5 |
3.8 |
0.0 |
0.0 |
1.0 |
3.3 |
0.5 |
0.5 |
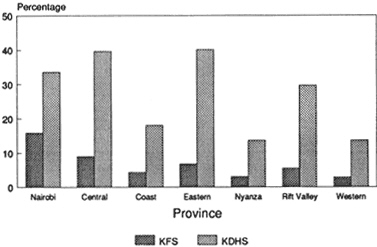
percent of all women in a union currently using any method.2 About one-fourth of the methods used were traditional (periodic abstinence or rhythm, withdrawal, and other). As in many other regions of the world, contraceptive use was higher for women who were living in urban areas and were well educated. Contraceptive use was also greater among women of higher parity. By 1988–1989, use of any method had increased substantially among women in union to 26.8 percent, with about one-third of these women using traditional methods. Contraceptive prevalence remained higher for women who were living in urban areas (30.5 percent), who were well educated (37.9 percent for women with more than 8 years of schooling), and who had given birth to more children (31.4 percent of women with four or more births).
Nairobi, Central, and Eastern provinces had the highest prevalence rates of the provinces at both times. Western and Nyanza had the lowest rates. Among the districts in 1988–1989, contraceptive use was highest in Kirinyaga (52 percent), followed by Nakuru (47.1 percent), Nyeri (40.7 percent), and Machakos (40.4 percent). Siaya and South Nyanza had very low prevalence rates, 8.4 and 6.1 percent, respectively.
The type of contraceptive used also varied by province. The pill was the most commonly used contraceptive in Nairobi, Coast, and Western provinces; sterilization in Nyanza Province; the IUD in Central Province; and periodic abstinence or rhythm in Eastern and Rift Valley provinces.
Cc, the index of contraception, measures the effect on fertility of the proportion of women using contraception, as well as the effectiveness of the methods used: Cc equals 1 if no contraception is used and 0 if all fecund women use modern methods that are 100 percent effective.
Postpartum Infecundability
The practices of breastfeeding and sexual abstinence after the birth of a child reduce a woman's exposure to becoming pregnant. Breastfeeding of long duration and on demand delays the return of a woman's normal pattern of ovulation. Cultural norms often prescribe limiting sexual relations after birth. In sub-Saharan Africa, both of these practices are utilized and are seen as necessary to protect the health of the child and the mother (van de Walle and van de Walle, 1988).
Tables 5-4 and 5-5 show the mean number of months of breastfeeding and postpartum amenorrhea, abstinence, and insusceptibility for currently married women by subgroup in Kenya at the times of the KFS and KDHS. In 1977–1978, the average duration of breastfeeding was 17.3 months, and the average duration of sexual abstinence was 3.9 months. In 1988–1989,
TABLE 5-4 Mean Number of Months of Breastfeeding, Postpartum Amenorrhea, Postpartum Abstinence, and Postpartum Insusceptibility for Currently Married Women by Subgroup, 1977–1978 KFS
|
Subgroup |
Months |
Weighted No. of Births |
|||
|
Breastfeeding |
Amenorrheic |
Abstaining |
Insusceptiblea |
||
|
National |
17.3 |
12.0 |
3.9 |
12.7 |
4,963 |
|
15–24 |
18.8 |
12.2 |
4.0 |
12.7 |
1,429 |
|
25–34 |
16.3 |
11.6 |
3.4 |
12.1 |
2,368 |
|
35–49 |
17.3 |
12.5 |
4.3 |
13.8 |
1,152 |
|
Residence |
|
|
|
|
|
|
Rural |
17.6 |
12.3 |
3.8 |
12.9 |
4,426 |
|
Urban |
14.7 |
10.0 |
4.2 |
10.5 |
537 |
|
Education |
|
|
|
|
|
|
None |
18.7 |
13.6 |
4.6 |
14.2 |
2,361 |
|
1–4 years |
16.7 |
12.1 |
3.7 |
12.8 |
1,016 |
|
5–7 years |
16.2 |
9.8 |
2.8 |
10.4 |
1,193 |
|
8+ years |
13.6 |
9.1 |
3.6 |
9.9 |
397 |
|
Province |
|
|
|
|
|
|
Nairobi |
14.8 |
10.3 |
4.3 |
10.6 |
225 |
|
15–24 |
17.1 |
11.9 |
5.7 |
12.7 |
101 |
|
25–34 |
13.1 |
9.0 |
3.4 |
9.0 |
106 |
|
35–49 |
12.1 |
8.3 |
1.4 |
8.3 |
18 |
|
Central |
14.5 |
10.5 |
2.7 |
11.0 |
749 |
|
15–24 |
16.5 |
9.4 |
2.7 |
10.1 |
154 |
|
25–34 |
13.5 |
10.6 |
2.4 |
10.9 |
367 |
|
35–49 |
14.7 |
11.1 |
3.0 |
11.9 |
228 |
|
Coast |
18.1 |
13.8 |
3.2 |
14.0 |
383 |
|
15–24 |
21.9 |
14.0 |
3.7 |
14.0 |
129 |
|
25–34 |
16.4 |
11.7 |
2.7 |
12.2 |
180 |
|
35–49 |
15.8 |
18.5 |
3.5 |
18.7 |
74 |
|
Eastern |
18.5 |
12.0 |
4.3 |
12.9 |
766 |
|
15–24 |
18.6 |
10.9 |
3.4 |
11.8 |
152 |
|
25–34 |
17.3 |
11.4 |
3.5 |
12.1 |
376 |
|
35–49 |
20.4 |
12.9 |
5.3 |
14.3 |
238 |
|
Nyanza |
17.7 |
12.3 |
2.9 |
12.9 |
1,125 |
|
15–24 |
18.6 |
13.4 |
3.1 |
13.6 |
357 |
|
25–34 |
17.5 |
11.9 |
2.6 |
12.2 |
490 |
|
35–49 |
17.2 |
11.8 |
3.2 |
13.3 |
274 |
|
Rift Valley |
17.6 |
13.1 |
6.6 |
14.0 |
988 |
|
15–24 |
19.7 |
13.8 |
6.4 |
14.2 |
300 |
|
25–34 |
16.8 |
12.4 |
6.0 |
13.3 |
486 |
|
35–49 |
16.5 |
13.8 |
8.4 |
15.9 |
193 |
|
Western |
17.9 |
11.3 |
2.8 |
11.8 |
702 |
|
15–24 |
18.3 |
10.2 |
3.2 |
10.6 |
231 |
|
25–34 |
16.9 |
12.2 |
2.6 |
12.5 |
345 |
|
35–49 |
19.3 |
10.7 |
1.6 |
11.6 |
125 |
|
a Estimated as the mean number of months of postpartum amenorrhea or abstinence, whichever is longer. |
|||||
TABLE 5-5 Mean Number of Months of Breastfeeding, Postpartum Amenorrhea, Postpartum Abstinence, and Postpartum Insusceptibility for Currently Married Women by Subgroup, 1988–1989 KDHS
|
Subgroup |
Months |
Weighted No. of Births |
|||
|
Breastfeeding |
Amenorrheic |
Abstaining |
Insusceptiblea |
||
|
National |
20.1 |
11.2 |
3.9 |
11.7 |
3,667 |
|
15–24 |
20.9 |
11.4 |
4.5 |
11.9 |
1,016 |
|
25–34 |
19.5 |
10.7 |
3.4 |
11.1 |
1,787 |
|
35–49 |
20.3 |
11.8 |
4.4 |
12.6 |
864 |
|
Residence |
|
|
|
|
|
|
Rural |
20.0 |
11.4 |
4.0 |
11.9 |
3,174 |
|
Urban |
20.3 |
9.7 |
3.4 |
10.1 |
493 |
|
Education |
|
|
|
|
|
|
None |
21.0 |
13.3 |
5.7 |
14.2 |
1,046 |
|
1–4 years |
19.8 |
12.0 |
4.1 |
12.4 |
598 |
|
5–7 years |
19.5 |
10.2 |
2.9 |
10.5 |
1,314 |
|
8+ years |
20.0 |
9.3 |
3.2 |
9.6 |
705 |
|
Province and District |
|
|
|
|
|
|
Nairobi |
21.7 |
9.7 |
4.2 |
10.3 |
208 |
|
15–24 |
22.3 |
10.7 |
4.5 |
11.6 |
98 |
|
25–34 |
20.9 |
8.8 |
3.8 |
9.1 |
92 |
|
35–49 |
23.1 |
9.0 |
5.2 |
9.0 |
18 |
|
Central |
19.2 |
11.1 |
4.2 |
11.6 |
464 |
|
15–24 |
21.2 |
11.8 |
6.2 |
12.0 |
119 |
|
25–34 |
19.0 |
10.8 |
3.4 |
11.2 |
231 |
|
35–49 |
17.5 |
10.9 |
4.0 |
12.0 |
114 |
|
Kirinyaga |
19.3 |
8.9 |
5.3 |
10.9 |
54 |
|
Muranga |
21.7 |
11.4 |
3.0 |
11.9 |
108 |
|
Nyeri |
16.5 |
9.0 |
3.9 |
9.6 |
141 |
|
Coast |
19.1 |
10.0 |
2.1 |
10.1 |
223 |
|
15–24 |
17.0 |
10.7 |
3.0 |
10.9 |
59 |
|
25–34 |
20.7 |
9.8 |
2.3 |
9.8 |
112 |
|
35–49 |
18.2 |
9.9 |
0.7 |
9.9 |
52 |
|
Kilifi |
19.5 |
9.9 |
1.7 |
10.1 |
88 |
|
Mombasa |
17.8 |
9.7 |
3.8 |
9.7 |
55 |
|
Eastern |
21.7 |
9.6 |
4.3 |
10.2 |
594 |
|
15–24 |
24.4 |
11.4 |
5.2 |
11.8 |
114 |
|
25–34 |
20.2 |
8.8 |
3.1 |
9.0 |
286 |
|
35–49 |
22.4 |
9.8 |
5.5 |
11.2 |
195 |
|
Machakos |
24.0 |
10.6 |
3.5 |
11.2 |
261 |
|
Meru |
21.6 |
10.0 |
4.9 |
10.5 |
146 |
|
Nyanza |
19.3 |
11.5 |
2.2 |
11.9 |
677 |
|
15–24 |
19.7 |
10.8 |
2.1 |
11.3 |
207 |
|
25–34 |
18.3 |
11.3 |
2.1 |
11.7 |
322 |
|
35–49 |
20.8 |
12.8 |
2.5 |
13.2 |
149 |
|
Kisii |
17.5 |
11.8 |
3.2 |
12.8 |
181 |
|
Subgroup |
Months |
Weighted No. of Births |
|||
|
Breastfeeding |
Amenorrheic |
Abstaining |
Insusceptiblea |
||
|
Nyanza— |
|
|
|
|
|
|
Kisumu |
21.0 |
9.1 |
2.8 |
9.3 |
208 |
|
Siaya |
19.7 |
13.2 |
1.6 |
13.5 |
94 |
|
South Nyanza |
19.0 |
12.9 |
0.8 |
13.1 |
193 |
|
Rift Valley |
19.5 |
12.1 |
6.3 |
12.9 |
850 |
|
15–24 |
20.0 |
12.8 |
7.4 |
13.3 |
235 |
|
25–34 |
19.4 |
11.1 |
6.1 |
12.0 |
411 |
|
35–49 |
19.1 |
13.2 |
5.2 |
14.1 |
203 |
|
Kericho |
20.6 |
11.2 |
4.9 |
12.3 |
179 |
|
Nakuru |
17.1 |
10.4 |
3.3 |
10.4 |
113 |
|
Uasin Gishu |
20.2 |
10.8 |
4.4 |
11.1 |
64 |
|
Western |
20.4 |
12.1 |
2.8 |
12.3 |
651 |
|
15–24 |
21.2 |
10.8 |
2.3 |
11.2 |
184 |
|
25–34 |
19.5 |
12.2 |
2.1 |
12.2 |
333 |
|
35–49 |
21.6 |
13.6 |
5.0 |
14.0 |
134 |
|
Bungoma |
20.3 |
11.4 |
2.1 |
11.5 |
183 |
|
Kakamega |
19.3 |
10.8 |
2.6 |
11.0 |
361 |
|
a Estimated as the mean number of months of postpartum amenorrhea or abstinence, whichever is longer. |
|||||
breastfeeding had increased to 20.1 months, which is surprising given that many populations experience reductions in length of breastfeeding as they develop economically. Because amenorrhea, which is determined by the length of breastfeeding, decreased by almost 1 month over the same period, this increase in breastfeeding may be more an artifact of the data than a reflection of what actually occurred.3 The length of sexual abstinence did not change over time. By 1988–1989, the length of breastfeeding was approximately the same by type of residence and did not vary substantially across educational group. Length of amenorrhea and abstinence was longer in rural areas and among the least educated women.
The effect of postpartum amenorrhea and abstinence on fertility is measured by Ci, the index of postpartum infecundability.4 When there is no
lactation or postpartum abstinence, C1 equals 1; when infecundability is permanent, Ci equals 0.
Pathological or Primary Sterility
Primary sterility, or the inability of a woman to bear a child for biological reasons, has historically been high in sub-Saharan Africa, particularly in Central Africa (Frank, 1983; Bongaarts et al., 1984; Farley and Besley, 1988). In societies that value large families, such levels of sterility prevent some women who would like to bear children from doing so and lower the average level of fertility.
In this analysis, primary sterility is measured by the percentage of ever-married women age 40 to 49 who are childless. Table 5-6 gives the percentages for the KFS and KDHS. In 1977–1978, 3.1 percent of women were childless. Bongaarts et al. (1984) estimated that the standard rate of childlessness in developing countries is about 3 percent, indicating that Kenya was close to the standard and little excess sterility existed. However, there were substantial differentials among subgroups of the population. Urban areas demonstrated a very high level of primary sterility, with 9.7 percent childless. Primary sterility was higher among those women with no education than among those with some education. Nairobi and Coast provinces demonstrated fairly high levels of sterility, 8.2 and 7.2 percent, respectively.
TABLE 5-6 Women Aged 40–49 Who Are Childless by Subgroup, 1977–1978 and 1988–1989 (percent)
|
Subgroup |
1977–1978 |
1988–1989 |
|
National |
3.1 |
2.4 |
|
Residence |
|
|
|
Rural |
2.7 |
2.1 |
|
Urban |
9.7 |
5.6 |
|
Education |
|
|
|
None |
3.8 |
2.9 |
|
1–4 years |
1.5 |
1.9 |
|
5–7 years |
0.0 |
0.5 |
|
8+ years |
2.9 |
3.1 |
|
Province |
|
|
|
Nairobi |
8.2 |
4.4 |
|
Central |
1.3 |
1.9 |
|
Coast |
7.2 |
2.1 |
|
Eastern |
2.1 |
3.8 |
|
Nyanza |
4.3 |
2.6 |
|
Rift |
1.6 |
1.7 |
|
Western |
3.3 |
1.5 |
By 1988–1989, the national level of primary sterility decreased to 2.4 percent. Sterility remained higher among urban women than rural women and among those women with no education than women with 1 to 7 years of education. Primary sterility was still highest in Nairobi; however, levels dropped dramatically to 2.1 percent in the Coast Province. Levels rose in Eastern by 1.7 percentage points to 3.8 percent.
Primary sterility is measured by the Ip index. Its calculation is based on a 3 percent standard rate of childlessness. When the rate of childlessness exceeds 3 percent, Ip is less than 1, indicating that fertility is inhibited. If the rate of childlessness is less than 3 percent, Ip is greater than 1, indicating that primary sterility is lower than expected in a developing country. Because levels of primary sterility in Kenya are often close to 3 percent, the index has little explanatory value in this analysis. Accordingly, the index is omitted from many of the figures; however, it is retained in the tables.
Furthermore, it is worth emphasizing that the numbers used to estimate primary sterility were calculated from very small samples. Therefore, the reliability of the numbers, particularly for subgroups of the population, is questionable.5 The dramatic drop in sterility for Coast Province may reflect errors due to such small samples.
Abortion
There are very few data on abortion in Kenya, partly because the procedure is illegal except when a woman's life is in danger (Lema, 1990). However, some hospital data are available. In a study by Rogo (1990), it was noted that Kenyatta National Hospital in Nairobi treated 2,000 to 3,000 women for abortion complications in the late 1970s and early 1980s, and about 30 to 60 women a day, or 10,000 women a year, in 1990 (Jacobson, 1990). Lema et al. (1989) noted that 1, 100 women were treated for abortion and its complications in eight district hospitals over 6 months. Case histories of primarily low-income urban women gathered in a study by Baker and Khasiani (1992) implied that abortion is fairly common, particularly among single and unemployed women.
Robinson and Harbison (1993) used the data from Kenyatta National Hospital in 1990 and the district hospitals to estimate an abortion rate of 25 procedures per 1,000 women per year, assuming that for every woman admitted to a hospital for abortion complications, four other women attempted an abortion. In this analysis, we use this estimate for Ca, the index of abortion. Unfortunately, not enough data were available to attempt to esti-
mate an abortion rate for subgroups of the population; therefore, the national-level estimate is used for all subgroups as a very rough approximation of the effect of abortion on fertility, and the index is often omitted from the tables.
RESULTS
Tables 5-7 and 5-8 present the results of the proximate determinants analysis for the KFS and the KDHS. Figures 5-1 to 5-3 summarize the effects of marriage patterns, contraception, and postpartum infecundability on fertility for subgroups of the population.6 The results are described below in detail.
Marriage
The effect of marriage patterns on fertility is summarized in the index Cm. In 1977–1978, Cm was .91; in 1988–1989, Cm was .86 (the lower the index, the stronger is the fertility-inhibiting effect). Marriage patterns reduced fertility by about 0.9 birth at the time of the KFS and by about 1.1 births at the time of the KDHS (i.e., if marriage were universal for all women of reproductive age, the average observed total fertility rate would increase, ceteris paribus, by 1.1 births in 1988–1989).7 This strengthening of the fertility-inhibiting effect of marriage was due primarily to the increase in age at first union, described above. However, the change in Cm is not substantial or significant (reducing TF by only 0.2 birth), and it is important to note that significant childbearing occurs outside of union in Kenya, a fact that is not taken into account in calculating the Cm index. In fact, it has been estimated that age at first birth is lower than age at first marriage (Westoff, 1991a).
A similar pattern occurs across most of the subgroups: Changing marriage patterns have resulted in slightly lower fertility. Among the three age
groups (15–24, early; 25–34, middle; and 35–49, late), marriage patterns had their greatest effect in the early age group, reflecting greater proportions of women single than in the other age groups. Because of later entry into union for urban and well-educated women, Cm had the strongest effect in inhibiting fertility among these two groups. The urban-rural differential is not as pronounced in the KDHS as in the KFS, which suggests that marriage patterns are becoming more similar for women across types of residence. Differentials have also narrowed among educational groups.
In comparing Cm across provinces for the 1988–1989 data, marriage patterns had their greatest effect in Central Province (Cm = .79), followed by Nairobi (Cm = .83). They had their weakest effect in Eastern, Nyanza, and Western provinces. In 1977–1978, marriage patterns inhibited fertility most substantially in Nairobi, Eastern, and Central, in that order. At the district level, in 1988–1989, Kirinyaga and Meru had the lowest Cm (.79 for both).
Contraception
The dramatic increase in contraceptive use between 1977–1978 and 1988–1989 is reflected in a decrease in Cc from .95 to .76, or a reduction in fertility of about two births. The greater fertility-inhibiting effect of Cc is reflected across all subgroups. Although there was little variation in the effect of contraception among the three age groups in 1977–1978, differentials increased by 1989, when contraceptive use had its greatest effect on fertility among the middle and late age groups.8 These differentials indicate higher contraceptive prevalence, as well as use of more effective methods, among women 25 years and older.
As expected, contraception inhibits fertility most among urban and well-educated women. Although differentials did not change by type of residence between the two surveys, there was greater variation in Cc among educational groups in 1988–1989.
In 1988–1989 among the provinces, contraception had its greatest fertility-inhibiting effect in Central, Eastern, and Nairobi in that order, reflecting the highest contraceptive prevalence rates. These same three provinces had the lowest Cc in 1977–1978, but only Nairobi exhibited a very strong index (.85 versus indices greater than .92 for the other two). In 1988–1989,
TABLE 5-7 Proximate Determinants by Subgroup, 1977–1978
|
Subgroup |
Observed TFR |
Index of Marriage, Cm |
Index of Contraception, Cc |
Index of Postpartum Infecundability, Ci |
Index of Sterility, Ip |
Index of Abortion, Ca |
Model Estimate of Total Fecundity Rate, TF |
|
National |
8.15 |
.91 |
.95 |
.64 |
1.00 |
.92 |
16.1 |
|
15–24 |
2.61 |
.81 |
.97 |
.64 |
1.00 |
.92 |
5.6 |
|
25–34 |
3.22 |
.97 |
.94 |
.65 |
1.00 |
.92 |
5.9 |
|
35–49 |
2.32 |
.95 |
.95 |
.62 |
1.00 |
.92 |
4.6 |
|
Residence |
|
|
|
|
|
|
|
|
Rural |
8.36 |
.92 |
.96 |
.64 |
1.00 |
.92 |
16.2 |
|
Urban |
6.07 |
.84 |
.89 |
.69 |
.90 |
.92 |
14.1 |
|
Education |
|
|
|
|
|
|
|
|
None |
8.15 |
.96 |
.97 |
.61 |
.99 |
.92 |
15.8 |
|
1–4 years |
8.97 |
.93 |
.95 |
.64 |
1.02 |
.92 |
16.9 |
|
5–7 years |
7.91 |
.90 |
.93 |
.69 |
1.05 |
.92 |
14.2 |
|
8+ years |
6.95 |
.83 |
.83 |
.70 |
1.00 |
.92 |
15.7 |
|
Province |
|
|
|
|
|
|
|
|
Nairobi |
5.79 |
.82 |
.85 |
.69 |
.92 |
.92 |
14.2 |
|
15–24 |
2.16 |
.72 |
.93 |
.64 |
.92 |
.92 |
6.0 |
|
25–34 |
2.77 |
.90 |
.76 |
.73 |
.92 |
.92 |
6.5 |
|
35–49 |
.86 |
.88 |
.84 |
.75 |
.92 |
.92 |
1.9 |
|
Central |
8.54 |
.88 |
.92 |
.68 |
1.03 |
.92 |
16.6 |
|
15–24 |
2.37 |
.74 |
.93 |
.70 |
1.03 |
.92 |
5.2 |
|
25–34 |
3.44 |
.98 |
.92 |
.68 |
1.03 |
.92 |
6.0 |
|
35–49 |
2.73 |
.90 |
.92 |
.66 |
1.03 |
.92 |
5.3 |
|
Subgroup |
Observed TFR |
Index of Marriage, Cm |
Index of Contraception, Cc |
Index of Postpartum Infecundability, Ci |
Index of Sterility, Ip |
Index of Abortion, Ca |
Model Estimate of Total Fecundity Rate, TF |
|
Coast |
6.96 |
.96 |
.96 |
.62 |
.94 |
.92 |
14.2 |
|
15–24 |
2.55 |
.89 |
.97 |
.62 |
.94 |
.92 |
5.6 |
|
25–34 |
2.69 |
1.02 |
.95 |
.65 |
.94 |
.92 |
4.9 |
|
35–49 |
1.72 |
.99 |
.96 |
.54 |
.94 |
.92 |
3.9 |
|
Eastern |
8.22 |
.86 |
.94 |
.64 |
1.01 |
.92 |
17.2 |
|
15–24 |
2.35 |
.70 |
.94 |
.66 |
1.01 |
.92 |
5.8 |
|
25–34 |
3.24 |
.96 |
.93 |
.65 |
1.01 |
.92 |
5.9 |
|
35–39 |
2.63 |
.92 |
.94 |
.61 |
1.01 |
.92 |
5.4 |
|
Nyanza |
8.14 |
.95 |
.97 |
.64 |
.98 |
.92 |
15.4 |
|
15–24 |
2.77 |
.87 |
.99 |
.62 |
.98 |
.92 |
5.8 |
|
25–34 |
3.13 |
.99 |
.96 |
.65 |
.98 |
.92 |
5.6 |
|
35–49 |
2.24 |
1.01 |
.97 |
.63 |
.98 |
.92 |
4.0 |
|
Rift Valley |
8.78 |
.91 |
.95 |
.62 |
1.02 |
.92 |
17.6 |
|
15–24 |
2.89 |
.85 |
.97 |
.61 |
1.02 |
.92 |
6.1 |
|
25–34 |
3.35 |
.97 |
.94 |
.63 |
1.02 |
.92 |
6.2 |
|
35–49 |
2.54 |
.90 |
.94 |
.58 |
1.02 |
.92 |
5.5 |
|
Western |
8.02 |
.93 |
.97 |
.66 |
1.00 |
.92 |
14.7 |
|
15–24 |
2.78 |
.85 |
.97 |
.69 |
1.00 |
.92 |
5.3 |
|
25–34 |
3.39 |
.97 |
.99 |
.65 |
1.00 |
.92 |
6.0 |
|
35–49 |
1.85 |
.97 |
.95 |
.66 |
1.00 |
.92 |
3.3 |
TABLE 5-8 Proximate Determinants by Subgroup, 1988–1989
|
Subgroup |
Observed TFR |
Index of Marriage, Cm |
Index of Contraception, Cc |
Index of Postpartum Infecundability, Ci |
Index of Sterility, Ip |
Index of Abortion, Ca |
Model Estimate of Total Fecundity Rate, TF |
|
National |
6.62 |
.86 |
.76 |
.66 |
1.01 |
.92 |
16.5 |
|
15–24 |
2.34 |
.75 |
.84 |
.66 |
1.01 |
.92 |
6.1 |
|
25–34 |
2.70 |
.94 |
.75 |
.68 |
1.01 |
.92 |
6.1 |
|
35–49 |
1.58 |
.92 |
.72 |
.64 |
1.01 |
.92 |
4.0 |
|
Residence |
|
|
|
|
|
|
|
|
Rural |
6.98 |
.87 |
.77 |
.66 |
1.01 |
.92 |
17.0 |
|
Urban |
4.71 |
.82 |
.71 |
.70 |
.96 |
.92 |
13.1 |
|
Education |
|
|
|
|
|
|
|
|
None |
7.23 |
.91 |
.84 |
.61 |
1.00 |
.92 |
16.8 |
|
1–4 years |
7.65 |
.94 |
.77 |
.65 |
1.02 |
.92 |
17.4 |
|
5–7 years |
7.15 |
.88 |
.74 |
.69 |
1.04 |
.92 |
16.7 |
|
8+ years |
4.95 |
.82 |
.65 |
.71 |
1.00 |
.92 |
14.2 |
|
Province and District |
|
|
|
|
|
|
|
|
Nairobi |
4.48 |
.83 |
.68 |
.69 |
.98 |
.92 |
12.6 |
|
15–24 |
1.87 |
.73 |
.82 |
.66 |
.98 |
.92 |
5.2 |
|
25–34 |
1.77 |
.84 |
.64 |
.72 |
.98 |
.92 |
5.1 |
|
35–49 |
.84 |
1.17 |
.53 |
.73 |
.98 |
.92 |
2.1 |
|
Central |
5.83 |
.79 |
.63 |
.66 |
1.02 |
.92 |
18.7 |
|
15–24 |
1.92 |
.61 |
.74 |
.66 |
1.02 |
.92 |
7.0 |
|
25–34 |
2.53 |
.95 |
.64 |
.67 |
1.02 |
.92 |
6.6 |
|
35–49 |
1.38 |
.91 |
.58 |
.66 |
1.02 |
.92 |
4.3 |
|
Kirinyaga |
5.21 |
.79 |
.52 |
.68 |
1.02 |
.92 |
20.2 |
|
Muranga |
6.12 |
.87 |
.68 |
.66 |
1.02 |
.92 |
16.8 |
|
Nyeri |
6.47 |
.80 |
.61 |
.71 |
1.02 |
.92 |
19.9 |
|
Subgroup |
Observed TFR |
Index of Marriage, Cm |
Index of Contraception, Cc |
Index of Postpartum Infecundability, Ci |
Index of Sterility, Ip |
Index of Abortion, Ca |
Model Estimate of Total Fecundity Rate, TF |
|
Coast |
5.25 |
.85 |
.84 |
.70 |
1.01 |
.92 |
11.3 |
|
15–24 |
2.01 |
.81 |
.94 |
.68 |
1.01 |
.92 |
4.1 |
|
25–34 |
2.03 |
.89 |
.78 |
.71 |
1.01 |
.92 |
4.4 |
|
35–49 |
1.21 |
.86 |
.83 |
.70 |
1.01 |
.92 |
2.6 |
|
Kilifi |
6.55 |
.92 |
.90 |
.70 |
1.01 |
.92 |
12.1 |
|
Mombasa |
4.48 |
.93 |
.77 |
.71 |
1.01 |
.92 |
9.5 |
|
Eastern |
6.91 |
.90 |
.66 |
.70 |
.99 |
.92 |
18.4 |
|
15–24 |
2.26 |
.83 |
.74 |
.66 |
.99 |
.92 |
6.2 |
|
25–34 |
2.95 |
.96 |
.63 |
.73 |
.99 |
.92 |
7.4 |
|
35–39 |
1.70 |
.90 |
.65 |
.67 |
.99 |
.92 |
4.8 |
|
Machakos |
7.67 |
.93 |
.67 |
.67 |
.99 |
.92 |
20.3 |
|
Meru |
6.13 |
.79 |
.66 |
.69 |
.99 |
.92 |
18.7 |
|
Nyanza |
7.11 |
.90 |
.88 |
.66 |
1.01 |
.92 |
14.8 |
|
15–24 |
2.67 |
.82 |
.92 |
.67 |
1.01 |
.92 |
5.7 |
|
25–34 |
2.83 |
.97 |
.88 |
.66 |
1.01 |
.92 |
5.4 |
|
35–49 |
1.61 |
.93 |
.85 |
.63 |
1.01 |
.92 |
3.5 |
|
Kisii |
7.13 |
.86 |
.81 |
.64 |
1.01 |
.92 |
17.4 |
|
Kisumu |
7.87 |
.88 |
.83 |
.72 |
1.01 |
.92 |
16.0 |
|
Siaya |
6.53 |
.90 |
.93 |
.63 |
1.01 |
.92 |
13.5 |
|
South Nyanza |
6.98 |
1.01 |
.95 |
.63 |
1.01 |
.92 |
12.5 |
|
Rift Valley |
7.03 |
.86 |
.74 |
.64 |
1.02 |
.92 |
18.5 |
|
15–24 |
2.56 |
.73 |
.78 |
.63 |
1.02 |
.92 |
7.6 |
|
25–34 |
2.65 |
.93 |
.74 |
.66 |
1.02 |
.92 |
6.2 |
|
35–49 |
1.82 |
.97 |
.72 |
.61 |
1.02 |
.92 |
4.5 |
|
Kericho |
8.03 |
.90 |
.80 |
.65 |
1.02 |
.92 |
18.4 |
|
Nakuru |
6.92 |
.88 |
.58 |
.69 |
1.02 |
.92 |
20.8 |
|
Uasin Gishu |
6.36 |
.89 |
.89 |
.68 |
1.02 |
.92 |
12.7 |
|
Western |
7.76 |
.90 |
.88 |
.65 |
1.02 |
.92 |
16.2 |
|
15–24 |
2.72 |
.80 |
.95 |
.67 |
1.02 |
.92 |
5.6 |
|
25–34 |
3.41 |
.98 |
.86 |
65 |
1.02 |
.92 |
6.6 |
|
35–49 |
1.63 |
.91 |
.84 |
.62 |
1.02 |
.92 |
3.7 |
|
Bungoma |
8.27 |
.93 |
.92 |
.67 |
1.02 |
.92 |
15.5 |
|
Kakamega |
7.46 |
.90 |
.87 |
.68 |
1.02 |
.92 |
15.0 |
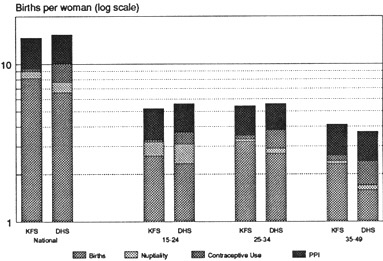
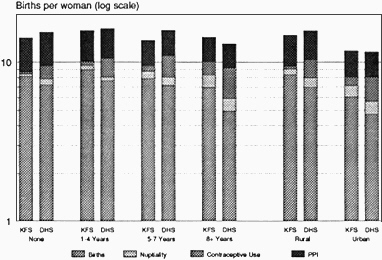
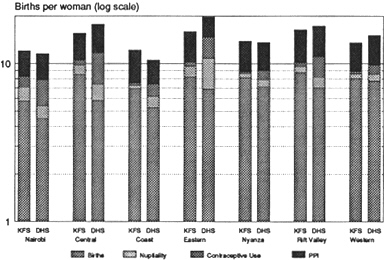
Figure 5-3 Proximate determinants by province, KFS and KDHS. Note: PPI,
Postpartum infecundability.
among the districts, Kirinyaga had an exceptionally low Cc (.52), followed by Nakuru (.58). South Nyanza, Siaya, Bungoma, and Kilifi showed relatively weak contraceptive use effects.
Postpartum Infecundability
The index of postpartum infecundability Ci had the greatest effect of all the indices at the national level. Ci remained relatively unchanged between the two surveys (.64 for KFS and .66 for KDHS) and reduced fertility by more than five births. Furthermore, little change in Ci is evident across subgroups, except for a weakening (increase in Ci) in Coast and Eastern provinces. Because of longer periods of postpartum amenorrhea and abstinence among rural and little-educated women, Ci had its greatest fertility-inhibiting effect in these two groups at both times. Its effect consistently weakens with increased education.
At both times, Western and Rift Valley provinces had the lowest Ci. Siaya, South Nyanza, and Kisii, all in Nyanza Province, had the longest nonsusceptible period of the districts, which is reflected in very low Ci.
Primary Sterility
Primary sterility generally had little effect on fertility across subgroups in Kenya from 1977–1978 to 1988–1989. However, it did have an effect on the fertility of urban women, particularly in the KFS. Nairobi and Coast showed an effect in 1977–1978, but this effect was eliminated by 1988–1989, reflecting either a drop in rates of primary sterility due to improved medical care or sample sizes that were too small to yield reliable estimates.
Summary
In looking at the national-level indices from the 1988-1989 KDHS, the most important fertility-suppressing index is postpartum infecundability, followed by contraception, and then marriage. Abortion and primary sterility had limited effects. Results from the 1977–1978 KFS also indicate that postpartum infecundability was the most important fertility-inhibiting variable at the national level. Marriage patterns (Cm) followed in significance in the earlier period, with contraception having a relatively minor effect. What is most notable is the substantial change between the two surveys in contraceptive use patterns, which replaced marriage as the second most important fertility-inhibiting factor at the later date. This decline in Cc is due to increasing contraceptive prevalence, since the method use-effectiveness mix has changed very little. Cm also declined between the two surveys, although not as steeply as Cc. The effects of infecundability and primary sterility (Ci and Ip) changed little.
The indices by subgroup generally follow the national pattern, with postpartum infecundability as the most important fertility-suppressing variable, followed by contraception and marriage for the KDHS and by marriage and contraception for the KFS. There are a few notable exceptions. For all of the seven provinces included in the surveys, postpartum infecundability had the greatest fertility-suppressing effect of the proximate determinants in 1977–1978. In 1988–1989, it had the largest effect for only four of the seven provinces: Coast, Nyanza, Rift Valley, and Western. For the other provinces—Nairobi, Central, and Eastern—contraceptive practices had the greatest impact on fertility. However, for all the provinces, the effect of contraception in inhibiting fertility increased over time, due to substantial increases in contraceptive use, as shown in Figure 5-4. Among educational groups, contraceptive practices surpassed postpartum infecundability in suppressing fertility only in the most-educated group. However, contraceptive use increased dramatically for all subgroups between the two surveys, as shown in Figure 5-5.

RELATION BETWEEN CHANGES IN PROXIMATE DETERMINANTS AND FERTILITY
The proximate determinant indices of the Bongaarts framework have been estimated from the KFS and KDHS data by identical methods. They can be taken as applicable to the few years preceding the surveys, although the exact time specification varies from index to index. For practical purposes, the changes between the two surveys can be set against the corresponding changes in fertility as measured by the total fertility rates calculated for the previous 5 years. KFS and KDHS fertility estimates are available by provinces, by urban and rural residence, and by the education of the mother. The KFS sample sizes by districts were too small for usable indices of proximate determinants to be derived.
Table 5-9 shows levels based on data from the KDHS as a percentage of the KFS values. The index Ca was omitted because it was taken as constant throughout and makes no contribution to the calculation of change. The estimated total fertilities in the 5 years before the KDHS as a percentage of the corresponding measures from the KFS are presented in parallel. By using the Bongaarts model, if the estimates are reliable, the change in the product (Ip · Cm · Cc · Ci · Ca) should equal the change in the total fertility. For Kenya as a whole, the agreement is excellent, with a 21 percent reduction in the proximate determinants effect compared to the 19 percent decline in fertility. For the subpopulations, such good correspondence is not
TABLE 5-9 Proximate Determinant and Fertility Indices from the KDHS as Percentages of KFS Measures
|
Subgroup |
Ip |
Cm |
Cc |
Ci |
Product |
TFR |
|
National |
101 |
95 |
80 |
103 |
79 |
81 |
|
Provinces |
|
|
|
|
|
|
|
Nairobi |
107 |
101 |
80 |
100 |
86 |
74 |
|
Central |
99 |
90 |
68 |
97 |
59 |
69 |
|
Coast |
107 |
89 |
87 |
113 |
94 |
73 |
|
Eastern |
98 |
105 |
70 |
109 |
79 |
84 |
|
Nyanza |
103 |
95 |
91 |
103 |
92 |
87 |
|
Rift Valley |
100 |
94 |
78 |
103 |
76 |
80 |
|
Western |
102 |
97 |
91 |
98 |
88 |
96 |
|
Urban/Rural |
|
|
|
|
|
|
|
Urban |
107 |
98 |
80 |
101 |
85 |
77 |
|
Rural |
101 |
95 |
80 |
103 |
79 |
83 |
|
Education |
|
|
|
|
|
|
|
No schooling |
101 |
95 |
87 |
100 |
84 |
86 |
|
1-4 years |
100 |
101 |
81 |
101 |
83 |
85 |
|
5+ years |
99 |
98 |
79 |
100 |
77 |
83 |
to be expected. Sample errors could be quite substantial with the comparatively small numbers, particularly for the component indices Ip and Cm. In allowing for this possibility, the agreement for the education subgroups is satisfactory, which confirms the small variation in fertility decline by education. The changes in urban and rural proximate determinants indicate a reversal from the reductions in total fertility rates, that is, a greater decline in rural areas. The discrepancy is not large, however, and seems to arise from the Ip measure, which is particularly vulnerable.
For the provinces, given the sample errors, the correspondence between changes in fertility and the proximate determinants product is reasonable for Central, Nyanza, Rift Valley, and Eastern. The problems of estimating valid measures for Nairobi have been noted in the chapter on fertility. The implication of the determinants for Western is that the estimated fertility decline of 4 percent is too small; the earlier breakdown of this decline by age of women had also raised doubts about reliability. The major discrepancy, however, is for the Coast, where a 27 percent decline in fertility is associated with only a 6 percent decline in the combined proximate determinants. The small overall decline arises from substantial reductions in Cm and Cc, offset by large rises in Ip and Ci. The latter are puzzling. At the time of the KFS, the Coast had the lowest Ip index of all the provinces except Nairobi (i.e., the highest reported childlessness among ever-married women aged 40–49 years) and the lowest Ci value (the longest insusceptible period following a birth). At the time of the KDHS the ranking of the Coast was largely reversed, with little childlessness reported by 40-to 49-year-old ever-married women and the shortest insusceptible period among the provinces (4 months less than that obtained from the KFS). The national changes in these measures between the two surveys were small. Such an extreme alteration in these biosocial parameters for the Coast is very implausible, and data errors must be suspected. If the Ip and Ci changes for the Coast are ignored and only the product Cm · Cc is considered, the KDHS value is 77 percent of the KFS level, which implies a fertility decline of 23 percent in rather good agreement with the directly estimated 27 percent. The use of the Cm · Cc product only to assess the effects of changes in the proximate determinants gives, on average, slightly better agreement for the other provinces also.
Apart from the measures for the Coast, which are of doubtful validity, the Ip and Ci indices showed little change between the KFS and KDHS for the individual provinces. The movements in Cm were also rather small, except possibly in Central and Coast provinces. It can be noted that the large decline in the fertility of young women in the Coast also suggests an effect of later marriage.
The reductions in the proximate determinant product from the KFS to the KDHS are thus, in general, dominated by the increase in contraceptive
use as gauged by the Cc index. The reduction in this index is reflected almost exactly in the total fertility rate decline for Kenya as a whole, very closely for Central and Rift Valley provinces, and with reasonable agreement for Nairobi and Nyanza. The Coast comparison suggests that in this region, later marriage may also have made a substantial contribution to the fertility decline. The comparison for Eastern Province is less convincing because the increase in contraceptive use would have been expected to produce a greater fertility decline than that recorded.
A similar examination at the district level is precluded by the small sample sizes of the KFS. An attempt at a rough assessment is presented in Table 5-10. It has been assumed in the calculations that the proximate determinant indices for districts at the KFS can be taken to be the same as for the provinces that contain them at the same time. The crudeness of this assumption is obvious. It may be satisfactory for the more homogeneous provinces such as Central and Western but is highly suspect for the diverse Rift Valley. However, the Cc indices at the KFS were all rather close to 1 because of low contraceptive use in all provinces except Nairobi (.85) and Central (.92). The scope for error due to the assumption is thus small here.
There is a broad association between the percentage reductions in fertil
TABLE 5-10 Reductions in Fertility and Proximate Determinants, KFS to KDHS (percent)
ity and in the proximate determinants. Thus, Kirinyaga, Nyeri, and Nakuru had the largest reductions in Cc and the combined product: They are near the top of the ranking for fertility declines. The districts with the four smallest fertility declines (Kakamega, Bungoma, Kisumu, and South Nyanza) showed only modest changes in the proximate determinants. But there are striking inconsistencies, notably for Siaya and Uasin Gishu, which recorded the second and third highest fertility declines but negligible alterations in Cc and the product index. The doubts about the fertility measure for Siaya are discussed in Chapter 4. Plots of the fertility declines against the changes in proximate determinants are shown in Figures 5-6A (combined product) and 5-6B (Cc index). The latter relation is closer, particularly if the regression line is constrained to pass through the origin. To a large extent, the closer relation is due to the improved agreement for Kilifi and Mombasa in the Coast Province, where the Ip and Ci changes are suspect. As has been pointed out, this examination is subject to considerable uncertainty because of data limitations and errors, chance fluctuations due to small numbers, and crudeness of assumptions. Despite these caveats, the general agreement of the estimates of fertility decline with the changes in proximate determinants gives strong support to the belief that the findings of our analysis of the proximate determinants are broadly reliable.
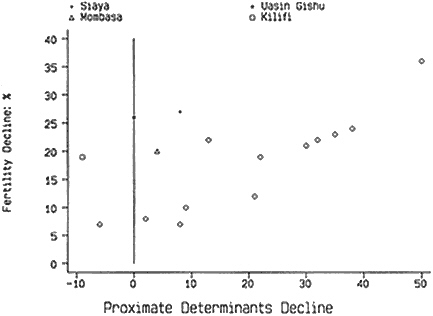
Figure 5-6A Declines in fertility and proximate determinant indices.
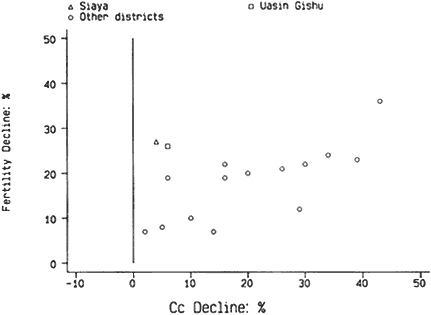
Figure 5-6B Declines in fertility and Cc (index of contraception).
COMPARISONS OF THE PROXIMATE DETERMINANTS OF KENYA WITH OTHER SUB-SAHARAN POPULATIONS
Table 5-11 gives the indices for the proximate determinants at the aggregate level for all the populations in sub-Saharan Africa for which a DHS had been conducted and a standard recode data tape made available as of 1992. The results for Botswana and Zimbabwe, two countries that have also experienced a notable drop in fertility, show that contraception was an important inhibitor of fertility at the time of the surveys, in contrast to the findings for the other sub-Saharan African populations shown.9 Sudan, which may also have experienced a fertility decline (Sudan Department of Statistics and Institute for Resource Development, 1991), showed a fairly weak Cc, but an exceptionally strong effect of marriage patterns (see Jolly and Gribble, 1993, for a fuller discussion).
Like Kenya in 1977–1978, most of sub-Saharan African fertility at the time of the DHS was inhibited primarily by postpartum infecundability, followed in most cases by marriage patterns. The question remains whether these countries will follow the pattern of Botswana, Kenya, and Zimbabwe of increased contraceptive use and lower fertility.
TABLE 5-11 Proximate Determinants of Fertility, Other DHS Sample Populations in Sub-Saharan Africa
|
Country |
Observed TFR |
Index of Marriage, Cm |
Index of Contraception, Cc |
Index of Postpartum Infecundability, Ci |
Index of Sterility, Ip |
Model Estimate of Total Fecundity Rate, TF |
|
Botswana 1988 |
4.97 |
.873 |
.692 |
.629 |
.998 |
13.1 |
|
Burundi 1987 |
6.92 |
.801 |
.948 |
.525 |
1.029 |
16.9 |
|
Ghana 1988 |
6.35 |
.850 |
.894 |
.552 |
1.021 |
14.8 |
|
Kenya 1988–1989 |
6.62 |
.860 |
.761 |
.662 |
1.009 |
15.1 |
|
Liberia 1986 |
6.69 |
.932 |
.939 |
.588 |
1.000 |
13.0 |
|
Mali 1987 |
7.04 |
.976 |
.973 |
.563 |
.994 |
13.2 |
|
Ondo State, Nigeria 1986–1987 |
6.09 |
.826 |
.949 |
.472 |
1.033 |
15.9 |
|
Senegal 1986 |
6.57 |
.898 |
.959 |
.554 |
.976 |
14.1 |
|
Sudan 1989–1990 |
4.87 |
.680 |
.925 |
.599 |
.989 |
13.1 |
|
Togo 1988 |
6.59 |
.865 |
.905 |
.518 |
1.021 |
15.9 |
|
Uganda 1988–1989 |
7.35 |
.918 |
.958 |
.627 |
.967 |
13.8 |
|
Zimbabwe 1988–1989 |
5.49 |
.812 |
.597 |
.658 |
1.005 |
17.1 |
|
SOURCE: Jolly and Gribble (1993). |
||||||
SUMMARY
Examination of the changes in the proximate determinants of fertility in Kenya from the late 1970s to the late 1980s reveals the primary importance of increasing contraceptive use in the fertility decline over this same period. Although postpartum infecundability continued to have the strongest fertility-inhibiting effect of all the proximate determinants, contraceptive use replaced marriage patterns as the second most important fertility-inhibiting factor. Comparing the changes in the proximate determinants with the declines in fertility shows almost equal reductions in both, indicating that the results of the analysis are generally credible.
APPENDIX
COMPUTATIONAL PROCEDURES TO ESTIMATE THE INDICES OF THE PROXIMATE DETERMINANTS
Marriage Patterns
where TFR = average total number of births a woman would have in her lifetime at current age-specific fertility rates (ASFRs), and TMFR = average total number of births a woman in union throughout her reproductive years would have in her lifetime at current age-specific marital fertility rates.
Both rates were estimated for the four years prior to the survey. The TMFR was estimated for women currently in union.
Contraception
Cc = 1-1.08ue,
where u = current contraceptive use prevalence rate among women in sexual union, and e = average use-effectiveness of contraception.
Abstinence is excluded as a method because it was listed as a potential response only on the KFS questionnaire and not on the DHS, and because many of the women who reported using abstinence as a contraceptive method were practicing postpartum abstinence, which is captured in the Ci index. Periodic abstinence or rhythm method, however, is included as a method.
The average use-effectiveness of a method is calculated as the weighted average of the method-specific use-effectiveness levels, with the weights equal to the proportion of women using a given method. The levels used were adapted by Bongaarts and Potter (1983) from a study by Laing (1978) in the Philippines. They are
|
Pill |
0.90 |
|
IUD |
0.95 |
|
Sterilization |
1.00 |
|
Other methods |
0.70 |
Postpartum Infecundability
Ci = 20/(18.5 + i),
where i = mean number of months of postpartum infecundability (estimated as mean number of months of postpartum amenorrhea or abstinence, which
ever is longer) for women in union. The mean number of months of postpartum infecundability is estimated by using the prevalence/incidence method. In this analysis,
Primary Sterility
Ip = (7.63-.11s)/7.3,
where s = proportion of married women between ages 40 and 49 who have never had a child.
Bongaarts et al. (1984) used the percentage of women age 45–49 who were childless. In this analysis, the percentage of childless women age 40–49 is used to increase the number of women in each subgroup and reduce the standard error in estimating s. It is assumed that all women had their first child by age 40 in Kenya.
Abortion
where A = 0.4(1 + u) TA, u = contraceptive prevalence rate, and TA = number of abortions per female during her reproductive years.
Total Natural Fecundity Rate
TF = TFR/(Cm · Cc · Ci · Ip · Ca )
(Bongaarts and Potter, 1983; Bongaarts et al., 1984).


