
2
Landscapes, Commodities, and Ecosystems: The Relationship Between Policy and Science for American Rivers
William L. Graf
Arizona State University
Tempe, Arizona
INTRODUCTION
With the exception of the land from which they flow, America's rivers are the nation's most valuable natural resource. During the mid-twentieth century, the social values that America ascribed to its rivers dramatically changed from an exclusive emphasis on economic development to include preservation. The resulting conflict between development and preservation is mirrored in the scientific investigations of rivers that have supported policy objectives. Previous research founded in reductionist analytic approaches has given way to more holistic investigations rooted in general system theory. The purposes of this paper are to explore the nature of scientific research for rivers against the changing background of cultural values and to examine the interface between science and policy, especially as exemplified by the actions of the Water Science and Technology Board of the National Research Council and the National Academy of Sciences.
RIVERS AS LANDSCAPES
The first intellectual views of American rivers adopted a holistic, interconnected systems perspective. In the early 1800s, when engineers were tinkering with individual river components, geomorphologists were barely beginning to see the interconnections among parts of stream networks, ecologists were enmeshed in species classification, and American artists were
depicting rivers as complex landscape systems with physical, biological, and human dimensions (Nygren, 1986). Beginning in the 1820s, painters of the Hudson River School, deriving guidance from the works of Thomas Cole and Frederic Edwin Church, became the first identifiable group of American artists (Driscoll, 1981). They included in their works detailed expressions of the fluvial geomorphology and riparian ecology along New England rivers. For much of the remaining nineteenth century, artists continued this systematic viewpoint rather than singling out particular components for emphasis (Wilmerding and Mahe, 1984). These early painters also provided the first representations of environmental damage from river mismanagement, showing water pollution and forest destruction resulting from reservoir inundation.
The Hudson River School's success continued during the 1830s when Carl Wimer and George Catlin depicted western rivers as complex, interactive mosaics of physical landscapes and biological communities with human significance. Perhaps most remarkable is the record of hundreds of watercolor paintings by Karl Bodmer during his two-year excursion on western American rivers beginning in 1832 (Goetzmann, 1864), with geomorphic features, plant and animal species, and human populations accurately represented as dynamic, interactive systems.
RIVERS AS COMMODITIES
As the nineteenth century progressed, however, the engineering, scientific, and legal professions did not continue this systematic tradition. General American culture has always viewed rivers as simply water, a commodity that could ameliorate an uncertain but potentially productive environment. Anglo-Americans developed a complex set of laws to govern water withdrawals from streams (Trelease, 1979), all founded on the basic precept of river as a water commodity. Major federal initiatives grew out of this commodity-based perspective and became refined into the missions of navigation and flood control by the U.S. Army Corps of Engineers, irrigation development by the Reclamation Service (later the Bureau of Reclamation), and surveying and data collection by the U.S. Geological Survey.
Congress created the U.S. Army Corps of Engineers after the War of 1812 with the expressed purpose of widening the Ohio River channel for barge traffic; the involvement of the Corps in navigation improvement on rivers has continued to the present day (Clarke and McCool, 1985). The Corps' mission was to ensure that rivers would be cheap and efficient conduits for commodity transport, thus justifying a national investment in regional development and economic prosperity. In 1912 the Congress authorized the Corps to undertake
flood control projects as site-specific responses to endangered enterprises near rivers (Holmes, 1979). The Corps' activities, emphasizing eastern states because they were the locations of the great flood losses (Figure 2.1). led to the construction and maintenance of thousands of projects that altered river environments throughout the nation.
As the American frontier moved into increasingly arid western areas, it became apparent that agriculture in the new areas would be possible only with federal investment in irrigation projects (Powell, 1878). As the culmination of a broadly based political and economic movement for irrigation development, Congress established the Reclamation Service as a major agency in 1902 (Hays, 1959). Renamed the Bureau of Reclamation in 1923, the agency's mission was to develop large dams and delivery systems to provide water to agricultural producers, a function that limited the bureau's geographical range to western states (Figure 2.2). The Bureau constructed most of the nation's largest dams, and its works impacted every major river in the central and western United States (Figure 2.3).
The manipulation and marketing of rivers as commodities by the Corps of Engineers and Bureau of Reclamation required information about the resource, giving rise to monitoring and investigative activities of the U.S. Geological Survey. The Geological Survey established an internal irrigation survey in 1888 to coordinate the evaluation of potential dam sites and their withdrawal from the public domain, but this politically risky business led to the demise of the irrigation survey and congressional restrictions on the Geological Survey (Stegner, 1953). In the area of water research, the Geological Survey consequently pursued a lower-profile course of stream gaging, mapping, and water quality analysis (Rabbitt, 1980). The Water Resources Division generated significant scientific developments, but as with investigations in all federal water agencies the primary political force behind the research was the management and use of rivers as resource commodities (Graf, 1992).
The combined efforts of the Corps of Engineers and the Bureau of Reclamation together with other agencies and private companies built more than 2 million dams on the nation's rivers; 87 dams impound reservoirs of a million acre feet or more of storage (Table 2.1). The reservoirs are a significant component of the nation's hydrologic cycle because they have the capacity to store an amount of water equal to three years' annual runoff from the nation (Table 2.2). By about 1960 the ethic of river control for beneficial economic development and the associated frenzy of dam construction reached a zenith, and thereafter the number of starts for new structures declined (Figure 2.4). Federal funding for water projects became more difficult to
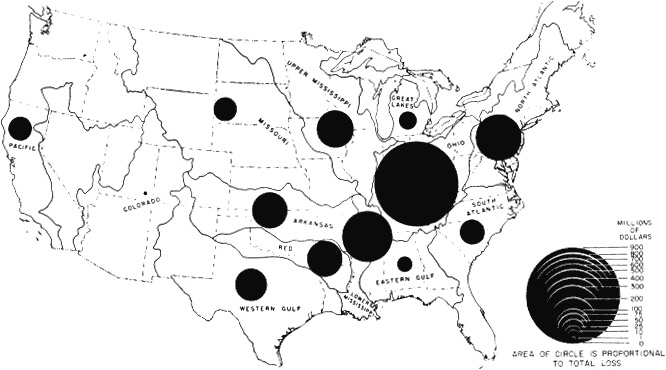
Figure 2.1 Regional distribution of flood damages in the continental United States, 1902–1937, during a period of emphasis for the flood control efforts of the U.S. Army Corps of Engineers, showing the importance of the eastern states in losses.
Source: Data from U.S. Department of Agriculture, reprinted by permission from Hunt (1974). Copyright ©1974 by W. H. Freeman Company.
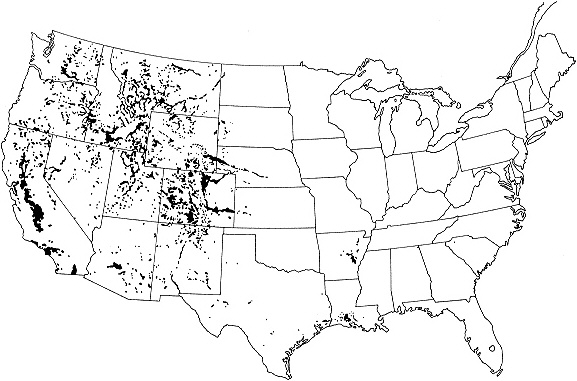
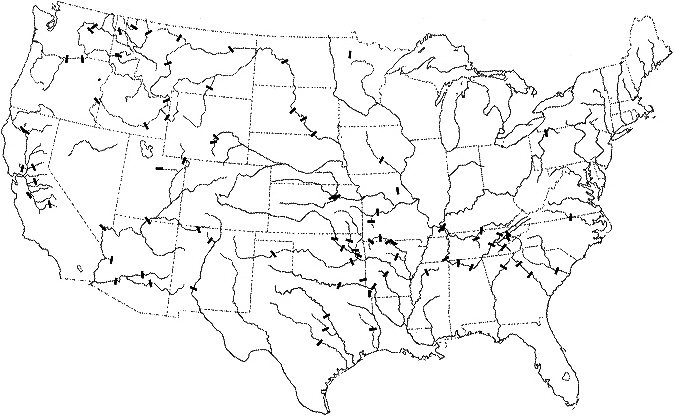
TABLE 2.1 Census of Dams in the Continental United States
|
Reservoir Capacity (acre feet) |
Number |
Total Capacity (acre feet) |
|
>10,000,000 |
5 |
121,670,100 |
|
1,000,000 – 10,000,000 |
82 |
186,480,100 |
|
100,000 – 1,000,000 |
482 |
136,371,900 |
|
50,000 – 100,000 |
295 |
20,557,000 |
|
25,000 – 50,000 |
374 |
13,092,000 |
|
5,000 – 25,000 |
1,411 |
15,632,000 |
|
50 – 5,000a |
50,000b |
5,000,000 |
|
<50c |
2,000,000b |
10,000,000 |
|
Total |
|
508,803,100 |
|
a Mean reservoir size estimated to be 100 acre feet. b U.S. Army Corps of Engineers' estimates. c Mean reservoir size estimated to be 5 acre feet. SOURCE: U.S. Army Corps of Engineers' data. |
||
obtain, all of the best sites had been developed, and the new competing ethic of preservation had grown to formidable proportions.
RIVERS AS OBJECTS OF PRESERVATION
Preservation of wilderness attributes of landscapes slowly emerged in American culture (Nash, 1973; Oelschlaeger, 1991), almost always in conflict with the prevailing development ethic (Graf, 1990). Beginning in the 1920s, an increasingly organized effort involving resource managers and public user groups pressed for the establishment of formal wilderness areas on federal lands to preserve natural environments. Even after passage of the 1964 Wilderness Act, preservation of river environments was problematical. In the Southwest, for example, proponents of dam and irrigation projects opposed wilderness designations because potential reservoirs might extend into the
TABLE 2.2 Distribution of Water in the Continental United States
|
Compartment |
Volume (km3) |
|
Ground water |
126,000 |
|
Freshwater lakes |
19,000 |
|
Soil moisture |
630 |
|
Reservoirs |
627a |
|
Water vapor, atmosphere |
190 |
|
Ice and glaciers |
67 |
|
Salt lakes |
58 |
|
Active rivers |
50 |
|
Total |
146,632 |
|
a Calculated from Table 2.1. SOURCE: Federal Council for Science and Technology (1962). |
|
preserved areas, an arrangement prohibited by the new law (Baker, 1985). Recognizing the special problems in preserving river environments and fresh from political victories that prevented the construction of dams in Dinosaur National Monument and Grand Canyon National Park, the preservation movement secured approval of the Wild and Scenic Rivers Act in 1968 (Tarlock and Tippy, 1970; Goodell, 1978).
The Wild and Scenic Rivers Act did not give natural objects legal standing in the traditional sense (Stone, 1974), but it lent statutory legitimacy to an alternative to development. The act established a national system that included rivers in varying levels of preservation, and it prohibited dam construction in all river segments included in the system (Coyle, 1988). The dramatic increase in river preservation occurred coincidentally with the dramatic decrease in dam construction (Figure 2.5), partly reflecting the shift in American cultural values placed on rivers. By the time the act appeared, only about 2 percent of the nation's streams remained in undisturbed natural conditions (Echeverria et al., 1989). Engineering structures had coopted many potential wild and scenic rivers, but since 1968 the system has grown
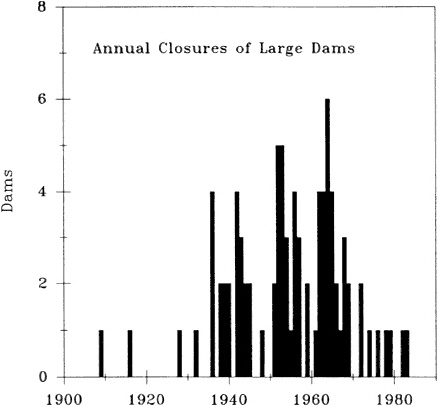
Figure 2.4 Dates of closure for large dams (those with reservoir capacity of 1 million acre feet or more) in the continental United States. Compare with the trends in Figure 2.5.
Source: Data from U.S. Department of the Interior (1986), U.S. Department of the Army (1986), van der Leeden et al. (1990).
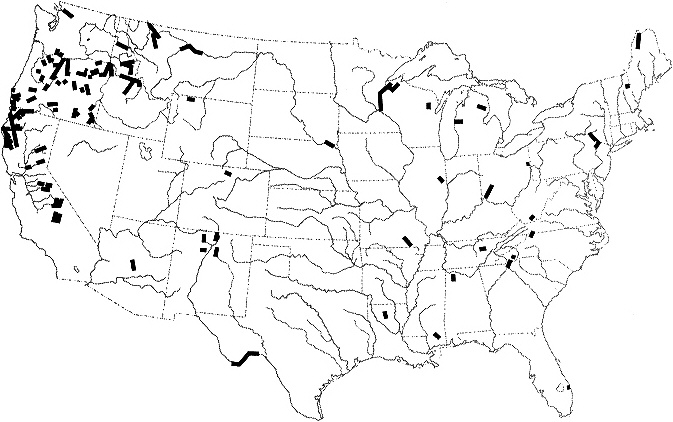
sporadically to include 125 reaches totaling almost 10,000 miles of river (Huntington and Echeverria, 1991). The mileage preserved in the system is still a small fraction of the length of river inundated by reservoirs and includes less than one-third of 1 percent of the nation's total natural river courses (Table 2.3). Like the nation's largest dams, the distribution of preserved river segments is heavily weighted toward the West (Figure 2.6).
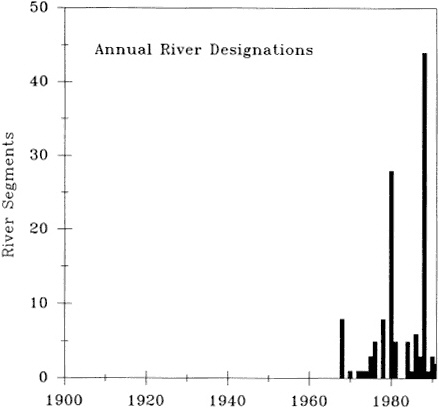
Figure 2.5 Dates of establishment for segments of the Wild and Scenic Rivers System. Compare with the trends in Figure 2.4. Source: Data from American Rivers, Inc. (1990).
The stage for continued conflict between development and preservation is now established on the map of American rivers. Preserved segments and potential candidate segments for preservation are juxtaposed with clams and reservoirs whose operations strongly affect downstream reaches. Unwittingly, the political and economic processes have produced a situation wherein the management objectives of closely associated structures and preserved segments are opposed to each other, but because of strong interconnections in the river systems they cannot be managed in isolation from each other. The constituen-
TABLE 2.3 River Mileage in the United States
|
Status |
Miles |
Data Source |
|
Total rivers and streams |
3,200,000 |
Echeverria et al. (1989) |
|
Rivers and streams now under reservoir waters |
600,000 |
Echeverria et al. (1989) |
|
Rivers and streams suited for inclusion in the Wild and Scenic Rivers System |
64,000 |
U.S. Department of the Interior (1982) |
|
Rivers and streams included in the Wild and Scenic Rivers System |
9,452 |
American Rivers, Inc. (1990) |
cies of all the river resource management agencies have therefore expanded dramatically, and agencies that once competed now must deal with each other with at least a semblance of harmony. These new holistic problems make significant new demands on science for their resolution.
SCIENCE FOR RIVER MANAGEMENT
Scientific investigations of American rivers have always been the handmaidens of public policy for riverine resources. Geomorphology developed as a distinct science within geology and geography at the close of the nineteenth century (Chorley et al., 1964), and the first hydrology textbook appeared in 1904 (Chow, 1964). The emergence of these sciences coincided with the burgeoning interest in water resource development early in the twentieth century, when scientific investigations of river processes were usually related to assisting in the solution of engineering problems. Gaging and analysis of western river discharges, for example, were largely in support of the search for suitable rivers and sites for the construction of large federal clams (see, e.g., LaRue, 1925). Investigations into the hydrologic and geomorphic impacts of various land use practices resulted from efforts to understand and control erosion and sedimentation that threatened water resource development (see, e.g., Thornthwaite et al., 1942). When these early scientists and associated engineers (such as Frederick H. Newell, an early director of the Reclamation Service) became part of the administering bureaucracy, they brought their engineering and science with them. They were administrators
who ''had little faith in democracy as a social remedy.... [T]hey expected society to be saved by a technical elite'' (Layton, 1971).
Because of the strong association between science and engineering for rivers, much of the science of the first half of the twentieth century was a reductionist, analytic approach closely related to engineering principles (reviewed by Leopold et al., 1964, who also showed an interest in systems). By dissecting the river into its various components and explaining their individual workings, the analytic approach vastly improved understanding and prediction of the behavior of natural streams. It also directly supported structural engineering efforts to exert control over river behavior because structural approaches tended to address particular limited aspects of rivers, such as controlling discharge, stabilizing banks, or deepening channels. By the late 1950s the Water Resources Division of the U.S. Geological Survey was developing sophisticated theory as well as addressing particular problems using an analytic approach (Tinkler, 1985).
In the mid-twentieth century, while the public ethic for river management began to shift from strictly economic development to a more complex view that included preservation, river sciences also began to undergo a change in perspective. The analytic approach continued as a successful and forceful paradigm, but it faced increasing competition from a general systems perspective. This approach considered the river as a complex collection of interacting elements and emphasized investigation of system-wide behavior, a perspective that fit comfortably with the emerging environmental perspective considering multiple uses of multiple resources associated with the river landscape. The systems viewpoint had been present in geomorphology and hydrology from their formative years (Thorn, 1988), but it was not especially prominent in process research. Gilbert's (1877) classic Henry Mountains work, often cited as the first major statement of fundamental geomorphologic principles, has a distinct systems perspective on fluvial processes. Later, in the New Deal Era, federal hydrologists developed water budget models for river basins that were essentially systems for economic planning (Blaney et al., 1937). The analytic approach, however, dominated geomorphic and hydrologic work well into the twentieth century.
Wide application of the systems view emerged mostly from the life sciences and was associated with the twentieth-century version of the science of ecology, which, despite a long gestation period, did not become prominent until the 1950s. Life scientists have tended to adopt the term ecosystem, proposed by Tansley (1946), as the entire complex of organic and inorganic components interacting with each other in a biome and its habitat. Geomorphologists and hydrologists did not widely adopt the systems perspective until yon Bertalanffy (1950, 1962) published a broad general systems theory that
included a calculus and terminology. Rather than assessing variation in individual measures of river behavior, recent research has assessed river system behavior as responses in several variables interacting with each other and with physical, chemical, biological, and human-manipulated controls (Chorley et al., 1984; Graf, 1988).
THE SCIENCE-POLICY CONNECTION FOR RIVERS
The mutually influential relationship between science and policy has operated for both the development and preservation ethics. The analytic investigations of sediment transport, hydraulic behavior of flow in natural channels, and the responses of flow to various artificial structures (reviewed by Chow, 1959) had clear connections for efforts in dam, levee, canal, and channel construction. Alternatively, systems science had an equally important connection to the preservation view of society and nature (Glacken, 1967). The work of the German geographer Alexander yon Humbolt led directly to environmental systems interpretations by British naturalists whose proselytizing spurred colonial laws preserving forest and range ecosystems as early as the 1850s and 1860s (Grove, 1992). Preservation of riparian ecosystems in the United States did not occur until 100 years later.
General systems approaches, whether explicitly stated or simply inherent in research designs, have important implications for potential policy applications, because such approaches tend to emphasize the multivariate aspects of environmental systems. Causal relationships are rarely seen as simple connections susceptible to easy structural management, and changes intentionally introduced to the system at one place are usually seen as having far-reaching consequences elsewhere. In its new guise in the late 1900s, the river-related research of geomorphology, hydrology, and ecology was therefore more likely than ever before to support system-wide management and operations solutions to problems and less likely to support geographically limited structural solutions.
Systems science has been slow to affect federal agency research for rivers. The managers of large federal river projects now deal with complex interactive systems, and even though systematic planning for economic purposes is common (as in the Tennessee Valley Authority and western regional hydropower administrations), scientific research in agencies has not often adopted similarly broad perspectives. Analysis of details instead of system behavior continues to be the primary source of information for decision makers dealing with structural management and impact analysis, in part
because of continued emphasis on technology and (by implication) engineering solutions.
Scientific input, whether analytic or systematic, is a major component of public policy decisions affecting rivers. The American public, through its elected representatives, continues to support the infusion of scientific opinion into decision processes, and critical editorial comment is sure to follow any major river management decision that does not appear to have the patina of scientific validity. Decision makers themselves often demand scientific input, and the operating rules of resource management agencies dealing with rivers frequently include the provision that management practices be "scientifically sound" (as in the case of contaminated sediment management by the Environmental Protection Agency; EPA, 1992). In many instances, the law includes scientific input to decisions, either in the adjudication of disputes with the testimony of expert witnesses or in decisions that direct an agency to pursue practices that are scientifically valid (as in court decisions affecting the Bureau of Reclamation; NRC, 1987).
Scientists themselves are less enthusiastic about participating in research that has public policy implications or that might stir political debate. River scientists who entered the field during the 1960s and 1970s frequently are unwilling to enter difficult and contentious arenas that might jeopardize their funding sources, and geomorphologists and hydrologists often avoid research topics with sharply defined political implications. Ecologists seem more likely to engage in such work, but scientists in all three fields tend to be widely dispersed in universities and government agencies, so that the development of a critical mass of researchers who might influence policy is difficult.
Despite these reservations, some scientists do work directly with policy makers, and there are certain common themes evident in those situations where science and policy have worked well together. The probability of successful interaction is highest if policy formulation and funding for research are simultaneous. For example, in river engineering cases, simultaneously planned and funded geomorphologic and engineering studies have been effective in creating near-natural and stable environments (Coates, 1976). Success has also been common in those cases where university researchers interested in basic science have teamed with management agencies seeking an intellectual framework for applied problem solving. Schumm's (1977) redefinition of general systems approaches for rivers as an outgrowth of the needs of river management agencies such as the Corps of Engineers is an example. Finally, success has occurred where a critical mass of researchers and resources has been achieved, such as in the experimental watersheds and research staffs of the Agricultural Research Service focused on forest and range management issues (e.g., Alonso, 1980).
Those cases where science and policy have failed to interact effectively fall into five general categories (modified from Chelimsky, 1991). First, there are some issues that can be decided only in the political arena, irrespective of any scientific evidence that might be produced. The ongoing debate over the definition of federally protected wetlands may be an issue of this type. The scientific validity of any accepted definition appears to be less important than the resulting geography of wetlands. Second, science clearly does not work well in a policy support role where research requirements exceed available resources. For example, although the United States has maintained the world's most extensive stream gage network, many policy decisions require even more data on water quality and sediment, the collection of which is prohibitively expensive. As a result, decisions must be made with considerable uncertainty and must rely on estimates rather than firm empirical data. Third, some policy decisions ask questions that are at the cutting edge of present day science. Problems associated with irrigation drainage and selenium pollution in the San Joaquin Delta illustrate a matter where adequate understanding was simply unavailable early in the management process (NRC, 1989).
Two additional types of problems involving the science-policy connection may lead to erroneous results: advocacy science and entrepreneurial science. Advocacy science occurs when an interest group or management agency sponsors in-house research with the direct intention of controlling the outcome of the work for political purposes. Researchers in this arrangement may feel obligated to report results supportive of the position of their sponsor. Finally, some researchers pursue their work solely for monetary reward, an acceptable practice as long as the pursuit of contracts does not produce results tailored for sale.
AN INTERMEDIARY BETWEEN SCIENCE AND POLICY
The Water Science and Technology Board of the National Research Council and National Academy of Sciences has played a unique and critical role in improving the science-policy connection. Since its founding in 1982, the board has produced more than 20 independent reviews and studies that concentrate on establishing a productive science-policy interface. Most of these efforts have performed oversight functions, assessed the scientific needs of policy makers, or searched out directions for future research.
The board has acted as a sort of intellectual umpire in cases where the issue is the assurance of the quality of science being used by public agencies. For example, when the Army Corps of Engineers undertook a massive analysis of the water supply for Washington, D.C., Congress mandated oversight of the
scientific and technical aspects of the work by an independent group (NRC, 1984). Other oversight efforts by the board included advisory work for the Geological Survey in the development of its National Water Quality Assessment Program (NRC, 1990) and its Water Resources Division (NRC, 1991a). In what will probably become the longest-running oversight effort of the board, one of its committees continues to advise the Bureau of Reclamation in its research to assess the effects of Glen Canyon Dam on resources downstream on the Colorado River in Grand Canyon National Park (NRC, 1987, 1991a).
The board has also attempted to better define the scientific needs of policy makers. In two major studies on the safety of dams, committees of the board assessed the state of knowledge for dam safety and identified reasonable criteria for decisions in support of structural management (National Research Council, 1983, 1985), leading to national legislation. In a sweeping review of irrigation drainage problems, a committee of the board used the San Joaquin Delta experience as an object lesson on project management (NRC, 1989).
The board has assumed a leadership role in defining developmental needs to ensure that science produces useful explanation and direction for policy. Examples include assessments of the general hydrologic sciences and the emerging subfield of aquatic restoration (NRC, 1991b, 1992). The board has stressed the need for empirical science to support technological advances in hydrologic engineering. One outgrowth of the effort has been the establishment of the Hydrological Sciences Program of the National Science Foundation.
There are several common themes that arise from the board's experience in working at the science-policy interface (Leopold, 1990, identified some of these themes from a general perspective). In most oversight cases, for example, political or legal pressures forced the public agencies to become reluctant bedfellows with the board. In a Washington area water supply study, for example, Congress required that the Corps seek independent review, and in the Glen Canyon Dam issue court-mandated requirements for scientific validity drove the process for the Bureau of Reclamation. Once involved with the board, agencies have at first systematically resisted board suggestions for improvement of their scientific activities, but in many cases the agencies later relented after contests of will and endurance.
The board has also repeatedly espoused several common intellectual themes in reports to agencies. Calls for general systems perspectives have been frequent as the board has attempted to persuade agencies to conduct their research in a broader, systematic fashion better suited to their complex mandates than the more traditional analytic approach (Figure 2.7). Application of the systems perspective is related to the common board admonition to
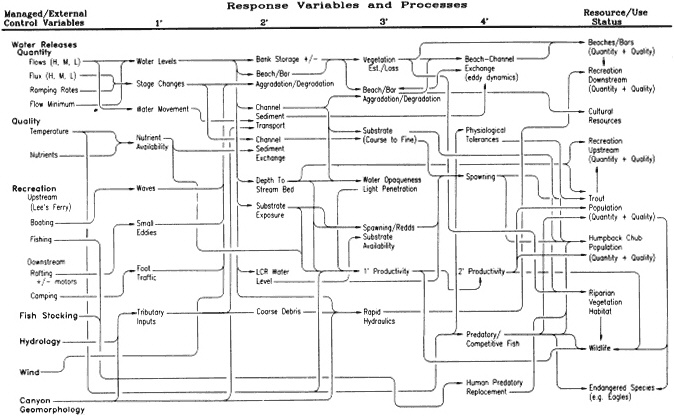
Figure 2.7 An example of a general system perspective that originated in discussions of a committee of the Water Science and Technology Board, informally referred to by users as "The Spaghetti Diagram." The system was designed h by D. T. Patten to guide Bureau of Reclamation research on downstream impacts of the operations of Glen Canyon Dam.
devote more attention to environmental impacts, especially those that extend beyond the immediate project area and beyond the physical environment to social and cultural aspects. Although most members of the board and its committees are scientists or engineers, most major reports call for increased population by social scientists to reflect these extended concerns.
The board also has repeatedly identified the same issues related to the management of science. Often, agency research lacks clearly defined statements of the research questions, so resources are invested in dealing with nebulous issues rather than specific research problems. The board has also noted a consistent lack of cooperation among related federal agencies, an endemic disease wherein each organ of the government experiences bureaucratic tissue rejection when dealing with other agency organs, even when common interests are obvious. Finally, the board has noted in several reports that there is a need to pay more attention to research as opposed to mere data collection. Environmental monitoring and surveillance are not enough to be effective supporters of policy—they must be accompanied by insightful interpretation and analysis.
CONCLUSIONS
From the earliest intellectual attempts to understand American rivers by landscape painters to the most recent systems representations, the objective has been to create a vision of what these resources are and what they should become. The present uncertainty about the future of rivers and the fragmented management structure are not unique. Similar chaotic conditions characterized the nation's policy for public land in the past. In response, at several times the nation established public land law review commissions to create visions of public land resources (e.g., Public Land Law Review Commission, 1970). It is now time to establish a public river policy commission to establish a national perspective on our rivers, a perspective that is larger than individual resources, agencies, or agendas. Such a commission would involve representatives of resource users, management agencies, public interest groups, and researchers. The commission would strive for agreement on a federal strategy for truly integrated and systematic river management that is a finely defined balance between commodity development of individual resources and preservation of selected river landscapes.
There are two primary reasons for developing an integrated approach to river management that avoids the present fragmented management approach. First, it is necessary for the nation to protect its immense investment in river management infrastructure ($16 billion for the Bureau of Reclamation alone)
from unwise and poorly thought-out attempts at environmental protection. The structural investment in American rivers has contributed immeasurably to the evolution of the United States into the most wealthy and powerful nation in the world. To manage the structural investment for continuing sound economic return for future generations is a logical progression from the recent period of construction.
Second, the remaining 2 percent of the nation's rivers that are undeveloped should remain so, with a management strategy that protects their natural conditions from damage by the operation of nearby river reaches dedicated to commodity-based use. The protected river reaches offer individuals and small groups the opportunity for recreation of the highest sort, the opportunity to recreate (albeit briefly and somewhat artificially) the frontier experience. This experience, emphasizing self-reliance and independence, shaped a nation and its people. It is therefore worth preserving, even at great cost.
REFERENCES
Alonso, C. V. 1980. Selecting a formula to estimate sediment transport capacity in nonvegetated channels. In W. G. Knisel, Jr., ed., CREAMS: A Field-Scale Model for Chemicals, Runoff, and Erosion from Agricultural Management Systems. Conservation Research Report Number 26. U.S. Department of Agriculture, Science and Education Administration, Washington, D.C.
American Rivers, Inc. 1990. River mileage classification for components of the National Wild and Scenic Rivers System . Unpublished manuscript. American Rivers, Inc., Washington, D.C.
Baker, R.A. 1985. Conservation Politics: The Senate Career of Clinton P. Anderson. University of New Mexico Press, Albuquerque.
Blaney, H. F., P. A. Ewing, O. W. Israelsen, C. Rohwer, and F. C. Scobey. 1937. Investigations in the Upper Rio Grande Drainage Basin, Colorado-New Mexico-Texas. Report from the Bureau of Agricultural Engineering, Division of Irrigation. U.S. Government Printing Office, Washington, D.C.
Chelimsky, E. 1991. On the social science contribution to governmental decision making. Science 254:226–231.
Chorley, R. J., A. J. Dunne, and R. P. Beckensale. 1964. The History of the Study of Landforms or the Development of Geomorphology: Volume 1: Geomorphology Before Davis. John Wiley & Sons, New York.
Chorley, R. J., S. A. Schumm, and D. E. Sugden. 1984. Geomorphology. Methuen, London.
Chow, V. T 1959. Open Channel Hydraulics. McGraw-Hill Book Company, New York.
Chow, V. T, ed. 1964. Handbook of Hydrology. McGraw-Hill Book Company, New York.
Clark, J. N., and D. McCool. 1985. Staking Out the Terrain: Power Differentials Among National Resources Management Agencies. State University of New York Press, Albany.
Coates, D. R., ed. 1976. Geomorphology and Engineering. Dowden, Hutchinson & Ross, Inc., Stroudsburg, Pa.
Coyle, K.J. 1988. The American Rivers Guide to Wild and Scenic River Designation: A Primer on National River Conservation. American Rivers, Inc., Washington, D.C.
Driscoll, J. P. 1981. All That Is Glorious Around Us: Paintings from the Hudson River School. Museum of Art, Pennsylvania State University, University Park.
Echeverria, J. D., P. Barrow, and R. Roos-Collins. 1989. Rivers at Risk: The Concerned Citizen's Guide to Hydropower. Island Press, Washington, D.C.
Environmental Protection Agency (EPA). 1992. Draft Outline, EPA's Contaminated Sediment Management Strategy: A Proposal for Discussion. Report, March 4. EPA, Washington, D.C.
Federal Council for Science and Technology. 1962. Scientific Hydrology. Ad Hoc Panel on Hydrology, Washington, D.C.
Gilbert, G. K. 1877. Report on the Geology of the Henry Mountains. U.S. Geographical and Geological Survey of the Rocky Mountain Region. U.S. Government Printing Office, Washington, D.C.
Glacken, C.J. 1967. Traces on the Rhodian Shore: Nature and Culture in Western Thought from Ancient Times to the End of the Eighteenth Century. University of California Press, Berkeley.
Goetzmann, W. H. 1984. Karl Bodmer's America. Joslyn Art Museum and University of Nebraska Press, Lincoln.
Goodell, S. K. 1978. Waterway preservation: The Wild and Scenic Rivers Act of 1968. Boston College Environmental Affairs Law Review 7:43–82.
Graf, W. L. 1988. Fluvial Processes in Dryland Rivers. Springer-Verlag, New York and Berlin.
Graf, W L. 1990. Wilderness Preservation and the Sagebrush Rebellions. Rowman & Littlefield, Totowa, N.J.
Graf, W. L. 1992. Science, public policy, and western American rivers. Transactions of the Institute of British Geographers 17:1–24.
Grove, R. H. 1992. Origins of western environmentalism. Scientific American 267(1):42–47.
Hays, S. P. 1959. Conservation and the Gospel of Efficiency: The Progressive Conservation Movement. Harvard University Press, Cambridge, Mass.
Holmes, B. H. 1979. A History of Federal Water Resources Programs and Policies, 1961–1970. U.S. Department of Agriculture, Washington, D.C.
Hunt, C. B. 1974. Natural Regions of the United States and Canada. W.H. Freeman, San Francisco.
Huntington, M. H., and J. D. Echeverria. 1991. The American Rivers Outstanding Rivers List. American Rivers, Inc., Washington, D.C.
LaRue, E. C. 1925. Water Power and Flood Control of the Colorado River Below Green River, Utah. U.S. Geological Survey Water-Supply Paper 556. USGS, Washington, D.C.
Layton, E., Jr. 1971. The Revolt of the Engineers: Social Responsibility and the American Engineering Profession. Press of Case Western Reserve University, Cleveland, Ohio.
Leopold, L. B. 1990. Ethos, Equity, and the Water Resource. Transcript of 1990 Wolman Lecture, Water Science and Technology Board, National Research Council, National Academy of Sciences.
Leopold, L. B., M. G. Wolman, and J.P. Miller. 1964. Fluvial Processes in Geomorphology. W. H. Freeman, San Francisco.
Nash, R. 1973. Wilderness and the American Mind. Yale University Press, New Haven, Conn.
National Research Council (NRC). 1983. Safety of Existing Dams: Evaluation and Improvement. National Academy Press, Washington, D.C.
National Research Council (NRC). 1984. Water for the Future of the Nation's Capital Area . National Academy Press, Washington, D.C.
National Research Council (NRC). 1985. Safety of Dams: Flood and Earthquake Criteria. National Academy Press, Washington, D.C.
National Research Council (NRC). 1987. River and Dam Management: A Review of the Bureau of Reclamation's Glen Canyon Environmental Studies. National Academy Press, Washington, D.C.
National Research Council (NRC). 1989. Irrigation-Induced Water Quality Problems: What Can Be Learned from the San Joaquin Valley Experience. National Academy Press, Washington, D.C.
National Research Council (NRC). 1990. A Review of the U.S.G.S. National Water Quality Assessment Pilot Program. National Academy Press, Washington, D.C.
National Research Council (NRC). 1991a. Colorado River Ecology and Dam Management. National Academy Press, Washington, D.C.
National Research Council (NRC). 1991b. Opportunities in the Hydrologic Sciences. National Academy Press, Washington, D.C.
National Research Council (NRC). 1992. Restoration of Aquatic Ecosystems. National Academy Press, Washington, D.C.
Nygren, E.J. 1986. Views and Visions: American Landscape Before 1830. Corcoran Gallery of Art, Washington, D.C.
Oelschlaeger, M. 1991. The Idea of Wilderness. Yale University Press, New Haven, Conn.
Powell, J. W. 1878. Report on the Lands of the Arid Region of the United States, with a More Detailed Account of the Lands of Utah. U.S. Geological and Geographical Survey of the Rocky Mountain Region, Washington, D.C.
Public Land Law Review Commission. 1970. One Third of the Nation's Land: A Report to the President and to Congress by the Public Land Law Review Commission. U.S. Government Printing Office, Washington, D.C.
Rabbitt, M. C. 1980. Minerals, Lands, and Geology for the Common Defense and General Welfare: Volume 2:1879–1904. U.S. Geological Survey, Washington, D.C.
Schumm, S. A. 1977. The Fluvial System. John Wiley & Sons, New York.
Stegner, W. 1953. Beyond the Hundredth Meridian: John Wesley Powell and the Second Opening of the West. Houghton Mufflin Company, Boston.
Stone, C. D. 1974. Should Trees Have Legal Standing?: Toward Legal Rights for Natural Objects. W. Kaufmann, Los Altos, California.
Tansley, A. G. 1946. Introduction to Plant Ecology. Allen & Unwin, London.
Tarlock, A.D., and R. Tippy. 1970. The Wild and Scenic Rivers Act of 1968. Cornell Law Review 55:707–739.
Thorn, C.E. 1988. Introduction to Theoretical Geomorphology. Unwin Hyman, London.
Thornthwaite, C. W., C. F. S. Sharpe, and E. F. Dosch. 1942. Climate and Accelerated Erosion in the Arid and Semi-Arid Southwest, With Special
Reference to the Polacca Wash Drainage Basins, Arizona. U.S. Department of Agriculture Bulletin 808. USDA, Washington, D.C.
Tinkler, K. J. 1985. A Short History of Geomorphology. Barnes and Noble, Totowa, N.J.
Trelease, F. J. 1979. Water Law: Cases and Materials. 3rd Edition. West Publishing Company, Minneapolis, Minn.
U.S. Department of the Army. 1986. Annual Report FY86 of the Secretary of the Army on Civil Works Activities. U.S. Department of the Army, Washington, D.C.
U.S. Department of the Interior. 1982. The National Rivers Inventory. USDI, National Park Service, Washington, D.C.
U.S. Department of the Interior. 1986. Statistical Compilation of Engineering Features on Bureau of Reclamation Projects. USDI, Bureau of Reclamation, Washington, D.C.
U.S. Forest Service. 1991. U.S. Wild and Scenic Rivers System. Map. U.S. Department of Agriculture, Forest Service, Washington, D.C.
van der Leeden, F., F. L. Troise, and D. K. Todd. 1990. The Water Encyclopedia. 2nd Edition. Lewis Publishers, Chelsea, Mich.
von Bertalanffy, L. 1950. An outline of general system theory. British Journal of the Philosophy of Science 1:134–165.
von Bertalanffy, L. 1962. General system theory—a critical review. General Systems 7:1–20.
Wilmerding, J., and J. A. Mahe. 1984. The Waters of America: 19th-Century American Paintings of Rivers, Streams, Lakes, and Waterfalls. New Orleans Museum of Art, New Orleans.
APPENDIX 2A LARGE DAMS OF THE UNITED STATES
The following table identifies dams in the continental United States with reservoir capacity of 1 million acre feet or more. Dates for Tennessee Valley Authority dams are initial year of hydropower production; others are dates of closure. Sources of data: U.S. Department of the Interior (1986), U.S. Department of the Army (1986), van der Leeden et al. (1990).
|
|
DAM |
RESERVOIR |
RIVER |
STATE |
CAPACITY |
DATE |
|
1 |
Hoover |
Mead |
Colorado |
AZ/NV |
28,500,000 |
1936 |
|
2 |
Glen Canyon |
Powell |
Colorado |
AZ |
27,000,000 |
1964 |
|
3 |
Garrison |
Sakakawea |
Missouri |
ND |
23,923,500 |
1956 |
|
4 |
Oahe |
Oahe |
Missouri |
SD |
23,337,600 |
1962 |
|
5 |
Fort Peck |
Fort Peck |
Missouri |
MT |
18,909,000 |
1940 |
|
6 |
Grand Coulee |
F.D. Roosevelt |
Columbia |
WA |
9,390,000 |
1942 |
|
7 |
Kentucky |
Kentucky |
Tennessee |
KY |
6,129,000 |
1944 |
|
8 |
Libby |
Libby |
Kootenai |
MT |
5,809,000 |
1972 |
|
9 |
Fort Randall |
Francis Case |
Missouri |
SD |
5,603,000 |
1953 |
|
10 |
Bull Shoals |
Bull Shoals |
White |
AK |
5,408,000 |
1952 |
|
11 |
Denison |
Texoma |
Red |
TX |
5,312,300 |
1944 |
|
12 |
H.S. Truman |
H.S. Truman |
Osage |
MO |
5,202,000 |
1982 |
|
13 |
Shasta |
Shasta |
Sacramento |
CA |
4,550,000 |
1945 |
|
14 |
Sam Rayburn |
Sam Rayburn |
Angelina |
TX |
3,997,600 |
1965 |
|
15 |
Eufaula |
Eufaula |
Canadian |
OK |
3,825,400 |
1964 |
|
16 |
Flaming Gorge |
Flaming Gorge |
Green |
UT |
3,788,700 |
1964 |
|
17 |
Hungry Horse |
Hungry Horse |
S.F., Flathead |
MT |
3,470,000 |
1953 |
|
18 |
Table Rock |
Table Rock |
White |
MO |
3,462,000 |
1959 |
|
19 |
Dworshak |
Dworshak |
N.F. Clearwater |
ID |
3,453,000 |
1972 |
|
20 |
Clarks Hill |
Clarks Hill |
Savannah |
SC |
2,900,000 |
1952 |
|
21 |
Grears Ferry |
Grears Ferry |
Little Red |
AR |
2,844,000 |
1962 |
|
22 |
Hartwell |
Hartwell |
Savannah |
GA |
2,842,700 |
1961 |
|
23 |
Blackley Mt. |
Ouachita |
Ouachita |
AK |
2,768,500 |
1955 |
|
24 |
John H. Kerr |
Kerr |
Roanoke |
VA |
2,750,300 |
1952 |
|
25 |
Red Lake |
Red Lake |
Red Lake |
MN |
2,680,000 |
1951 |
|
26 |
Wright Patman |
Marion |
Sulphur |
TX |
2,654,300 |
1957 |
|
27 |
Cooper |
Cooper |
Santee |
SC |
2,560,000 |
1985 |
|
28 |
Buford |
Sidney Lanier |
Chattahoochee |
GA |
2,554,000 |
1956 |
|
29 |
Norris |
Norris |
Clinch |
TN |
2,552,000 |
1936 |
|
30 |
John Day |
Umatilla |
Columbia |
OR/WA |
2,500,000 |
1968 |
|
31 |
Painted Rock |
Painted Rock |
Gila |
AZ |
2,491,700 |
1959 |
|
32 |
Trinity |
Clair Engle |
Trinity |
CA |
2,450,000 |
1962 |
|
33 |
New Melones |
New Melones |
Stanislaus |
CA |
2,400,000 |
1979 |
|
34 |
Tuttle Creek |
Tuttle Creek |
Big Blue |
KS |
2,346,000 |
1962 |
|
35 |
Elephant Butte |
Elephant Butte |
Rio Grande |
NM |
2,110,000 |
1916 |
|
36 |
Center Hill |
Center Hill |
Caney Fork |
TN |
2,092,000 |
1948 |
|
37 |
Barkley |
Barkley |
Cumberland |
KY |
2,082,000 |
1964 |
|
|
DAM |
RESERVOIR |
RIVER |
STATE |
CAPACITY |
DATE |
|
38 |
Canyon Ferry |
Canyon Ferry |
Missouri |
MT |
2,050,519 |
1954 |
|
39 |
San Luis |
San Luis |
San Luis |
CA |
2,040,000 |
1967 |
|
40 |
Whitney |
Whitney |
Brazos |
TX |
1,999,500 |
1953 |
|
41 |
Norfolk |
Norfolk |
North Fork |
AR |
1,983,000 |
1943 |
|
42 |
Marshall Ford |
Travis |
Colorado River |
TX |
1,953,936 |
1942 |
|
43 |
Beaver |
Beaver |
White |
AR |
1,952,000 |
1963 |
|
44 |
Big Bend |
Sharpe |
Missouri |
SD |
1,884,000 |
1964 |
|
45 |
Millwood |
Millwood |
Little |
AK |
1,854,930 |
1966 |
|
46 |
Red Rock |
Red Rock |
Des Moines |
IA |
1,830,000 |
1969 |
|
47 |
Keystone |
Keystone |
Arkansas |
OK |
1,737,600 |
1964 |
|
48 |
Navajo |
Navajo |
San Juan |
NM |
1,708,600 |
1963 |
|
49 |
Dale Hollow |
Dale Hollow |
Obey |
TN |
1,706,000 |
1943 |
|
50 |
Stockton |
Stockton |
Sac |
MO |
1,674,000 |
1969 |
|
51 |
American Falls |
American Falls |
Snake |
ID |
1,670,000 |
1978 |
|
52 |
Monticello |
Berryessa |
Putah |
CA |
1,600,000 |
1957 |
|
53 |
Sardis |
Sardis |
L. Tallahatchie |
MS |
1,570,000 |
1940 |
|
54 |
McNary |
McNary |
Columbia |
OR/WA |
1,550,000 |
1953 |
|
55 |
Cherokee |
Cherokee |
Holston |
TN |
1,541,000 |
1942 |
|
56 |
Oologah |
Oologah |
Verdigris |
OK |
1,519,000 |
1963 |
|
57 |
Douglas |
Douglas |
French Broad |
TN |
1,461,000 |
1943 |
|
58 |
Fontana |
Fontana |
L. Tennessee |
NC |
1,443,000 |
1945 |
|
59 |
Clarence Cannon |
Mark Twain |
Salt |
MO |
1,428,000 |
1983 |
|
60 |
Palisades |
Palisades |
S.F., Snake |
ID |
1,401,000 |
1957 |
|
61 |
Stanford |
Meredith |
Canadian |
TX |
1,382,478 |
1965 |
|
62 |
Broken Bow |
Broken Bow |
Mountain Fork |
OK |
1,368,230 |
1968 |
|
63 |
Tiber |
Elwell |
Marias |
MT |
1,368,157 |
1956 |
|
64 |
Kaw |
Kaw |
Arkansas |
OK |
1,348,000 |
1976 |
|
65 |
Roosevelt |
Roosevelt |
Salt |
AZ |
1,336,700 |
1936 |
|
66 |
Yellowtail |
Bighorn |
Bighorn |
WY |
1,328,360 |
1966 |
|
67 |
Fort Gibson |
Fort Gibson |
Grand |
OK |
1,284,400 |
1953 |
|
68 |
North/Dry Falls |
Banks |
Columbia |
WA |
1,280,000 |
1951 |
|
69 |
Island Park |
Island Park |
Henry's Fork |
ID |
1,280,000 |
1938 |
|
70 |
Tenkiller |
Tenkiller |
Illinois |
OK |
1,230,000 |
1952 |
|
71 |
Coolidge |
San Carlos |
Gila |
AZ |
1,222,000 |
1928 |
|
72 |
Abiquiu |
Abiquiu |
Rio Chama |
NM |
1,212,000 |
1963 |
|
73 |
Kinzua |
Kinzua |
Allegheny |
PA |
1,180,000 |
1965 |
|
74 |
Watts Bar |
Watts Bar |
Tennessee |
TN |
1,175,000 |
1942 |
|
75 |
Milford |
Milford |
Republican |
KS |
1,160,000 |
1965 |
|
76 |
Albeni Falls |
Albeni Falls |
Pend Oreille |
ID |
1,153,000 |
1952 |
|
77 |
Owyhee |
Owyhee |
Owyhee |
OR |
1,120,000 |
1932 |
|
78 |
Strawberry |
Strawberry |
Strawberry |
UT |
1,106,500 |
1974 |
|
79 |
Pickwick Landing |
Pickwick Landing |
Tennessee |
TN |
1,105,000 |
1938 |
|
80 |
Belton |
Belton |
Leon |
TX |
1,097,600 |
1954 |
|
81 |
Wheeler |
Wheeler |
Tennessee |
AL |
1,069,000 |
1936 |
|
|
DAM |
RESERVOIR |
RIVER |
STATE |
CAPACITY |
DATE |
|
82 |
Guntersville |
Guntersville |
Tennessee |
AL |
1,049,000 |
1939 |
|
83 |
Alamo |
Alamo |
Bill Williams |
AZ |
1,046,310 |
1968 |
|
84 |
Seminoe |
Seminoe |
North Platte |
WY |
1,017,273 |
1939 |
|
85 |
Pathfinder |
Pathfinder |
North Platte |
WY |
1,016,507 |
1909 |
|
86 |
Folsom |
Folsom |
American |
CA |
1,010,000 |
1956 |
|
87 |
Pine Flat |
Pine Flat |
Kings |
CA |
1,000,000 |
1954 |
APPENDIX 2B RIVERS IN THE U.S. WILD AND SCENIC RIVERS SYSTEM
The following table identifies rivers formally included in the U.S. Wild and Scenic Rivers System. Data source: American Rivers, Inc. (1990), updated to include all additions as of July 1, 1992.
|
|
RIVER |
STATE |
MILES |
YEAR |
|
1 |
Middle Fork, Clearwater |
ID |
185 |
1968 |
|
2 |
Eleven Point |
MO |
44.4 |
1968 |
|
3 |
Feather |
CA |
77.6 |
1968 |
|
4 |
Rio Grande |
NM |
52.75 |
1968 |
|
5 |
Rio Grande |
TX |
191.2 |
1978 |
|
6 |
Rogue |
OR |
84.5 |
1968 |
|
7 |
St. Croix |
MN, WI |
200 |
1968 |
|
8 |
Lower St. Croix |
MN, WI |
27 |
1972 |
|
9 |
2nd Lower St. Croix |
MN, WI |
25 |
1976 |
|
10 |
Middle Fork, Salmon |
ID |
104 |
1968 |
|
11 |
Salmon |
ID |
125 |
1980 |
|
12 |
Wolf |
WI |
25 |
1968 |
|
13 |
Allagash |
ME |
95 |
1970 |
|
14 |
Little Miami |
OH |
66 |
1973 |
|
15 |
2nd Little Miami |
OH |
28 |
1980 |
|
16 |
Chattooga |
NC, SC, GA |
56.9 |
1974 |
|
17 |
Little Beaver |
OH |
33 |
1975 |
|
18 |
Snake |
ID, OR |
66.9 |
1975 |
|
19 |
Rapid |
ID |
26.8 |
1975 |
|
20 |
New |
NC |
26.5 |
1976 |
|
21 |
Missouri |
MT |
149 |
1976 |
|
22 |
Missouri |
NE, SD |
59 |
1978 |
|
23 |
Flathead |
MT |
219 |
1976 |
|
24 |
Obed |
TN |
45.2 |
1976 |
|
25 |
Pere Marquette |
MI |
66.4 |
1978 |
|
26 |
Skagit |
WA |
157.5 |
1978 |
|
27 |
Upper Delaware |
NY, PA |
75.4 |
1978 |
|
28 |
Middle Delaware |
NY, PA, NJ |
35 |
1978 |
|
29 |
North Fork, American |
CA |
38.3 |
1978 |
|
|
RIVER |
STATE |
MILES |
YEAR |
|
30 |
Lower American |
CA |
23 |
1981 |
|
31 |
Saint Joe |
ID |
66.3 |
1978 |
|
32 |
Alagnak |
AK |
67 |
1980 |
|
33 |
Alatna |
AK |
83 |
1980 |
|
34 |
Aniakchak |
AK |
63 |
1980 |
|
35 |
Charley |
AK |
208 |
1980 |
|
36 |
Chilikadrotna |
AK |
11 |
1980 |
|
37 |
John |
AK |
52 |
1980 |
|
38 |
Kobuk |
AK |
110 |
1980 |
|
39 |
Mulchatna |
AK |
24 |
1980 |
|
40 |
North Fork, Koyukuk |
AK |
102 |
1980 |
|
41 |
Noatak |
AK |
330 |
1980 |
|
42 |
Salmon |
AK |
70 |
1980 |
|
43 |
Tinayguk |
AK |
44 |
1980 |
|
44 |
Tlikakila |
AK |
51 |
1980 |
|
45 |
Andreafsky |
AK |
262 |
1980 |
|
46 |
Ivishak |
AK |
80 |
1980 |
|
47 |
Nowitna |
AK |
225 |
1980 |
|
48 |
Selawik |
AK |
160 |
1980 |
|
49 |
Sheenjek |
AK |
160 |
1980 |
|
50 |
Wind |
AK |
140 |
1980 |
|
51 |
Beaver Creek |
AK |
111 |
1980 |
|
52 |
Birch Creek |
AK |
126 |
1980 |
|
53 |
Delta |
AK |
62 |
1980 |
|
54 |
Fortymile |
AK |
392 |
1980 |
|
55 |
Gulkana |
AK |
181 |
1980 |
|
56 |
Unalakleet |
AK |
80 |
1980 |
|
57 |
Klamath |
CA |
286 |
1981 |
|
58 |
Trinity |
CA |
203 |
1981 |
|
59 |
Eel |
CA |
394 |
1981 |
|
60 |
Smith |
CA |
325.4 |
1981 |
|
61 |
Verde |
AZ |
40.5 |
1984 |
|
62 |
Tuolumne |
CA |
83 |
1984 |
|
63 |
Au Sable |
MI |
23 |
1984 |
|
64 |
Owyhee |
OR |
112 |
1984 |
|
65 |
Illinois |
OR |
50.4 |
1984 |
|
66 |
Loxahatchee |
FL |
7.5 |
1985 |
|
67 |
Horsepasture |
NC |
4.2 |
1986 |
|
|
RIVER |
STATE |
MILES |
YEAR |
|
68 |
Cache la Poudre |
CO |
76 |
1986 |
|
69 |
Black Creek |
MS |
21 |
1986 |
|
70 |
Saline Bayou |
LA |
19 |
1986 |
|
71 |
Klickitat |
WA |
10 |
1986 |
|
72 |
White Salmon |
WA |
9 |
1986 |
|
73 |
Merced |
CA |
113.5 |
1987 |
|
74 |
Kings |
CA |
81 |
1987 |
|
75 |
Kern |
CA |
151 |
1987 |
|
76 |
Wildcat Creek |
NH |
14.5 |
1988 |
|
77 |
Sipsey Fork, West Fork |
AL |
61.4 |
1988 |
|
78 |
Big Marsh Creek |
OR |
15 |
1988 |
|
79 |
Chetco |
OR |
44.5 |
1988 |
|
80 |
Clakamas |
OR |
47 |
1988 |
|
81 |
Crescent Creek |
OR |
10 |
1988 |
|
82 |
Crooked |
OR |
15 |
1988 |
|
83 |
Deschutes |
OR |
173.4 |
1988 |
|
84 |
Donner und Blitzen |
OR |
72.7 |
1988 |
|
85 |
Eagle Creek |
OR |
27 |
1988 |
|
86 |
Elk |
OR |
19 |
1988 |
|
87 |
Grande Ronde |
OR |
43.8 |
1988 |
|
88 |
Imnaha |
OR |
77 |
1988 |
|
89 |
John Day |
OR |
147.5 |
1988 |
|
90 |
Joseph Creek |
OR |
8.6 |
1988 |
|
91 |
Little Deschutes |
OR |
12 |
1988 |
|
92 |
Lostine |
OR |
16 |
1988 |
|
93 |
Halheur |
OR |
13.7 |
1988 |
|
94 |
McKenzie |
OR |
12.7 |
1988 |
|
95 |
Metollus |
OR |
28.6 |
1988 |
|
96 |
Minam |
OR |
39 |
1988 |
|
97 |
North Fork, Crooked |
OR |
32.3 |
1988 |
|
98 |
North Fork, John Day |
OR |
53.8 |
1988 |
|
99 |
North Fork, Malheur |
OR |
25.5 |
1988 |
|
100 |
N. Fk., M. Fk., Willamette |
OR |
42.3 |
1988 |
|
101 |
North Fork, Owyhee |
OR |
9.6 |
1988 |
|
102 |
North Fork, Smith |
OR |
13 |
1988 |
|
103 |
North Fork, Sprague |
OR |
15 |
1988 |
|
104 |
North Powder |
OR |
6 |
1988 |
|
105 |
North Umpqua |
OR |
33.8 |
1988 |
|
|
RIVER |
STATE |
MILES |
YEAR |
|
106 |
Powder |
OR |
11.7 |
1988 |
|
107 |
Quartzville Creek |
OR |
12 |
1988 |
|
108 |
Roaring |
OR |
13.7 |
1988 |
|
109 |
Salmon |
OR |
33.5 |
1988 |
|
110 |
Sandy |
OR |
24.9 |
1988 |
|
111 |
South Fork, John Day |
OR |
47 |
1988 |
|
112 |
Squaw Creek |
OR |
15.4 |
1988 |
|
113 |
Sycan |
OR |
59 |
1988 |
|
114 |
Upper Rogue |
OR |
40.3 |
1988 |
|
115 |
Wenaha |
OR |
21.6 |
1988 |
|
116 |
West Little Owyhee |
OR |
57.6 |
1988 |
|
117 |
White |
OR |
46.5 |
1988 |
|
118 |
Bluestone |
WV |
17 |
1988 |
|
119 |
Rio Chama |
NM |
24.6 |
1988 |
|
120 |
Middle Fork, Vermillion |
IL |
17.1 |
1989 |
|
121 |
East Fork, Jemez |
NM |
11 |
1990 |
|
122 |
Pecos |
NM |
20.7 |
1990 |
|
123 |
Clarks Fk., Yellowstone |
WY |
20.5 |
1990 |
|
124 |
Niobrara |
NE |
95 |
1991 |
|
125 |
Missouri |
NE |
39 |
1991 |


