
Mortality by Cause, 1970 to 2015
Rodolfo A.Bulatao
BACKGROUND
National data on causes of death provide a view of the overall health status of a population. They suggest what diseases and conditions should be of major concern and where a country stands in relation to others and in relation to the epidemiological transition (Omran, 1971). They can provide guidance on health priorities and feedback on the effects of interventions. As mortality falls worldwide, health conditions increasingly deviate from a simple unilinear trend (Frenk et al., 1989). Consequently, policymakers need to pay close attention to trends in causes of death in order to understand the health needs of changing populations.
Because of the many deficiencies of cause-of-death data, particularly in areas of high mortality, even a simple classification of deaths is difficult to achieve. Country reports to the World Health Organization (WHO) of causes of death are supplemented with regression estimates for the many nonreporting countries. The regression approach, initiated by Preston (1976) and continued by Hakulinen et al. (1986a, b), estimates mortality rates for different
Rodolfo A.Bulatao is with the World Bank. The author wishes to thank Alan D.Lopez for data, insights, and suggestions, and Patience W.Stephens for research assistance. Thanks also to David Dunlop, Richard Feachem, E.Robert Greenberg, Scott B.Halstead, Dean T.Jamison, Bernhard Liese, Jose Martinez, Alberto Torres, and Patrick Vaughan, as well as participants in meetings for the World Bank health sector priorities review, for their comments and suggestions.
causes as functions of overall mortality levels. This approach has also been applied to specific causes, such as cancer deaths (Parkin et al., 1988).
The equations developed by Hakulinen et al. for different age-sex groups are applied here. Besides updating their estimates (from 1980 to 1985), this paper incorporates new data not available to them, attempts a more detailed classification based on seven major causes, and provides perspectives on possible future trends.
Estimates were made by sex and age (for six age groups: 0, 1–4, 5–14, 15–44, 45–64, and 65 and older) for four years (1970, 1985, 2000, and 2015) and six regions or country groups (industrial market economies, industrial nonmarket economies, Latin America and the Caribbean, sub-Saharan Africa, the Middle East and North Africa, and Asia and the Pacific).
METHOD
Grouping Causes of Death
The seven major causes of death considered here are infectious and parasitic diseases, neoplasms, circulatory system and certain degenerative diseases, complications of pregnancy, certain perinatal conditions, injury and poisoning, and other causes. These categories are identical to those used by Hakulinen et al. to permit the application of their equations. Categories correspond to specific codes in the International Statistical Classification of Diseases, Injuries, and Causes of Death, eighth and ninth revisions (ICD-8 and ICD-9: World Health Organization, 1977; see Bulatao and Stephens, 1992: Table 1 for the correspondence).
Two categories require some explanation. The infectious and parasitic diseases include bronchitis, emphysema, and asthma because of the important infectious bronchitis component, which was not separable from the others. Circulatory system and certain degenerative diseases include diabetes, nephritis, cirrhosis of the liver, and ulcers of the stomach and duodenum, not because of any presumed similarity in etiology or pathogenesis but to keep the number of categories manageable by combining the degenerative diseases other than cancer.
Three of these major causes were further subdivided into 21 specific causes of death, as shown in Table 1. These specific causes were chosen mainly for substantive interest. One of them—diarrhea—corresponds to a subcategory used by Hakulinen.
Among these specific causes, not all could be defined with precision. For example, the codes selected from ICD-9 for micronutrient disorders were those for disorders of the thyroid gland, anemias, and avitaminosis. This group of causes may be both too broad and too narrow in different ways, but further specification was not possible.
TABLE 1 Major and Specific Causes of Death
|
Infectious and Parasitic Diseases |
Circulatory System and Certain Degenerative Diseases |
Other Causes |
|
Diarrhea |
Ischemic heart disease |
Mental disorders |
|
Tuberculosis |
Cerebrovascular disease |
Oral health diseases |
|
Acute respiratory infection |
Other cardiovascular diseases |
Micronutrient disorders |
|
Measles |
Diabetes |
Malnutrition |
|
Chronic obstructive pulmonary disease (COPD) |
Certain degenerative diseases (nephritis, cirrhosis, ulcers) |
Unspecified other causes |
|
Polio |
|
|
|
Yellow fever, dengue, and encephalitis |
|
|
|
Malaria |
|
|
|
Schistosomiasis and filariasis |
|
|
|
Intestinal parasites |
|
|
|
Other infectious and parasitic diseases |
|
|
Data on Causes of Death
Although data on causes of death can be problematic, these data are used largely as reported by WHO, without attempting such corrections as regrouping codes or reallocating undefined causes. (WHO has procedures for scrutinizing the data before including them in its reports.) The limitations that remain are discussed, and the data for three countries require specific comment.
Reports on causes of death for around 1970 and 1985 cover a limited number of countries, and their reliability is a matter of concern. About 70 countries or territories annually provide WHO with statistics on causes of death by sex and age, using the ICD. For about 40 of these countries, most of them developed, the data can be considered reliable. The remaining 30 countries’ reports may cover as little as half of the population (though some cover everyone) and usually include 5–20 percent of deaths ascribed to ill-defined conditions. (Bulatao and Stephens, 1992: Tables A1 and A2, list the countries and give data coverage and quality.)
Data quality depends critically on medical certification of causes of death. In remote areas with few or no physicians, diagnosis is uncertain and many deaths are coded to symptoms and ill-defined conditions. In addition, incomplete coverage by the vital registration system will likely bias the picture toward the chronic disease pattern more common in urban areas. Furthermore, despite the common set of procedures defined by ICD-
9 for coding and certifying the cause of death, data across countries are still affected by variations in diagnostic preferences, cultural factors, medical training, the availability of diagnostic aids, and other factors.
The data provide underlying causes of death; associated or contributory conditions are not reported. It is difficult to predict how the importance of associated causes will change as countries progress through the epidemiological transition. Certainly under the regime of infectious diseases, malnutrition will frequently underlie many deaths from diarrheal diseases or acute respiratory infections. On the other hand, as death is increasingly postponed to older ages, multiple pathologies at or near the time of death become relatively common. Given the complications and the lack of data, this paper discusses only underlying causes.
Of the countries reporting to WHO, China, India, and the former USSR have data with special characteristics. The Chinese data are from a survey covering 57 million urban residents and 42 million rural residents spread over the eastern part of the country. The 580,000 deaths recorded, though only 7 percent of estimated annual Chinese deaths, should be reasonably indicative of the mortality pattern for 70–80 percent of the population.
The Indian data are from a 1986 cause-of-death survey of 1,200 rural primary health care centers spread throughout India, and covered 10,075 male and 8,187 female deaths (0.2 percent of estimated Indian deaths). Coding was idiosyncratic, but the major causes and some of the specific causes were still distinguishable.
For the former USSR (which was still a single country in 1985 and is treated as such in this paper), the data reported to WHO permitted identification of deaths due to diarrhea, most circulatory system diseases (excluding cirrhosis of the liver), and measles. Regression estimates were used to fill in the other causes.
For most other countries reporting to WHO, data were available on each cause of death. The major exceptions were the Latin American and Caribbean countries, for which 1970 but not 1985 data were available on other causes and four specific causes (chronic obstructive pulmonary disease, polio, mental disorders, and micronutrient disorders). Again, regression estimates filled in for the missing data.
Estimating and Projecting Mortality
Before estimating deaths by cause, overall mortality was estimated and projected. This was done country by country, for 187 countries, territories, or groups of small countries or territories covering the entire world (only aggregate results are reported). Life expectancy and infant mortality estimates for the 1985–1990 quinquennium were obtained from the best available sources; adjustments were made as needed for agreement with other
demographic parameters; and both forward and backward population projections were made.
Each country’s experience with mortality change is used to project its mortality over the period 1990–2005. Each country is assumed to revert to the average mortality trend for the world as a whole for the projection of 2005–2015. This average trend involves slower improvements as life expectancy rises. The procedure involves separate projections of life expectancy and infant mortality and the choice of “split” life tables from the Coale-Demeny (1983) set to match both parameters. Further description of the procedures is provided in Bulatao and Bos (1989).
The mortality trends are applied to the standard World Bank projections (see Bulatao et al., 1990). Two types of alternative projections were also run: “fixed mortality” projections, in which age-specific mortality rates (for five-year age groups) are taken as fixed at 1985–1990 levels throughout the projection period; and “fixed distribution” projections, in which mortality changes as in the standard projections, but the distribution of deaths by cause within each of the six larger age groups does not change from 1985. These alternative projections allow some decomposition of projected changes in the cause-of-death structure.
Estimating Mortality Rates by Major Cause
Mortality rates by major cause were obtained from actual data and from previously estimated regression equations. Data reported to WHO were used wherever possible for the years 1970 and 1985. These data were adjusted proportionally where necessary to produce the mortality levels separately estimated.
The regression equations for major causes of death, obtained from Hakulinen et al. (1986a), predict mortality rates by cause for age-sex groups as linear functions of mortality rates for all causes. To take into account differences in age structure within broad age groups, separate equations (generally only slightly different) were estimated for each of 24 world regions. This was not necessary for the first two age groups, 0 and 1–4, which are narrower than the other groups and for which only world and not regional equations are available.
Essentially these regression equations indicate that mortality rates for most causes, except neoplasms, increase with overall mortality. The increases are greatest for infectious and parasitic diseases (slopes around 0.5, meaning that half of the increase in deaths is attributable to this major cause), followed by other causes (slopes around 0.25) and perinatal conditions (slope of 0.22, for age group 0 only). Slopes vary considerably by age group: for infectious and parasitic diseases, they vary from 0.7 for those 1–4 years old to 0.4 for those 65 and older. Slopes also vary by sex: for
neoplasms among those 65 and older, the slope for males is −0.13 and for females −0.04. Nevertheless, the trend across age groups is similar for males and females. In contrast, slopes hardly vary across regions, with the largest gap between regions for a given cause and sex and age group being around 0.04. The equations for lower-mortality, more developed regions do appear to diverge more often from the norm, though only minimally. When the number of regions and the rarity of even small differences in the equations are considered, the case for distinct cause-of-death structures across regions is weak.
Where reported data were not available, results from the equations specific to each of the 24 regions were used. For 2000 and 2015, the same region-specific equations were applied for the industrial market economies. Other countries were allowed to switch to the equations for developed countries as a group if their mortality levels had declined to a standardized death rate (by using the 1985 age structure for the world) below 6. (The industrial market economies as a group have a standardized crude death rate of 5.8 for 1985, as contrasted, for example, with 9.0 for Latin America and the Caribbean.)
Estimating Cause-Specific Mortality Rates
New regression equations were estimated for mortality rates from 21 specific causes by using the rate for the major cause under which each falls as the predictor. The data, the specifications, and the results of the regressions are described.
Data for 1970 and 1985 were pooled; 1970 data were used for 65 countries (34 of them developing, mostly Latin American) and 1985 data for 69 countries (38 developing). China was included, but India and the former USSR were omitted because of the number of causes for which estimates could not be produced. Although data quality varies for the countries included, imposing a more rigorous standard would bias the sample strongly toward developed countries.
For each country, mortality rates by cause were first adjusted to correspond to the separately determined overall mortality levels. Rates based on fewer than 10,000 people in the age-sex group were excluded. Three equations were then estimated for each disease in each age-sex group: a quadratic specification, where the rate for the specific cause depended on the rate for the major cause and the square of this rate, as well as on a dummy variable for data year; a corresponding linear specification; and a specification in which the rate for the specific cause depended only on two dummy variables, for developing country status and data year.
If the quadratic term achieved a 5 percent level of significance, the quadratic equation was chosen; if not, and the linear term achieved a 5
percent level of significance, the linear equation was chosen; in all remaining cases, the dummy variable equation was chosen. Of the 264 final equations, half were quadratic, one-third linear, and the remainder dummy variable equations. The dummy variable for data year had a significant effect in 20 percent of the equations chosen.
Some cause-specific mortality rates were predicted better than others. R2 varied much more by cause than by age-sex group, permitting the grouping of equations by cause:
-
mean R2 greater than .70: diarrhea, acute respiratory infection, other cardiovascular diseases, and unspecified causes;
-
mean R2 between .35 and .60: tuberculosis, measles, chronic obstructive pulmonary disease, other infectious and parasitic diseases, cerebrovascular disease, nephritis/cirrhosis/ulcers, micronutrient disorders, and malnutrition;
-
mean R2 between .20 and .25: intestinal parasites, ischemic heart disease, and diabetes; and
-
mean R2 below .20: polio, malaria, yellow fever/dengue/encephalitis, schistosomiasis/filariasis, mental disorders, and oral health diseases.
The last group also accounted for almost all the dummy variable equations, meaning that developed or developing country averages were essentially applied for these causes.
RESULTS
Demographic Background
Demographic factors affect the cause-of-death structure. From 1985 to 2015, world population is expected to increase by 75 percent, but the population of sub-Saharan Africa will increase by 150 percent. Changes in mortality are implicit in these projections, with much lower overall rates and changes in age-, sex-, and cause-specific rates.
For instance, the population age 45 and over in developing countries is projected to more than double between 1985 and 2015, rising from 17 to 24 percent of the total. Causes of death, which are closely related to age at death, will change accordingly. For developing countries, infant mortality is projected to fall from 78 per thousand in 1985 to 43 per thousand in 2015, and life expectancy at birth to rise by five years. Such mortality trends imply changes in causes of death, which differ by mortality level.
In each region, life expectancy is expected to rise, but starting at different levels and failing to converge by 2015. Life expectancy in industrial market economies will rise from 76.2 years in 1985 to 77.9 years in 2015. Life expectancy in sub-Saharan Africa will rise from 51.3 years in 1985 to
61.3 years in 2015. The other four regions will follow intermediate paths, none of them crossing. Even with projected improvements across the board, regional differentiation will remain sharp: by 2015, life expectancy in sub-Saharan Africa will have barely caught up with 1985 life expectancy in the Middle East and North Africa, and will not have caught up with 1985 life expectancy in any other region.
On the other hand, crude death rates will converge. Regional rates vary as one would expect, being clearly highest in sub-Saharan Africa and lowest in Latin America and the Caribbean. The latter region has more young people than the developed country regions, which accounts for its lower risk of death. With the projected improvements in life expectancy, the crude death rate is not expected to fall monotonically. Rates level off at 5 to 10 per thousand, after which they increase slightly as the numbers of elderly increase. Given these trends, variability across regions in crude death rates is projected to diminish considerably by 2000 and 2015.
Current Causes of Death
Estimated mortality rates by major cause are shown in Table 2 by sex, region, and year, but without age breakdowns, and numbers of deaths by cause and region are shown in Table 3. Patterns for 1970 and 1985 are considered first. The leading causes of death for the world as whole for both 1970 and 1985 were infectious and parasitic diseases and circulatory system diseases. Parasitic and infectious diseases were more important in developing countries, and circulatory system diseases were more important in developed countries. Like infectious and parasitic diseases, death rates from certain perinatal conditions were much more important for developing countries, but for the world as a whole, deaths from certain perinatal conditions accounted for only one-fourth or one-fifth as many deaths as infectious diseases in 1985 (3,321 compared to 14,764). Like circulatory system diseases, neoplasms were more important in developed than in developing countries, but over all countries accounted for only one-third the number of deaths (4,903 compared to 13,208). The category of other causes and injury and poisoning provide weak contrasts between developed and developing countries, and complications of pregnancy account for only a small proportion of deaths.
Figure 1 compares these results with estimates that Hakulinen et al. (1986a) made for 1980. Although the equations were the same, Hakulinen incorporated earlier reported data for fewer countries. Nevertheless, results are generally consistent, with their estimated rates for 1980 usually falling between the 1970 and 1985 estimates. Comparisons for specific regions (not shown), despite being complicated by differences in country groupings, also show general agreement. For sub-Saharan Africa, Hakulinen et al.
TABLE 2 Estimated and Projected Mortality Rates (per 100,000), by Major Cause, Sex, and Region, 1970–2015
|
|
1970 |
1985 |
2000 |
2015 |
||||
|
Region and Cause |
Male |
Female |
Male |
Female |
Male |
Female |
Male |
Female |
|
World |
||||||||
|
All causes |
1293 |
1281 |
1064 |
1004 |
863 |
802 |
880 |
776 |
|
Infections |
449 |
449 |
318 |
294 |
176 |
179 |
140 |
133 |
|
Neoplasms |
95 |
96 |
108 |
96 |
108 |
98 |
128 |
114 |
|
Circulatory |
297 |
324 |
262 |
286 |
292 |
283 |
339 |
314 |
|
Pregnancy |
0 |
13 |
0 |
9 |
0 |
9 |
0 |
7 |
|
Perinatal |
86 |
70 |
79 |
59 |
48 |
36 |
37 |
27 |
|
Injury |
93 |
40 |
97 |
56 |
78 |
31 |
79 |
32 |
|
Other |
273 |
289 |
201 |
204 |
161 |
167 |
157 |
150 |
|
Developed Countries |
||||||||
|
All causes |
1054 |
1069 |
1047 |
1013 |
997 |
963 |
1161 |
1059 |
|
Infections |
146 |
112 |
109 |
74 |
78 |
59 |
90 |
63 |
|
Neoplasms |
167 |
163 |
203 |
172 |
182 |
170 |
213 |
188 |
|
Circulatory |
463 |
552 |
473 |
563 |
486 |
536 |
575 |
597 |
|
Pregnancy |
0 |
2 |
0 |
1 |
0 |
1 |
0 |
1 |
|
Perinatal |
26 |
10 |
15 |
10 |
13 |
9 |
13 |
7 |
|
Injury |
99 |
51 |
87 |
40 |
77 |
37 |
80 |
39 |
|
Other |
153 |
180 |
161 |
154 |
160 |
152 |
191 |
163 |
|
Developing Countries |
||||||||
|
All causes |
1383 |
1373 |
1070 |
1001 |
830 |
759 |
823 |
714 |
|
Infections |
564 |
595 |
382 |
368 |
200 |
211 |
150 |
148 |
|
Neoplasms |
68 |
68 |
78 |
70 |
90 |
79 |
111 |
98 |
|
Circulatory |
234 |
225 |
198 |
192 |
244 |
216 |
291 |
252 |
|
Pregnancy |
0 |
18 |
0 |
12 |
0 |
11 |
0 |
9 |
|
Perinatal |
109 |
96 |
98 |
75 |
56 |
43 |
42 |
31 |
|
Injury |
91 |
35 |
100 |
62 |
78 |
29 |
79 |
30 |
|
Other |
318 |
336 |
213 |
221 |
162 |
171 |
150 |
147 |
|
Industrial Market |
||||||||
|
All causes |
1036 |
1021 |
986 |
950 |
1007 |
943 |
1173 |
1045 |
|
Infections |
106 |
85 |
82 |
66 |
64 |
47 |
68 |
38 |
|
Neoplasms |
186 |
169 |
240 |
192 |
196 |
171 |
236 |
200 |
|
Circulatory |
500 |
567 |
461 |
518 |
513 |
551 |
615 |
639 |
|
Pregnancy |
0 |
0 |
0 |
0 |
0 |
0 |
0 |
0 |
|
Perinatal |
21 |
7 |
8 |
5 |
10 |
6 |
10 |
5 |
|
Injury |
98 |
58 |
74 |
40 |
70 |
36 |
74 |
40 |
|
Other |
125 |
135 |
120 |
128 |
154 |
131 |
171 |
123 |
|
Nonmarket |
||||||||
|
All causes |
1089 |
1155 |
1162 |
1126 |
980 |
1000 |
1139 |
1082 |
|
Infections |
224 |
159 |
158 |
88 |
103 |
79 |
128 |
106 |
|
Neoplasms |
129 |
152 |
136 |
135 |
158 |
169 |
173 |
168 |
|
|
1970 |
1985 |
2000 |
2015 |
||||
|
Region and Cause |
Male |
Female |
Male |
Female |
Male |
Female |
Male |
Female |
|
Nonmarket— |
||||||||
|
Circulatory |
392 |
524 |
495 |
644 |
437 |
509 |
505 |
526 |
|
Pregnancy |
0 |
4 |
0 |
3 |
0 |
2 |
0 |
2 |
|
Perinatal |
37 |
15 |
28 |
17 |
20 |
13 |
19 |
11 |
|
Injury |
100 |
40 |
109 |
39 |
90 |
38 |
90 |
37 |
|
Other |
209 |
260 |
237 |
200 |
172 |
189 |
225 |
231 |
|
Latin America and Caribbean |
||||||||
|
All causes |
1097 |
903 |
883 |
706 |
677 |
557 |
722 |
594 |
|
Infections |
366 |
301 |
211 |
177 |
100 |
86 |
67 |
55 |
|
Neoplasms |
79 |
76 |
76 |
70 |
94 |
86 |
122 |
109 |
|
Circulatory |
238 |
214 |
228 |
196 |
242 |
215 |
306 |
275 |
|
Pregnancy |
0 |
12 |
0 |
6 |
0 |
4 |
0 |
3 |
|
Perinatal |
61 |
42 |
65 |
44 |
40 |
28 |
30 |
20 |
|
Injury |
98 |
31 |
90 |
29 |
76 |
28 |
78 |
29 |
|
Other |
255 |
227 |
213 |
184 |
124 |
111 |
119 |
102 |
|
Sub-Saharan Africa |
||||||||
|
All causes |
2163 |
1882 |
1727 |
1448 |
1196 |
1024 |
947 |
785 |
|
Infections |
1070 |
937 |
817 |
683 |
498 |
430 |
346 |
286 |
|
Neoplasms |
52 |
57 |
52 |
55 |
54 |
55 |
60 |
60 |
|
Circulatory |
243 |
226 |
209 |
191 |
182 |
169 |
180 |
162 |
|
Pregnancy |
0 |
27 |
0 |
21 |
0 |
17 |
0 |
14 |
|
Perinatal |
200 |
157 |
167 |
129 |
119 |
90 |
82 |
61 |
|
Injury |
108 |
39 |
96 |
34 |
86 |
30 |
82 |
28 |
|
Other |
491 |
438 |
386 |
334 |
258 |
233 |
196 |
174 |
|
Middle East and North Africa |
||||||||
|
All causes |
1563 |
1520 |
1184 |
1121 |
775 |
733 |
691 |
624 |
|
Infections |
624 |
653 |
459 |
473 |
209 |
237 |
142 |
164 |
|
Neoplasms |
60 |
56 |
65 |
60 |
69 |
62 |
81 |
70 |
|
Circulatory |
250 |
224 |
200 |
183 |
191 |
171 |
209 |
176 |
|
Pregnancy |
0 |
21 |
0 |
13 |
0 |
12 |
0 |
10 |
|
Perinatal |
140 |
126 |
120 |
97 |
73 |
57 |
52 |
39 |
|
Injury |
90 |
37 |
80 |
32 |
75 |
28 |
76 |
28 |
|
Other |
400 |
404 |
260 |
263 |
157 |
166 |
131 |
137 |
|
Asia |
||||||||
|
All causes |
1280 |
1342 |
963 |
946 |
784 |
736 |
833 |
734 |
|
Infections |
506 |
577 |
319 |
323 |
149 |
176 |
110 |
119 |
|
Neoplasms |
70 |
70 |
85 |
74 |
101 |
87 |
130 |
113 |
|
Circulatory |
230 |
227 |
191 |
194 |
268 |
235 |
338 |
292 |
|
Pregnancy |
0 |
17 |
0 |
11 |
0 |
10 |
0 |
8 |
|
Perinatal |
98 |
91 |
88 |
67 |
42 |
32 |
30 |
22 |
|
Injury |
87 |
34 |
105 |
78 |
77 |
29 |
79 |
31 |
TABLE 3 Deaths by Major and Specific Cause (in thousands), by Region, 1985
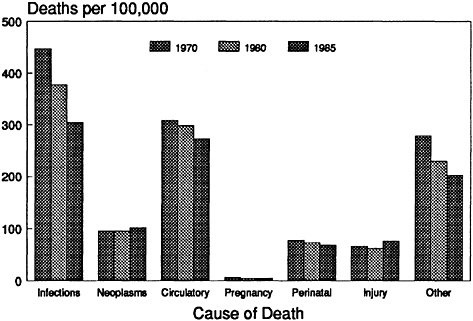
FIGURE 1 Mortality by cause, world, 1970–1985.
assumed slightly higher overall mortality levels than those used here, but their distribution of deaths across causes is still similar.
The estimates suggest that substantial change can take place in a short period. For developing countries, the mortality rate for infectious and parasitic diseases is estimated to have declined 17 percent from 1970 to 1980 and an exceptional 22 percent in the next five years, from 1980 to 1985.
Breakdowns for 1985 of the three largest categories of major causes are summarized in Table 3, which gives numbers of deaths for both major and specific causes. Table 4 provides mortality rates standardized by using the 1985 world age structure.
Among infectious and parasitic diseases, four specific causes are the most important, accounting for at least nine out of ten deaths in each region: acute respiratory infections (pneumonia, influenza, acute bronchitis, whooping cough, and diphtheria, but not measles, which has been separated); diarrhea; other infectious and parasitic diseases; and chronic obstructive pulmonary disease. (The last, as noted earlier, is not infectious but is included here for convenience.) Tuberculosis and measles account for a few percent more, and the remaining categories are relatively rare.
Among the four dominant causes, the distribution varies considerably across regions. A major contrast is the greater relative importance of chronic obstructive pulmonary disease in developed (industrial and nonmarket) re-
gions and the greater relative importance of diarrhea in developing regions. Acute respiratory infections, being important in both developed and developing regions, are responsible for a larger share of deaths than either of these two other causes. The predominance of these four specific causes in the estimates accurately reflects the data reported to WHO. For instance, among reporting Latin American countries, acute respiratory infections account for one-quarter to one-half of all deaths due to infectious diseases in each age-sex group, and acute respiratory infections and diarrhea combined account for three-fourths of deaths under 5 years of age.
Among circulatory system diseases, ischemic heart disease, cerebrovascular disease, and other cardiovascular diseases are nearly equal in importance for the world as a whole. Regionally, ischemic heart disease is responsible for the largest share of circulatory system disease deaths in developed regions; cerebrovascular disease has the largest share in Asia; and other cardiovascular diseases have the largest share in the remaining developing regions. All of these categories are important everywhere, and each always accounts for one-fifth or more of the deaths under the major category. Diabetes is of lesser importance in these estimates, with less than 5 percent of deaths under the major category, and nephritis, cirrhosis of the liver, and ulcers of the stomach and duodenum account for roughly twice this proportion.
For the category of other causes, an attempt was made to distinguish mental disorders, oral health diseases, micronutrient deficiencies, and malnutrition. Combined, these accounted for less than 10 percent of other causes, however, leaving a large remainder unspecified.
The estimates from the regressions were compared with estimates compiled by Walsh (1988) and experts working on the World Bank health sector priorities review. In all major categories except one, the Walsh estimates were higher than the regression and experts’ estimates. The comparisons illustrate the difficulty in determining the correct mortality structure of developing countries with limited data. In principle, the expert estimates could be attained if substantial numbers of deaths classified as due to ill-defined causes were in fact caused by these specific diseases.
Trends in Major Causes of Death
Given uncertainties in figures for specific causes, only the major causes are projected into the future. Figures 2 and 3 show how the actual numbers of deaths are expected to change for developed and developing countries, and Figure 4 shows the proportional mortality trends. The two most important major causes show opposite trends, infectious diseases declining from causing 35 percent of deaths in 1970 to 16 percent of deaths in 2015, whereas diseases of the circulatory system rise, from causing 24 percent of
TABLE 4 Age-Standardized Mortality Rates (per 100,000) for Major and Specific Causes, by Region, 1985
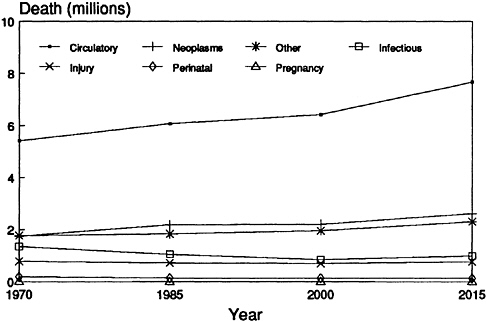
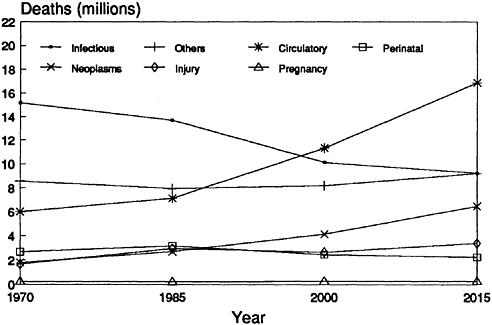
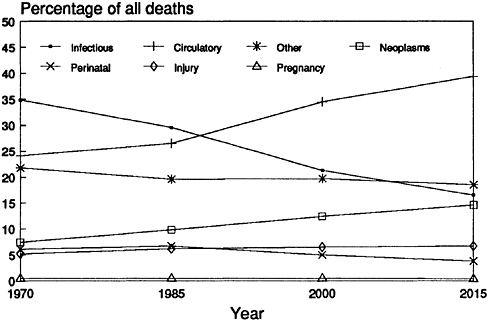
FIGURE 4 Percentage of deaths due to each major cause, world, 1970–2015.
deaths in 1970 to 39 percent in 2015. The infectious disease trend is due mainly to lower mortality from this cause in developing countries, whereas the circulatory disease trend is due to higher mortality from this cause in both developed and developing countries.
Deaths from certain perinatal conditions show a decline parallel to that for infectious and parasitic diseases. Neoplasms show an increase parallel to that for circulatory system diseases. The category of other causes is responsible for more deaths than either of these causes and is expected to decline, but somewhat gradually, and possibly because of better reporting rather than actual change. Injury and poisoning, accounting for 5 to 10 percent of deaths, and complications of pregnancy, accounting for less than 1 percent of deaths, show no clear trend.
All regions exhibit the same basic trends, the differences among them having to do mainly with being more or less advanced in the process of epidemiological transition. Mortality patterns and trends for Asia, the region with the largest population, are closest to those for the world as a whole, as shown in Table 4, with Latin America and the Caribbean, industrial nonmarket economies, and industrial market economies successively more advanced, on the one hand, and the Middle East and North Africa, and sub-Saharan Africa, successively less advanced, on the other. A convenient index for summarizing these regional contrasts, as well as the manner in which they change over time, is the ratio of deaths from circulatory system
TABLE 5 Ratio of Deaths from Circulatory System Diseases to Deaths from Infectious and Parasitic Diseases, by Region, 1970–2015
|
Region |
1970 |
1985 |
2000 |
2015 |
|
World |
0.69 |
0.89 |
1.62 |
2.39 |
|
Developed countries |
3.98 |
5.73 |
7.52 |
7.69 |
|
Developing countries |
0.40 |
0.52 |
1.12 |
1.82 |
|
Industrial market |
5.63 |
6.64 |
9.61 |
11.88 |
|
Industrial nonmarket |
2.44 |
4.72 |
5.24 |
4.41 |
|
Latin America and Caribbean |
0.68 |
1.09 |
2.46 |
4.74 |
|
Sub-Saharan Africa |
0.23 |
0.27 |
0.38 |
0.54 |
|
Middle East and North Africa |
0.37 |
0.41 |
0.81 |
1.26 |
|
Asia |
0.42 |
0.60 |
1.55 |
2.75 |
|
India |
0.40 |
0.29 |
1.01 |
1.64 |
|
China |
0.53 |
1.19 |
3.52 |
8.37 |
|
Other Asia |
0.32 |
0.56 |
1.04 |
1.69 |
diseases to deaths from infectious and parasitic diseases, as shown in Table 5. For the world as a whole, this ratio is estimated at 0.7 for 1970, 0.9 for 1985, 1.6 for 2000, and 2.4 for 2015.
The greatest numbers of deaths will continue to be in Asia, where almost half of all deaths in the world take place. This proportion is not projected to change from the pattern shown in Table 3. For all causes combined, in fact, each region will contribute about the same proportion of deaths in 2015 as in 1985. For particular causes, some changes are projected, however, with Asia contributing smaller proportions of deaths from infectious and parasitic diseases and perinatal conditions, and larger proportions of deaths from circulatory system diseases and neoplasms. Sub-Saharan African deaths will increase in proportion for the first two of these causes, and industrial market economy deaths will decrease in proportion for the last two of these causes.
The projections of mortality by cause are not straightforward extrapolations from past experience, but involve a combination of population projections with predictive equations for mortality rates by cause. An alternative, much simpler, procedure would have been to take the change in percentage of deaths due to a given cause from 1970 to 1985 and extrapolate this linearly into the future. This alternative procedure would have given quite different results: for the world as a whole by 2000, a larger share of deaths due to infectious and parasitic diseases (24 instead of 21 percent), a correspondingly smaller share due to circulatory system diseases (29 instead of 35 percent), and smaller variations for other causes. For specific regions, the differences would have been greater: for the Middle East and North Africa by 2015, for instance, a linear extrapolation would give 39 percent of
deaths due to infectious and parasitic diseases, whereas the regression-based procedures give only 23 percent.
Some insight into why the calculations come out as they do can be obtained by decomposing future changes in the distribution of deaths. Such changes may be related to changes in the age-sex structure of the population, changes in mortality levels from all causes within age-sex groups, or changes in the distribution of deaths by cause within age-sex groups. Projections with fixed mortality or fixed distributions of deaths by cause can help distinguish these components of change, if one accepts the necessary assumption that age-specific rates and mortality distribution can vary independently of each other. Table 6 shows, first, the percentage of deaths due
TABLE 6 Distribution of Deaths by Major Cause in 1985 and Incremental Changes Expected by 2015 from Three Factors, World and Developed and Developing Countries
|
|
|
Percentage Point Change by 2015 Due to |
||
|
Region and Cause |
1985 Percentage Distribution |
Age-Sex Structure |
Mortality Change |
Distribution Change |
|
World |
||||
|
Infections |
29.6 |
−1.4 |
−3.3 |
−8.4 |
|
Neoplasms |
9.8 |
1.1 |
1.1 |
2.6 |
|
Circulatory |
26.5 |
3.3 |
4.4 |
5.3 |
|
Pregnancy |
0.5 |
0.1 |
−0.2 |
0.0 |
|
Perinatal |
6.7 |
−1.8 |
−1.6 |
0.6 |
|
Injury |
7.4 |
−1.1 |
−0.7 |
1.1 |
|
Other |
19.6 |
−0.1 |
0.2 |
−1.2 |
|
Developed Countries |
||||
|
Infections |
8.8 |
−1.1 |
−0.2 |
−0.6 |
|
Neoplasms |
18.2 |
0.8 |
−0.2 |
−0.7 |
|
Circulatory |
50.4 |
2.8 |
1.5 |
−1.8 |
|
Pregnancy |
0.1 |
0.0 |
0.0 |
0.0 |
|
Perinatal |
1.2 |
−0.4 |
−0.2 |
0.3 |
|
Injury |
6.1 |
−0.9 |
−0.8 |
1.0 |
|
Other |
15.3 |
−1.2 |
−0.1 |
1.9 |
|
Developing Countries |
||||
|
Infections |
36.2 |
−3.0 |
−3.0 |
−10.8 |
|
Neoplasms |
7.2 |
1.8 |
1.0 |
3.6 |
|
Circulatory |
18.8 |
5.2 |
3.9 |
7.4 |
|
Pregnancy |
0.6 |
0.1 |
−0.2 |
0.0 |
|
Perinatal |
8.4 |
−2.6 |
−1.8 |
0.7 |
|
Injury |
7.8 |
−1.2 |
−0.6 |
1.1 |
|
Other |
21.0 |
−0.2 |
0.6 |
−2.1 |
to each cause in 1985; second, the projected increase or decrease in this percentage by 2015 due to contemplated changes in the age-sex structure, with fixed mortality assumed; third, the further projected increase or decrease in this percentage if mortality is allowed to decline but the distribution of deaths by cause is fixed within age-sex groups; and fourth, the further projected increase or decrease due to changes in the distribution of deaths by cause within age-sex groups. Totaling the components for 2015 for any given cause and adding the 1985 figure give the projected percentage of deaths due to that cause by 2015.
Table 6 indicates that the three components can operate in the same or in opposite directions. For instance, population aging, lower mortality (especially at younger ages), and changes in the distribution of deaths all contribute to the decline in infectious diseases. On the other hand, population aging and lower mortality reduce the importance of injury and poisoning, but distribution change raises their importance in relation to other causes of death.
Which of the three components exerts the greatest effect varies considerably from cause to cause. The largest effect overall is that of distributional change on infectious and parasitic diseases, but in this case the other two components operate mostly in the same direction, namely, to reduce the proportion of deaths from this cause. The three components are also consistent in their effect on raising the importance of circulatory system diseases in developing countries, but in developed countries the components work in opposite directions. Therefore, both demographic and epidemiological change will have roles in modifying mortality by cause in the future.
Age-Sex Specific Patterns
Patterns by age and sex are roughly similar across regions but differ in many details. Between men and women, differences are small, except with regard to complications of pregnancy. Across ages, mortality is lowest at ages 5–14 and ages 15–44; about five times as high at 1–4 and 45–64 years; and about fifty times as high at 0 and 64 years and above. The cause-of-death patterns for each age group are roughly as follows: infectious and parasitic diseases decline in importance with age (though they are more prominent at age 1–4 than at 0, given the predominance of certain perinatal causes among infant deaths); circulatory system diseases and neoplasms increase in importance with age. Injury and poisoning are most prominent at age 15–44, perinatal conditions are of course significant at age 0, and complications of pregnancy are notable at age 15–44. Other causes are essentially stable across age groups.
Over time, cause-specific mortality rate projections show variable changes. For infectious and parasitic diseases and for the category of other causes,
reductions are fairly constant across age groups, except for being somewhat smaller at age 65 and above. In contrast, for circulatory system diseases and for injury and poisoning, reductions over time are strongly linked to age, being much greater at younger ages. For neoplasms, increases over time are actually more frequent than reductions and are expected to occur in all regions, but most notably in sub-Saharan Africa.
To obtain the previously reported estimates for all ages, deaths were simply added up across age groups. Should deaths at different ages be given equal weight when using mortality figures in decision making? Several arguments to the contrary are possible. For instance, fewer deaths at the oldest ages are likely to be “premature” than at younger ages, and from the perspective of prevention, deaths at the oldest ages might therefore deserve less attention. Also, deaths at younger rather than older ages might be seen as depriving individuals of a larger number of potential years of life. To illustrate the effects of alternative weightings, Figures 4–6 compare the percentage distribution of deaths by cause with the percentage distribution of deaths under age 65 and with the percentage distribution across causes of death of potential years of life lost. Years lost are calculated under the simplifying assumptions that life expectancy is 75 and that deaths
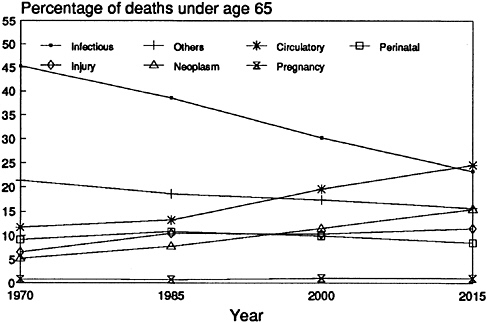
FIGURE 5 Percentage of deaths under 65 due to each major cause, world, 1970–2015.
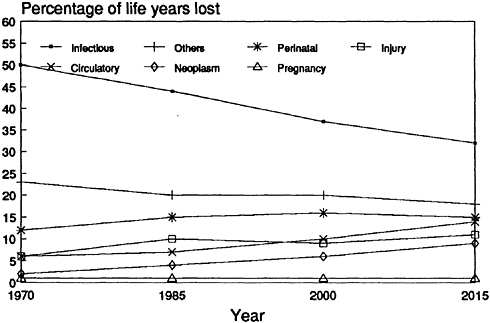
FIGURE 6 Percentage of life years lost due to each major cause, world, 1970–2015.
in each age group from each cause occur at the mean for that age group from all causes in the world as a whole in 1985.
Weighting deaths at younger ages more heavily increases the prominence of infectious and parasitic diseases, perinatal conditions, and injury and poisoning, and reduces the prominence of circulatory system diseases and neoplasms. The effects on the remaining categories are weak or inconsistent. Thus, infectious and parasitic diseases account for a little more than one-third of deaths in developing countries in 1985 but for one-half of all potential years of life lost. In comparison to infectious and parasitic diseases, circulatory system diseases will account for more deaths by 2000, but not for as many deaths under 65 until 2015, and even by 2015 for less than half as many potential years of life lost. Nevertheless, whether weighted or unweighted, the percentages mostly show similar trends over time, especially in decreases for infectious and parasitic diseases and increases for circulatory system diseases.
Reliability of Estimates
Since the expert assessments imply that at least some of the initial estimates are too low, the quality of these estimates and the biases that may
TABLE 7 Regional Population (percent) Covered by Reports to WHO or Sample Surveys, by Year
exist in them are now considered. The source of particular estimates should be borne in mind. For several regions, the current and past estimates are based substantially on data reported to WHO. Table 7 shows the proportions of regional populations covered by reported data. (The former USSR is not counted as covered, but China and rural India are.) The 1970 and 1985 estimates for industrial market economies are drawn almost entirely from WHO reports, which is true to a lesser extent for the estimates for Latin America and the Caribbean and industrial nonmarket economies. The situation for Asian data is more ambiguous because of reliance on special survey data for China and India. For sub-Saharan Africa and for North Africa and the Middle East, on the other hand, practically all the 1970 and 1985 figures are produced from the regression models.
As noted earlier, estimates based entirely on reports to WHO are not free from potential bias. The general issues of reliability and comparability have already been noted, but in addition, some aspects of the coding appear not to conform with expert expectations. For example, substantial deaths from diarrhea at older ages were judged improbable. Nevertheless, on the average, across reporting countries in 1985, 40 percent of all deaths from this cause occurred at age 65 and older, and the proportion exceeded 80 percent in countries such as Norway and Japan, with presumably reliable reports. Misclassification cannot be excluded as an explanation but cannot be confirmed with available data.
Further potential problems exist with the regression-based estimates, where they are used for 1970 and 1985 for countries with no reported data, as well as for 2000 and 2015 for all countries. Both statistical and substan-
tive criteria could be applied in assessing these results. Statistically, the equations for major causes of death produced patterns for 1970 and 1985 consistent with those produced by Hakulinen et al. (1986a,b) for 1980, using the same equations but different life tables and regional groupings. Hakulinen and colleagues argued that their results had many similarities to previous results by Preston (1976), who estimated equations that were not age specific. They also argued that the procedure was insensitive to choice of life tables, which appears to be borne out by the similarities between their results and these.
To assess the regression procedure, the equations were applied to the reporting countries for 1985 to see whether predictions would match reports. This comparison is permissible because the equations for major causes had been estimated separately (by Hakulinen et al.) with other data; the procedure is less informative regarding the equations for specific causes, which were estimated by using the reported data in the comparison. Table 8 shows, however, that the reported distribution by major causes is more closely approximated by predictions than is the distribution by specific causes. For the major causes, indices of dissimilarity between percentage distributions range from 5 to 13 among the four regions in Table 8. For specific causes under infectious diseases, these indices range from 12 to 34; for specific causes under circulatory system diseases, they range from 8 to 24; and for specific causes among the other causes, they range from 1 to 3. Generally, the distributions for nonmarket economies are more poorly predicted than those for other regions.
For specific causes, predicted percentages are higher than reported percentages in some regions, lower in others. For circulatory system diseases, for instance, predictions are too high in Asia and too low in nonmarket economies. One might draw implications from such comparisons about the possible directions of bias in the estimates for nonreporting countries, but only if one assumes similar mortality patterns in nonreporting as in reporting countries.
For the specific causes, the statistical adequacy of the equations varies by cause, as indicated earlier by using coefficients of determination. Those causes of death that have distinctive patterns in Africa and the Middle East, and possibly in Asia, may be poorly estimated for these regions, but this does not mean that diseases especially prevalent in these regions are underestimated: their prevalence might still be properly represented by extension of patterns across developed and Latin American countries. Rather, it means that causes of death that show important discontinuities between reporting and nonreporting countries may be poorly estimated for the nonreporting countries. Unfortunately, without reports for all regions, one cannot tell definitively which causes of death these are.
Even if the equations were entirely accurate for the present, projecting
TABLE 8 Predicted and Reported Percentage Distributions of Deaths by Cause for Reporting Countries Grouped by Region, 1985
|
|
Industrial (24)a |
Nonmarket (8) |
LAC (26) |
Asia (7) |
||||
|
Cause |
Predicted |
Reported |
Predicted |
Reported |
Predicted |
Reported |
Predicted |
Reported |
|
Percent of all causes |
||||||||
|
Infections |
8 |
8 |
20 |
11 |
23 |
20 |
31 |
32 |
|
Neoplasms |
17 |
22 |
12 |
12 |
11 |
11 |
9 |
9 |
|
Circulatory |
51 |
51 |
38 |
50 |
31 |
32 |
25 |
20 |
|
Pregnancy |
0 |
0 |
0 |
0 |
0 |
0 |
1 |
1 |
|
Perinatal |
1 |
1 |
2 |
2 |
7 |
7 |
6 |
8 |
|
Injury |
6 |
6 |
6 |
6 |
7 |
10 |
6 |
11 |
|
Other |
17 |
13 |
22 |
19 |
21 |
22 |
19 |
|
|
Percent of infections |
||||||||
|
Diarrhea |
7 |
1 |
16 |
3 |
22 |
28 |
25 |
9 |
|
Tuberculosis |
4 |
2 |
8 |
5 |
6 |
6 |
5 |
8 |
|
Acute respiratory |
42 |
49 |
43 |
30 |
41 |
31 |
43 |
33 |
|
Measles |
1 |
0 |
2 |
0 |
2 |
1 |
3 |
1 |
|
COPD |
33 |
45 |
19 |
17 |
16 |
12 |
16 |
|
|
Polio |
0 |
0 |
0 |
0 |
0 |
0 |
0 |
|
|
Yellow fever |
0 |
0 |
0 |
0 |
0 |
0 |
0 |
0 |
|
Malaria |
0 |
0 |
1 |
0 |
1 |
0 |
1 |
2 |
|
Schistosomiasis |
0 |
0 |
0 |
0 |
0 |
0 |
0 |
0 |
|
Intestinal parasites |
0 |
0 |
1 |
0 |
1 |
1 |
1 |
1 |
|
Other infections |
12 |
4 |
10 |
44 |
12 |
17 |
9 |
31 |
|
|
Industrial (24)a |
Nonmarket (8) |
LAC (26) |
Asia (7) |
||||
|
Cause |
Predicted |
Reported |
Predicted |
Reported |
Predicted |
Reported |
Predicted |
Reported |
|
Percent of circulatory |
||||||||
|
Ischemic heart |
30 |
38 |
29 |
43 |
29 |
28 |
27 |
17 |
|
Cerebrovascular |
24 |
24 |
24 |
28 |
23 |
19 |
23 |
42 |
|
Other cardiovascular |
34 |
29 |
34 |
22 |
34 |
37 |
34 |
23 |
|
Diabetes |
6 |
3 |
6 |
1 |
6 |
8 |
6 |
3 |
|
Certain degenerative |
7 |
6 |
7 |
5 |
9 |
13 |
9 |
15 |
|
Percent of other causes |
||||||||
|
Mental disorders |
2 |
4 |
1 |
1 |
1 |
1 |
1 |
|
|
Oral health diseases |
0 |
0 |
0 |
0 |
0 |
0 |
0 |
|
|
Micronutrient |
3 |
2 |
3 |
3 |
3 |
3 |
2 |
|
|
Malnutrition |
1 |
1 |
2 |
2 |
2 |
3 |
5 |
|
|
Unspecified |
94 |
93 |
94 |
94 |
94 |
93 |
91 |
|
|
aNumber of countries included in the comparison. bWith no reported data for this category, it was assumed to be equal to the predicted value to permit comparisons for other categories. cNo data. |
||||||||
them into the future would still raise several issues. Future estimates also depend on assumptions about age structure, about current vital rates, and about trends in these variables. Furthermore, other unexpected changes could alter the outlook. Estimates for new causes of death cannot be generated by this procedure. For human immunodeficiency virus (HIV) infection, in particular, this limitation may have significance for the broader picture. Besides changes in diseases, changes in medical technology, in lifestyles, in health and safety measures, and in the delivery of health services, as well as in the nature and quality of cause-of-death reports, could change the picture. All that the projections provide is a hypothetical picture based on somewhat contradictory assumptions: that mortality decline will be extended into the future, extending past trends, but that historical patterns associating particular disease categories with particular mortality levels will remain as they are.
DISCUSSION
These projections suggest quite substantial changes in the causes of mortality from 1970 to 1985, and continuing changes for the following 30 years. The contrast between infectious and parasitic diseases, on the one hand, and circulatory system diseases, on the other, is the sharpest: the first group is in decline as a cause of death, whereas the second will increasingly be ascendant. These two major causes were responsible for about equal numbers of deaths in Latin America and the Caribbean by 1985. They caused equal numbers of deaths in Asia around 1990, and will do so in the Middle East and North Africa by around 2005, and in sub-Saharan Africa sometime after 2015. Other causes of death will increase or decrease in importance, depending not only on the technology available for control and cure, but also on demographic factors. For instance, as populations move through the demographic transition, the importance of infant and childhood diseases will decrease and the importance of neoplasms as a cause of death will increase.
Obtained from regression models that predict the distribution of causes of death from the overall mortality level, these estimates and projections have clear limitations. However, despite the caveats noted above, the broad patterns are consistent with actual reports and appear generally plausible.
What they imply for health systems is not immediately obvious. Over the medium term, shifts in services to focus on causes of increasing importance would seem to be appropriate. Yet many other factors besides numbers of deaths need to be taken into account, and new diseases of major significance may also command attention. That the distribution of causes of death is itself subject to interpretation was demonstrated by contrasting alternative percentage distributions of deaths, deaths under 65, and life years
lost: from different perspectives, priorities can look somewhat different. Careful policy analysis is needed before practical implications can be drawn. One additional implication from any perspective is that better data on cause of death are essential.
REFERENCES
Bulatao, R.A., and E.Bos 1989 Projecting mortality for all countries. Policy, Planning, and Research Working Papers. No. 337. Washington, D.C.: World Bank.
Bulatao, R.A., and P.W.Stephens 1992 Estimates and projections of mortality by cause: A global overview, 1970–2015. Policy Research Working Papers. Washington, D.C.: World Bank.
Bulatao, R.A., E.Bos, P.W.Stephens, and M.T.Vu 1990 World Population Projections, 1989–90 Edition: Short- and Long-Term Estimates. Baltimore, Md.: Johns Hopkins University Press.
Coale, A.J., and P.Demeny, with B.Vaughn 1983 Regional Model Life Tables and Stable Populations, 2nd ed. New York: Academic Press.
Frenk, J., J.L.Bobadilla, J.Sepúlveda, and M.López Cervantes 1989 Health transition in middle-income countries: New challenges for health care. Health Policy and Planning 4(1):29–39.
Hakulinen, T., H.Hansluwka, A.D.Lopez, and T.Nakada 1986a Global and regional mortality patterns by cause of death in 1980. International Journal of Epidemiology 15(2):226–233.
1986b Estimation of global mortality patterns by cause of death. Pp. 179–205 in H. Hansluwka, A.D.Lopez, Y.Porapakham, and P.Prasartkul, eds., New Developments in the Analysis of Mortality and Causes of Death. Bangkok: World Health Organization and Mahidol University.
Omran, A.R. 1971 The epidemiological transition: A theory of the epidemiology of population change. Milbank Memorial Fund Quarterly 49:509–538.
Parkin, D.M., E.Laara, and C.S.Muir. 1988 Estimates of the worldwide frequency of sixteen major cancers in 1980. International Journal of Cancer 41:184–197.
Preston, S.H. 1976 Mortality Patterns in National Populations, with Special Reference to Recorded Causes of Death. New York: Academic Press.
Walsh, J.A. 1988 Establishing Health Priorities in the Developing World. Boston: Adams Publishing Group.
World Health Organization 1977 Manual of the International Statistical Classification of Diseases, Injuries, and Causes of Death, Vols. 1 and 2. Geneva: World Health Organization.


