
7
Landscapes and the Coastal Zone
R. Eugene Turner
Louisiana State University
Baton Rouge, Louisiana
Each shade of blue or green sums up in itself a structure and a history, for each lake is a small world, making its nature known to the larger world of the desert most clearly in its colour. These little worlds of turquoise, set among red, brown, grey and white rocks, are not independent of the dry landscape around them. . .. In the quality of this scene, accentuated by the foetid sulphurous water that lies at the bottom of the lake, may be traced the whole life of the surrounding country (The Clear Mirror, G. E. Hutchinson, 1936).
INTRODUCTION
Scientists and resource managers often look at the coastal zone without referring to the larger landscape in a quantitative way. A conspicuous management practice illustrating the dichotomy between the landscape scale of examination and management action involves permit decisions. The typical Federal Section 404 permit is evaluated and issued one permit at a time, without serious consideration of the cumulative effects of many permit decisions, thus thwarting the apparent intent of several legal instruments of the federal and state resource management (e.g., Bedford and Preston, 1988; Gosselink et al., 1990). The influence of landscapes and landscape-scale changes may originate either in situ or far from the immediate area of concern and often in unappreciated ways. The theory of island biogeography (MacArthur and Wilson, 1967) is one example of a fruitful quantitative analysis of how the size, relationship, and shape of landscape patches affect species distribution. Process-oriented landscape studies are, in contrast, rare. It is my purpose here to illustrate various landscape interactions of coastal ecosystems and thereby encourage integrated analysis and management.
ESTUARINE VARIABILITY IN THE UNITED STATES
The geomorphology of U.S. estuaries varies enormously, and this variability influences estuarine functions. Examples of estuarine variability are found in Figure 7.1. The drainage-basin size, water-surface size, freshwater turnover time, and water-marsh ratio varies by several orders of magnitude from the Maine estuaries around the coast to the state of Washington. Estuarine functions are strongly influenced by this variability, which is, of course, overlain with seasonal, annual, and daily cycles. For example, as estuarine flushing time decreases, the likelihood of water pollution problems increases. Fisheries are limited by wetland area because of requirements for refuge or food (e.g., Turner, 1992; Turner and Boesch, 1987; Figure 7.2). We know from freshwater studies that landscape pattern may influence bird distributions (Figure 7.3; Brown and Dinsmore, 1986). Examples of area-species relationships for coastal communities are less frequently documented than for terrestrial ecosystems, perhaps because of the variability of estuarine flushing. This variability makes data collection and analysis more difficult. However, some of the earliest studies of species colonization and turnover were done on mangrove islands Coy D. Simberloff and colleagues), and the principles should be generally applicable to the coastal zone. For example, habitat diversity does appear to be related to habitat area (Figure 7.4).
One cannot easily clone landscapes as in the usual scientific experiment. However, when accomplished, the results may be dramatically illustrative (e.g. Schindler, 1977; Likens, 1992). Comparisons between landscape units are often fruitful, and modelling has a role. Some the clearest cases of landscape-scale influences come from documenting recent changes and the cause-and-effect conclusions based on strong inferences. Three case studies of landscape changes are briefly discussed below. In one case (Everglades), the influence of variable water-flow patterns are discussed. The second case (Mississippi River) illustrates the probable role of changing riverine nutrient flows and consequences to the continental shelf ecosystem. The third example (coastal Louisiana) discusses the indirect impacts of many small dredge and fill permit decisions—an in situ change—on wetland losses.
CASE HISTORY: SOUTH FLORIDA HYDROLOGIC CHANGES
The ecosystems of south Florida are very sensitive to the fluctuations and duration of soil moisture, flooding, and drying cycles. They are also nutrient-poor systems, especially for phosphorus (e.g., Ornes and Steward, 1973). The natural water balance, in turn, is driven by seasonal and long-term rainfall, evaporation, plant transpiration, below ground seepage, land elevation, soil infiltration, and natural channel flow. Water movement from Lake Okeechobee (approximately +5 m msl) southward for 70 miles toward the Miami area (approximately +2 m msl) is sensitive to the elevation gradients. Water movement eastward was formerly only through the coastal ridges at high water stages. The westward movement is impeded by sandy ridges averaging about +8 m msl on the western border of the Everglades Agricultural Area (south of Lake Okeechobee). High water is a flood problem for the 3 million residents near Miami, and low water is a threat to the water table and freshwater supplies.
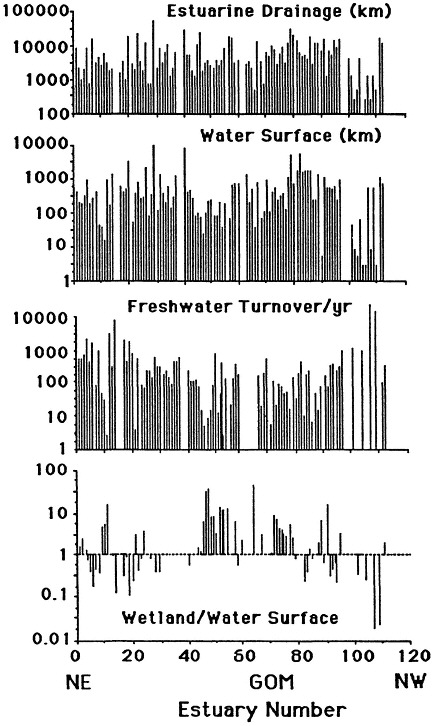
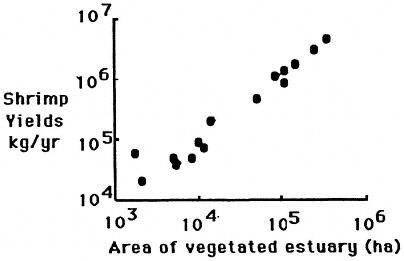
FIGURE 7.2 The relationship between intertidal vegetation and penaeid shrimp yields from the estuaries of the northern Gulf of Mexico. (Source: Turner and Rabalais, 1992).
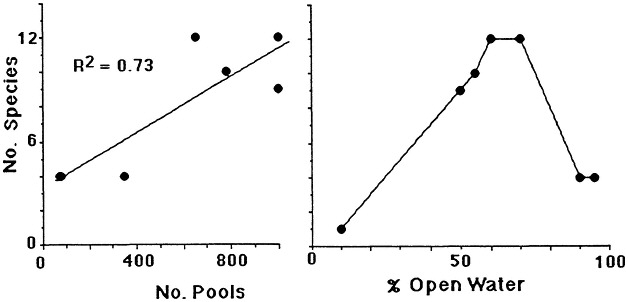
FIGURE 7.3 Species richness of birds in freshwater ponds in relationship to cover-water ratios expressed as (1) the number of pools in the emergent marsh and (2) the percent open water. (Source: Weller and Fredrickson, 1974). Reprinted with persmission from Cornell University, Laboratory of Orninthology, 1974.
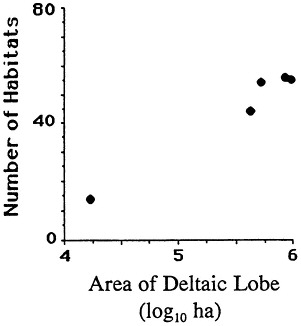
FIGURE 7.4 Habitat number vs. size of the Mississippi River deltaic coastal plain. (Source: Neill and Deegan, 1968) Reprinted with permission from American Midland Naturalist, 1968.
Man has been altering this ecosystem for most of this century. The history of Florida's development (see Table 7.1), particularly south Florida, began with a simple interest to drain the excess water and then to occupy the land for agriculture. It soon became evident that the limitations of excess water were also matched by the problems of water scarcity. What at first was a plan to drain the swamp by the state became a complex water-management scheme involving local, regional, state, and national agencies. A diversity of perspectives, priorities, and monies accompanies this complexity. It is a difficult area to manage because it includes a National Park, which is a conservation zone with site-specific and exclusive land use regulations. Human enterprises are inherently interested in stable water supplies, whereas the Everglades ecosystem is very responsive and requires fluctuating water supplies. These land use changes have led to the loss or destruction of about one-half of the natural Everglades ecosystem through either direct habitat loss or the indirect influences of development. In particular, water movement through and within the naturally defined ecosystem has been modified through land use, land drainage, and both water diversions and storage (e.g., in 1990 there were more than 1400 miles of canals, 65 major spillways, and hundreds of water control structures; Figure 7.5). Compared with the 1900 conditions, plant coverage is vastly reduced or changed (e.g., Steward and Ornes, 1973a, b; Hagenbuck et al., 1974), local weather patterns may have been altered, [and there is increased coastal saltwater intrusion and fire;] animal populations dependent on plants and their predators/decomposers have been put at risk (Tables 7.1 and 7.2).
Some specific effects of the altered hydrology are
TABLE 7.1 Drainage Issues in South Florida (Based mostly on Davis, 1943, Parker, et al., 1955; Anon, 1948; Stephens, 1969; Tebeau, 1971
|
pre 1920s |
unregulated water level in Lake Okeechobee. Lake size larger than present, filled more of its basin, and wider fluctuations in water level than presently. Water did not overflow until > 20.5 msl, and over the southern rim. The Everglades were already wet before the overflow in late summer or early fall. |
|
1940 |
peat fires more frequent, soil oxidation even to bare rock is obvious, concern about relationship of 1935 and 1939 freeze and how air temperature is related to water level. |
|
1950 |
the St. Lucie Canal and Caloosahatchee Canal and River system are artificial outlets diverting water from Lake Okeechobee to the Atlantic and Gulf of Mexico, respectively. Rainwater is major source of water for Everglades. Saltwater intrusion into the freshwater aquifer below msl is evident (e.g., Dade County). |
|
1970s |
coastal ground-water levels significantly reduced from the 1940s (e.g., Klein 1973); Big Cypress waterflow changed from slow, prolonged southward sheetflow overland to accelerated and shortened-period runoff through canal system; water quality problems (e.g., algal blooms) in Lake Okeechobee. The 'rainfall' plan went into effect guaranteeing water to the Everglades on a regulated basis. |
|
1990 |
more than 1,400 miles of canals. Cattails found on 6,000 acres of Loxahatchee Wildlife Refuge (WCA-1) and another 24,000 acres show elevated phosphorous levels; various restoration efforts underway, including the restoration of the Kissimmee River Basin; annual flow distribution in Shark Slough (a principle water entry point into the Everglades National Park) changed from a mixed east/west pattern, to almost exclusively western slough (Johnson and Ogden, 1990). Lake Okeechobee water levels now 12.6 to 15.6 msl, compared to +18 to 20 msl at the turn of the century; flow over the southern rim is vastly restricted (based mostly on Davis, 1943; Parker et al., 1955; Anon, 1948; Stephens, 1969; and Tebeau, 1971). |
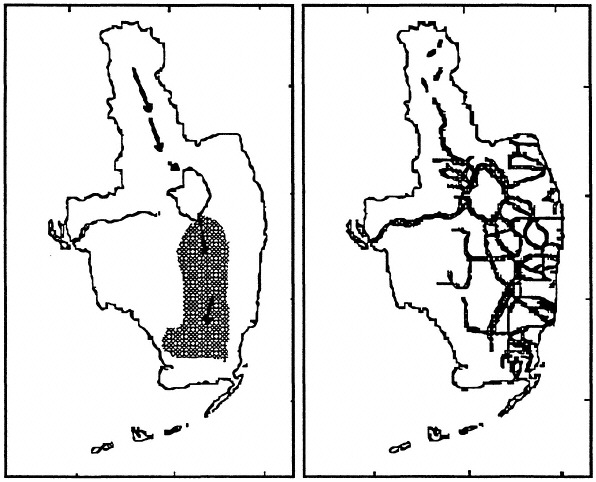
TABLE 7.2 Some consequences of recent hydrologic changes to south Florida coastal communities.
|
Species |
Natural Conditions |
Recent |
Notes |
|
Area: |
100% |
36% urban/agriculture |
|
|
|
|
32% impounded |
|
|
|
|
12% overdrained |
|
|
• Hydrology |
|
|
|
|
• hydroperiod: |
gradual |
shorter |
|
|
• water height: |
seasonal |
higher in impoundments |
|
|
|
|
seasonality reduced |
|
|
• Atlantic |
|
|
|
|
diversions: |
minor |
major |
|
|
Alligator |
|||
|
• population size: |
178,000 |
116,300 (1971-1982) |
M. Fleming, unpublished based on computer model |
|
• percent occurrence of nest flooding: |
7% |
19% |
|
|
Wading birds, nesting in central-south Florida: |
77-93,000 (1931-40) |
9,850 (1980-89) |
Ogden and Johnson, 1992 |
|
Wood stork |
|||
|
• nesting success: |
78% (1953-61) |
21% (1962-1989) |
Ogden and Johnson, 1992 |
|
• colony formation in Nov/Dec: |
87% (1953-69 |
10% (1970-89) |
Ogden and Johnson, 1992 |
-
exotic species are now in the Everglades National Park (e.g., Australian pine [Melaleuca sp.], Brazilian pepper, hydrilla, water hyacinth, cajeput, walking catfish, pike killifish, and several species of cichlides);
-
soil subsidence and water-level declines since 1900 through much of the ecosystem are measured in feet, not inches (Alexander and Crook, 1973);
-
agricultural fertilizers leak to downstream ecosystems;
-
fires are more frequent (e.g., Stephens, 1969);
-
perhaps a dozen species whose recovery is compromised by the altered hydrologic cycles are endangered or threatened by extinction;
-
significant legal issues arise over the allocation of water resources and the quality of that water;
-
the long-term sustainability of drained agricultural lands is in doubt;
-
saltwater intrusion is a threat to urban water supplies; and,
-
changes in animal populations occur for those species dependent on plants and their predators/decomposers.
CASE HISTORY: MISSISSIPPI RIVER WATERSHED NUTRIENT ADDITIONS
The Mississippi River watershed is 41 percent of the area of the contiguous 48 states (Figure 7.6). In terms of length, discharge, and sediment yield, the main river channel is, respectively, the third, eighth, and sixth, largest river in the world (Milliman and Meade, 1983). The river has been shortened by 229 km in an effort to improve navigation, and it has a flood control system of earthwork levees, revetments, weirs, and dredged channels for much of its length that has isolated most riverine wetlands from the main channel and left them drier.
Changes in three indicators of water quality were documented by Turner and Rabalais (1991) and are presented here: phosphorus (as total phosphorus), silicon (as silicate), and dissolved inorganic nitrogen (as nitrate). All three are important nutrients for freshwater and marine phytoplankton growth and production. The pervasive relationships between phosphorus and freshwater phytoplankton communities is well established (e.g., Schindler, 1977, 1988; Vollenweider and Kerekes, 1980). Diatoms, an important food species for freshwater and marine fish and invertebrates, require silicon to build their nests. Schelske et al. (1983, 1986) proposed that increased phosphorus loading in lakes stimulated diatom production with the subsequent loss of silicon (as diatom tests) when deposited in sediments. Eventually a new steady-state silicate concentration develops in the water column where diatoms are less numerous and their growth is silicon limited. Nitrogen often acts in concert with phosphorus to regulate phytoplankton communities in freshwater ecosystems and may often be the dominant nutrient limiting phytoplankton of estuarine and marine communities (e.g., Valiela, 1984; D'Elia et al., 1986; Harris, 1986).
The mean annual concentration of nitrate in the lower Mississippi River was about the same from 1905 to 1906 and from 1933-1934 as in the 1950s but has subsequently doubled (Figure 7.7). The mean annual concentration of silicate was about the same from 1905 to 1906 as in the 1950s and then
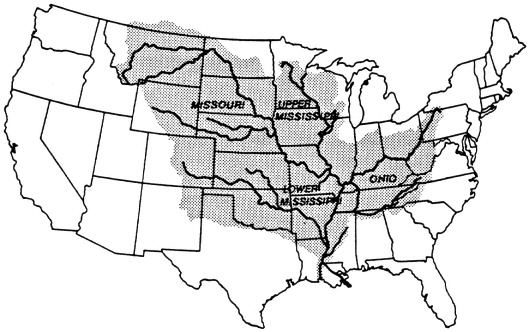
FIGURE 7.6 The drainage basin of the Mississippi River.
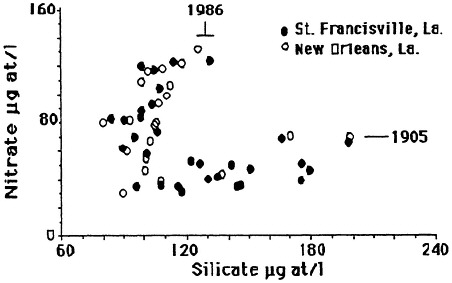
FIGURE 7.7 Average annual nitrate and silicate concentration in the lower Mississippi River. The data are from the U.S. Geological Survey and the New Orleans Water Board. (Source: Turner and Rabalais, 1991). Reprinted with permission from American Institute of Biological Sciences, 1991.
declined by 50 percent. The concentration of silicate increased from 1985 to 1988, whereas the concentration of nitrate decreased slightly in the same period. Although the concentration of total phosphorus appears to have increased since 1972 (the earliest records that could be found), the variations between years are large, and the trends, if they exist, are not clear.
The silicate/nitrate atomic ratios in the lower Mississippi River for this century have changed as the concentrations varied. The silicate/nitrate atomic ratio was about 1:4 at the beginning of this century, 1:3 in 1950, and then rose to about 1:4.5 over the next 10 years before plummeting to around 1:1 in the 1980s.
The seasonal patterns in nitrate and silicate concentration also changed. There was no pronounced peak in nitrate concentration earlier this century, whereas there was a spring peak from 1975 to 1985 (Figure 7.8). A seasonal peak in silicate concentration, in contrast, is no longer evident. There was no marked seasonal variation in total phosphorus from 1975 to 1985.
The likely causal agent of these changes is the widescale and intensive use of nitrogen and phosphorus fertilizers, which reached a plateau in the 1980s. The current consumption of phosphorus fertilizer use in the United States is stable but is increasing throughout the world (Figure 7.9). There is a direct relationship between annual nitrogen fertilizer use and nitrate concentration in the river (Figure 7.10). An indirect relationship between phosphorus fertilizer use and silica concentration in the river is also observed, as predicted by the hypotheses of Schelske et al. (1983, 1986).
The combination of changes in nitrate, phosphorus and silicate has almost certainly influenced the coastal marine phytoplankton community (in particular, leading to a decline in diatom abundance), and has perhaps led to increased phytoplankton production. This is especially likely if a community is nitrogen limited, as many coastal systems are thought to be. It is not clear, however, if larger or more severe hypoxic zones have formed in bottom waters offshore (Rabalais et al., 1991) as a result of these riverine water-quality changes.
These changes are important to understand, if only because nitrogen is commonly thought to be limiting phytoplankton growth in coastal and oceanic waters (e.g., Harris, 1986; Valiela, 1984). The abundance of coastal diatoms is influenced by the silicon supplies, whose silicon/nitrogen atomic ratio is about 1:1. Diatoms out-compete other algae in a stable and illuminated water column of favorable silicate concentration. When nitrogen increases and silicate decreases, flagellates may increase in abundance (Officer and Ryther, 1980) and form undesirable algal blooms. In particular, noxious blooms of flagellates are becoming increasingly common in coastal systems. Zooplankton, important diatom consumers and a staple of juvenile fish, are thus affected by these nutrient changes in a cascading series of interactions. Furthermore, where eutrophication occurs, hypoxia often follows, presumably as a consequence of increased organic loading. Supportive evidence of this benthicpelagic coupling is found in the observations of Cederwall and Elmgren (1980), who demonstrated a rise in macrobenthos around the Baltic islands of Gotland and Oland, which they attributed to eutrophication, a known event (Nehring, 1984).
However, not all coastal systems are nitrogen limited (e.g., the Huanghe in China is phosphorus limited; Turner et al., 1990), nor is changing nutrient loading the only factor influencing phytoplankton growth (Skreslet, 1986). Marine phytoplankton may also respond in various ways to nutrient additions introduced gradually or suddenly, with changing flushing rates or salinity, and with
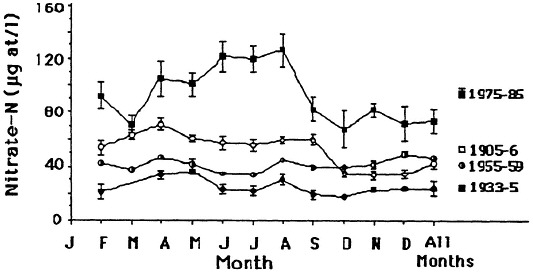
FIGURE 7.8 Seasonal nitrate concentrations in the lower Mississippi River. A +/- 1 standard error of the mean is shown. Source: Turner and Rabalais, 1991). Reprinted with permission from American Institute of Biological Sciences, 1991.
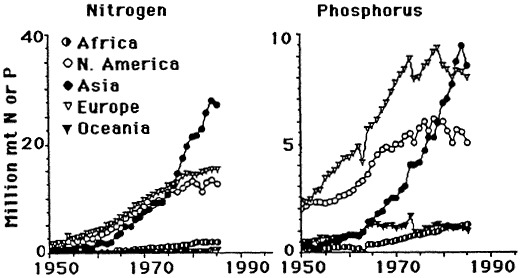
FIGURE 7.9 World nitrogen and phosphorus fertilizer consumption since 1950. (Source: Turner and Rabalais, 1991). Reprinted with permission from American Institute of Biological Sciences, 1991.
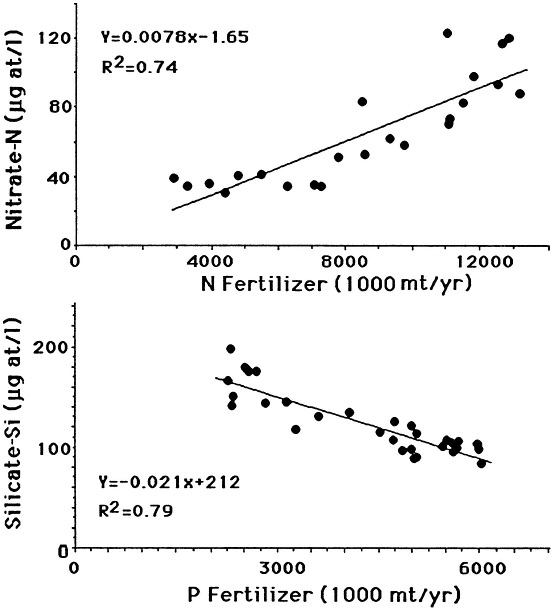
FIGURE 7.10 The relationship between fertilizer use and water quality at St. Francisville, Louisiana. Top: Nitrogen (as N) fertilizer use in the United States and average annual nitrate concentration from 1960 to 1985. Bottom: phosphorus (as P2O5) fertilizer use in the United States and average silicate concentration at St. Francisville, Louisiana from 1950 to 1987. (Source: Turner and Rabalais, 1991). Reprinted with permission from American Institute of Biological Sciences, 1991.
cell density (Sakshaug et al., 1983; Sommer, 1985; Suttle and Harrison, 1986; Turpin and Harrison, 1980).
Management of eutrophication on a national scale has not sufficiently integrated freshwater and estuarine systems. The national freshwater policy is to control phosphorus, and it is based on the numerous excellent laboratory and field studies of the stimulatory effect of phosphorus on freshwater ecosystems. However, the analysis and management of nitrogen limited coastal systems is becoming more complicated as the eutrophication modifies the transition zone between phosphorus and nitrogen-limited aquatic ecosystems. A national policy common to both freshwater and coastal systems is sewerage treatment. But, as is shown for the Mississippi River (Turner and Rabalais, 1991), the terrestrial system is very leaky, and treatment does not mean a reduction of loading to the estuary via water and precipitation. A second understated issue, therefore, is that sewerage treatment upstream does necessarily equate to controlling nutrient loading to downstream estuaries.
A third point is that mitigation of nutrient applications seems a less prudent management policy, compared with an outright reduction in use. The ecosystem is simply too leaky to control all nutrient flows between the application site and estuary.
CASE HISTORY: LOUISIANA COASTAL WETLAND DREDGE AND FILL
Dredging is a conspicuous human activity affecting Louisiana's coastal wetlands. It is principally related to oil and gas recovery efforts and results in large areas of canals and residual spoil deposits, or spoil banks (80,426 ha, equivalent to 6.8 percent of the wetland area in 1978; Turner, 1990; Baumann and Turner, 1990; Figure 7.11). The aggregate length of these spoil banks in Louisiana is in the neighborhood of 12,000 miles. To remove all of them would cost about as much as to build three river diversions, that is, about $500 million.
There are strong and probably partially reversible cause-and-effect relationships between wetland losses and these hydrologic changes. Canals and spoil banks are the most likely cause of at least 30-59 percent of Louisiana's coastal wetland losses from 1955 to 1978 (51,582 ha/yr, or 0.85 percent/yr; Turner and Cahoon, 1987). Wetland losses may be due to either direct or indirect impacts of spoil banks and canals. Sixteen percent of these wetland losses resulted from the impacts of dredging wetlands into open water and spoil bank; at least 14-43 percent of these wetland losses were the result of the indirect impacts of spoil banks and canals on tidal water movement into and out of the wetlands (Swenson and Turner, 1987). About 13 percent of the direct wetland losses were due to agricultural and urban expansion into wetlands. Indirect impacts result from the longer wetland drying cycles, even in semi-impounded wetlands, as a consequence of altered water movements into and out of the wetland. The lengthened drying periods promote soil oxidation and subsequent soil shrinkage (Table 7.3). Flooding events may also lengthen behind spoil banks, presumably as a consequence of water being trapped behind the spoil bank once water enters overland during very high tides. The impacts also result from lower sedimentation rates behind spoil banks in any wetland type, probably because of the reduced frequency and depth of tidal inundation (Figure 7.12), and increased waterlogging of soils that changes soil chemistry. Plants may become stressed to the point where
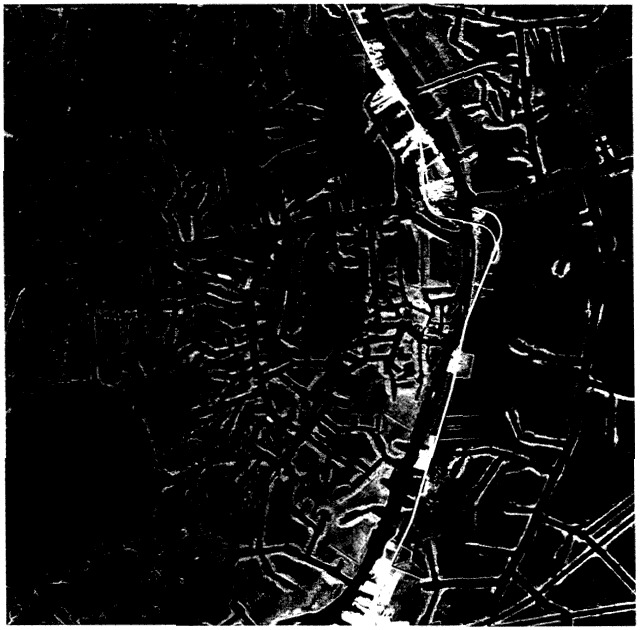
TABLE 7.3 Changes in hydrologic regime of a semi-impounded saltmarsh
|
|
Control |
Semi-Impounded |
|
Flooding |
||
|
number events per month |
12.9 |
4.5 |
|
event length (hours) |
29.7 |
149.9 |
|
Drying |
||
|
number events per month |
11.6 |
4.00 |
|
event length (hours) |
31.2 |
53.9 |
|
Mean Water Level (cm; annual average) |
1.71 |
3.99 |
|
Volume Exchange (wetland surface) |
||
|
above ground |
0.15 |
0.06 |
|
below ground |
0.09 |
0.04 |
|
Source: Swenson and Turner, 1987 |
||
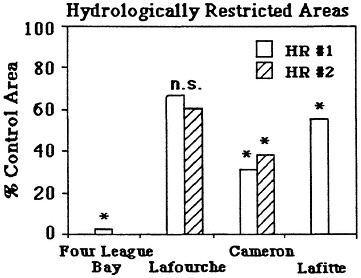
FIGURE 7.12 Vertical accretion rates in two hydrologically restricted areas (HR #1 and HR #2) compared with control sites nearby. Data were normalized to the control site values (100%). An ''*'' by the bar indicates a statistically significant difference between the hydrologically restricted site and the control site. (Source: Cahoon and Turner, 1989)
growth reduction or even die-back occurs (e.g., Babcock, 1967; King et al., 1982; Wiegert et al., 1983; Mendelssohn and McKee, 1987). In addition, the spoil banks consolidate the underlying soils. Water movements below ground are thus decreased, both because of the reduced cross-sectional area and the reduced permeability of material beneath the levee.
The combined effects of sediment deprivation, increased wetland drying, and lengthened soil flooding result in a hostile soil environment for plants. The death of plants reduces sediment trapping amongst the plant stems and accumulation of plant material at the soil surface and below ground. Small, shallow ponds may form and enlarge due to scouring under even light winds. The practical consequence of these causal mechanisms is a strong, direct relationship between wetland losses and canal density on a local and coastwide basis (e.g., Turner and Rao, 1990; Figure 7.13).
SUMMARY
Landscapes are a functioning legacy of many broad influences, including geology, climate, biological evolution, etc. Landscapes are more than reactive parts that can be understood and managed in isolation from each other. Many relationships such as edge configuration, habitat area, fragmentation, and human use are reflected in the ecological functions of the parts and of the whole.
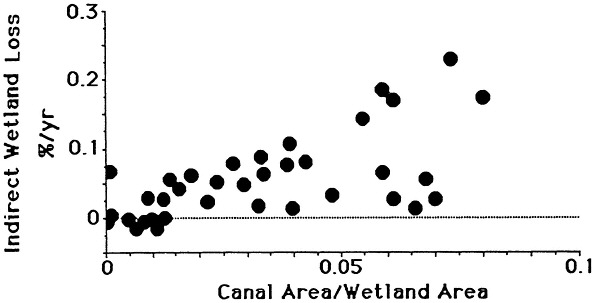
FIGURE 7.13 The relationship between canal density and indirect wetland loss rates (wetland change excluding the area lost to canals and development). Area calculations are for changes within 7 1/2 ft. quadrangle maps from 1955 to 1978 for the St. Bernard, Barataria Bay, and Terrebonne Bay estuaries. Only areas with more than 25 percent wetland in the quadrangle maps are included. Total area included equals 413,000 ha.
We must learn to live with the fact that humans are changing landscapes in a multitude of ways. The details may appear as a painting by Cezanne viewed with a magnifying glass—the colorful tones and textures of oil or pastels. But the painting quality, the forms, and the impressions are intended to be considered from further away. Both the natural and managed coastal-zone parts must be viewed in this context. Individual permits and individual species are like the small brushstrokes. They are required for the whole picture, but the picture quality does not emerge completely unless there is a broad and fully encompassing view. Coastal zones must be viewed not only from close up but from a distance. Most management excludes that landscape view. The consequences of many small decisions tend to be overwhelming, consistent with the acceptance of the fallacy of multiple uses. Landscape fragmentation and loss of functions will result in the absence of a broad view. This is the history of landscapes (e.g., Hoskins, 1970). However, as with a Cezanne painting, the brushstrokes can be changed and managed, one by one, to result in a more masterly painting. This will be most likely accomplished with less arrogance about our abilities to substitute intense manipulation for the multitude of natural interactions.
REFERENCES
Alexander, T. R., and A. G. Crook. 1973. Recent and Long-Term Vegetation Changes and Patterns in South Florida. U.S. National Park Service PB-231 939.
Anon. 1948. Soils, geology, and water control in the Everglades Region. Florida Agricultural Experiment Stations Bulletin.
Babcock, K. M. 1967. The Influence of Water Depth and Salinity on Wiregrass and Salt-marsh Grass. Unpubl. Ph.D. Diss. School Forestry and Wildlife Management, Baton Rouge, Louisiana: Louisiana State University.
Baumann, R. H., and R. E. Turner. 1990. Direct impacts of outer continental shelf activities on wetland loss in the central Gulf of Mexico. Environmental Geology and Water Resources 15:189-198.
Bedford, B. L. and E. M. Preston, eds. 1988. Cumulative effects on landscape systems of wetlands. Environmental Management 12(5).
Brown and Dinsmore. 1986. Implications of marsh size and isolation for marsh bird management Journal of Wildlife Management 50:392-397.
Cahoon, D. R., and R. E. Turner. 1989. Accretion and canal impacts in a rapidly subsiding wetland. 11. Feldspar marker horizon technique. Estuaries 12:260-268.
Cederwall, H., and R. Elmgren. 1980. Biomass increases of benthic macrofauna demonstrates eutrophication of the Baltic Sea. Ophelia, Supplement 1:287-304.
Davis, J. H., Jr. 1943. The Natural Features of Southern Florida; Especially the Vegetation, and the Everglades. Florida Geological Survey Geological Bulletin 25. Tallahassee.
D'Elia, C. J., J. G. Sanders, and W. R. Boyton. 1986. Nutrient enrichment studies in a coastal plain estuary: Phytoplankton growth in large-scale, continuous cultures. Canada Journal Fisheries Aquatic Science 43:397-406.
Gosselink, J. G., G. P. Shaffer, L. C. Lee, D. M. Burdick, D. L. Childers, N. C. Leibowitz, S.C. Hamilton, R. Boumans, D. Cushman, S. Fields, M. Koch, and J. M. Visser. 1990. Landscape conservation in a forested wetland watershed. Bioscience 40:588-600.
Hagenbuck, W. W., R. Thompson, and D. P. Rodgers. 1974. A Preliminary Investigation of the Effects of Water Levels on Vegetative Communities of Loxahatchee National Wildlife Refuge, Florida. U.S. Bureau Sport Fisheries and Wildlife. PB-231 61 1.
Harris, G. P. 1986. Phytoplankton Ecology: Structure, Function and Fluctuations. New York, New York: Chapman and Hall.
Hoskins, W. G. 1970. The Making of the English Landscape. London: Pelican Books.
Johnson, R. A. and J. C. Ogden. 1990. An Assessment of Hydrological Improvements and Wildlife Benefits from Proposed Alternatives for the U.S. Army Corps of Engineers' General Design Memorandum for Modified Water Deliveries to Everglades National Park . U.S. Park Service, unnumbered document.
King, G. M., M. J. Klug, R. G. Wiegert, and A. G. Chalmers. 1982. Relation of soil water movement and sulfide concentration to Spartina alterniflora production in a Georgia salt marsh. Science 218:61-63.
Klein, H., J. T. Armbruster, B. F. McPerson, and H. J. Freiberger. 1973. Water and the South Florida Environment. U.S. Geological Survey PB-236 951.
Likens, G. E. 1992. The Ecosystem Approach: Its Use and Abuse. Vol. 3, Excellence in Ecology. Oldendor/Luhe, Germany. Ecology Institute.
MacArthur, R. H., and E. 0. Wilson. 1967. The Theory of Island Biogeography. Princeton, New Jersey: Princeton University Press.
Mendelssohn, A., and K. L. McKee. 1987. Spartina alterniflora die-back in Louisiana: timecourse investigations of soil waterlogging effects. Journal of Ecology 76:509-521.
Milliman, J. D., and R. Meade. 1983. World-wide delivery of river sediment to the ocean. Journal of Geology 91:1-21.
Nehring, D. 1984. The further development of the nutrient situation in the Baltic proper. Ophelia, Supplement 3:167-179.
Neill, C., and L. A. Deegan. 1986. The effect of Mississippi River delta lobe development on the habitat composition and diversity of Louisiana coastal wetlands. American Midland Naturalist 116:296-303.
Officer, C. B., and J. H. Ryther. 1980. The possible importance of silicon in marine eutrophication. Marine Ecology Progress Series 3:83-91.
Ogden, J. C. and R. A. Johnson. 1992. Ecosystem restoration in Everglades National Park: A Prerequisite for Wildlife Recovery. Unpublished Document.
Ornes, W. H., and K. K. Steward. 1973. Effect of Phosphorus and Potassium on Phytoplankton Populations in Field Enclosures. U.S. National Park Service PB-231 650.
Parker, G. C., G. E. Ferguson, S. K. Love, and others. 1955. Water Resources of Southeastern Florida. U.S. Geological Survey Water-Supply Paper 1255.
Rabalais, N. N., R. E. Turner, W. J. Wiseman, Jr., and D. F. Boesch. 1991. A brief summary of hypoxia on the nonhem Gulf of Mexico continental shelf: 1985-1988. Journal Geological Society of London Sp. Publ. 58:35-47.
Sakshaug, E., K. Andresen, S. Mkklestad, and Y. Olsen. 1983. Nutrient status of phytoplankton communities in Norwegian waters (marine, brackish, and fresh) as revealed by their chemical composition. J. Plankton Res. 5:175-196.
Schelske, C. L., E. F. Stoermer, D. J. Conley, J. A. Robbins, and R. M. Glover. 1983. Early eutrophication in the lower Great Lakes: New evidence from biogenic silica in sediments. Science 222:320-322.
Schelske, C. L., D. J. Conley, E. F. Stoermer, T. L. Newberry, and C. D. Campbell. 1986. Biogenic silica and phosphorus accumulation in sediments as indices of eutrophication in the Laurentian Great Lakes. Hydrobiologia 143:79-86.
Schindler, D. W. 1977. Evolution of phosphorus limitation in lakes. Science 195:260-262.
Schindler, D. W. 1988. Detecting ecosystem response to anthropogenic stress. Canadian Journal of Fisheries and Aquatic Science 44 (suppl.):435-443.
Skreslet, S., ed. 1986. The Role of Freshwater Outflow in Coastal Marine Ecosystems. New York, New York: Springer-Verlag.
Sommer, U. 1985. Comparison between steady state and non-steady state competition: Experiments with natural phytoplankton. Limnology Oceanography 30:335-346.
Stephens, J. C. 1969. Peat and muck drainage problems. American Society Civil Engineers Proc. J. Iff. Drainage Div. 95:285-305.
Steward, K. K., and W. H. Ornes. 1973a. Assessing the Capability of the Everglades Marsh Environment for Renovating Wastewater. U.S. National Park Service PB 231 652.
Steward, K. K., and W. H. Omes. 1973b. Investigations into the Mineral Nutrition of Sawgrass Using Experimental Culture Techniques. U.S. National Park Service PB 231 609.
Suttle, C. A., and P. J. Harrison. 1986. Phosphate uptake rates of phytoplankton assemblages grown at different dilution rates in semicontinuous culture. Canada Journal Fisheries Aquatic Science 43:1474-1481.
Swenson, E. M., and R. E. Turner. 1987. Spoil banks: Effects on a coastal marsh water level regime. Estuarine and Continental Shelf Science 24:599-609.
Tebeau, C. W. 1971. A History of Florida. Coral Gables, Florida: University Miami Press.
Turner, R. E. 1990. Landscape development and coastal wetland losses in the northern Gulf of Mexico . American Zoologist 30:89-105.
Turner, R. E. 1992. Coastal Wetlands and Penacid Shrimp Habitat. Pp. 97-104, in R. H. Stroud, ed. Conservation of Coastal Fish Habitat.
Turner, R. E., and D. F. Boesch. 1987. Aquatic Animal Production and Wetland Relationships: Insights Gleaned Following Wetland Loss or Gain. Pp 25-39 in D. Hooks ed., Ecology and Management of Wetlands. Beckenham, Kent, UK: Croon Helms, LTD.
Turner, R. E., and D. R. Cahoon ed. 1987. Causes of Wetland Loss in the Coastal Central-Gulf of Mexico. Final report submitted to Minerals Management Service, New Orleans, Louisiana. Contract No. 14-12-001-30252. 0CS Study/MMS 87-0119.
Turner, R. E., N. N. Rabalais, and Z.-N. Zhang. 1990. Phytoplankton biomass, production and growth limitations on the Huanghe (Yellow River) continental shelf. Continental Shelf Research 10:545-571.
Turner, R. E., and Y. S. Rao. 1990. Relationships between wetland fragmentation and recent hydrologic changes in a deltaic coast. Estuaries 13:272-281.
Turner, R. E., and N. N. Rabalais. 1991. Water quality changes in the Mississippi River this century and implications for coastal food webs. Bioscience 41:140-147.
Turner, R. E., and N. N. Rabalais. 1992. Geomorphic variability of United States estuaries. Unpublished manuscript.
Turpin, D. H., and P. J. Harrison. 1980. Cell size manipulation in natural marine, planktonic, diatom communities. Can. J. Fish. Aquat. Sci. 37:1193-1195.
Valiela, I. 1984. Maline Ecological Processes. New York, New York: Springer-Verlag.
Vollenweider, R. A., and J. Kerekes. 1980. The loading concept as a basis for controlling eutrophication: Philosophy and preliminary results of the OECD programme on eutrophication. Progress in Water Technology 12:5-38.
Weller, M. W., and L. H. Fredrickson. 1974. Avian ecology of a managed glacial marsh. Living Bird 12:269-291.


