
4
Fracture Detection Methods
This chapter addresses methods for the remote detection and characterization of fractures in the subsurface. These indirect detection methods are mainly geophysical in nature and rely on the physical principles introduced in Chapter 3. Recent advances in theory and in available technology have greatly increased our ability to detect fractures at depth and to characterize their properties. Many of these techniques were first introduced for other purposes and have been refined for use in fracture detection and characterization.
Fractures in the subsurface are zones of anomalous physical properties that can be detected remotely by various means, ranging from simple extrapolation of surface observations to sophisticated seismic and electromagnetic soundings. In general, methods that probe deeply into the subsurface have a poor ability to spatially resolve the locations of fractures and those with shorter ranges have correspondingly better resolutions. Some exceptions to this rule exist in certain circumstances and are noted below; however, the rule is sufficiently strong that the discussion here is organized according to the range and resolving power of the methods. Geophysical fracture detection methods naturally divide themselves into three distinct scales: (1) large scales associated with surface soundings, (2) intermediate scales associated with surface-to-borehole and borehole-to-borehole soundings, and (3) small scales associated with measurements made on rocks immediately adjacent to a borehole or tunnel. Table 4.1 provides a general overview organized by the type of method, which thus serves as a cross-reference for the discussion below.
Fracture detection methods rely on the fact that fractures are thin compared to their lengths and heights; that is, they are essentially two-dimensional anoma-
TABLE 4.1 Fracture Detection Methods
|
Method |
Length Scale of Investigation and Resolution |
Remarks |
Chapter Reference in this Volume |
|
Differential methods |
0.1-5,000 m |
Most of the methods below best detect actual flow if performed both before and after a known stimulus. |
|
|
Elastic methods: seismic band (10-100 Hz) |
100-5,000 m |
Zero shear modulus in fracture fluid is critical. |
|
|
P-wave reflection (2D) |
[1-2 |
Surface methods best detect horizontal fractures; fracture shape is critical. |
|
|
P-wave reflection (3D) |
[1-2 |
Very subtle features recognizable in patterns. |
|
|
S-wave reflection (2D) |
[1-2 |
Surface methods best detect vertical aligned fractures. |
|
|
P-wave vertical seismic orofiling (VSP) (including offset, reverse) |
[<1 |
Minimizes overburden difficulties; fractures cause tube waves. |
|
|
S-wave 3C vertical seismic profiling (VSP) |
[<1 |
Minimizes overburden difficulties. |
|
|
P-wave tomography |
10-100 m; [1/2 |
Zero shear modulus in fracture fluid is critical. |
|
|
Cross-hole reflections |
10-100 m; [1/2 |
Zero shear modulus in fracture fluid is critical. |
|
|
Coupled methods |
100-5,000 m; [<1 |
Iteration of reflection and transmission inversion steps. |
|
Method |
Length Scale of Investigation and Resolution |
Remarks |
Chapter Reference in this Volume |
|
Elastic methods: sonic band (2-20 kHz) |
0.1–10 m |
Zero shear modulus in fracture fluid is critical. |
|
|
P-wave transmission (acoustic Log, 1D) |
[1–2 |
Best detects fractures oriented transverse to rays. |
|
|
Acoustic waveform Log, P and S |
[1–2 |
Best detects fractures oriented transverse to rays. |
|
|
Acoustic emissions |
10–100 m; [1–10 m] |
Emissions accompany fracture growth (e.g., during hydrofrac pumping operations). |
|
|
Elastic methods: ultrasonic band (200-2,000 kHz) |
0.1–5 m |
Fracture aperture is critical. |
|
|
Borehole televiewer |
10–30 cm; [0.3–5 cm] |
Detects fractures in boreholes. |
|
|
Electrical methods |
10–300 m |
Contrasting resistivity of fracture-filling fluid is critical. |
|
|
Electric sounding |
[1–10 m] |
Best detects horizontal fractured zones. |
|
|
Electric profiling |
[1–10 m] |
Best detects vertical or dipping fractured zones. |
|
|
Electric resistivity tomography |
[1–10 m] |
Still under development. |
|
|
Formation microscanner (FMS) |
[0.1–3 cm] |
Best detects open fractures. |
|
|
Electromagnetic methods |
[10–300 m] |
Contrasting resistivity of fracture-filling fluid is critical. |
|
|
Electromagnetic sounding |
[3–10 m] |
Best detects horizontal fractured zones. |
|
|
Electromagnetic profiling |
[3–10 m] |
Best detects vertical or dipping fractured zones. |
|
|
Electromagnetic tomography |
[3–10 m] |
Best detects conductive anomalies, like fluid-filled fractures. |
|
|
Radar methods |
3–100 m |
Contrasting resistivity of fracture-filling fluid is critical. |
|
|
Ground-penetrating radar (reflection) |
[0.1–5 m] |
Conductive overburden presents difficulties, limits penetration. |
|
Method |
Length Scale of Investigation and Resolution |
Remarks |
Chapter Reference in this Volume |
|
Borehole radar (reflection) |
[1–5 m] |
Determines both location and orientation from a single borehole. |
|
|
Radar tomography (transmission) |
[2–10 m] |
May be used to image velocity, attenuation, or differences over time. |
|
|
Conventional well logs |
0.1-10 m |
Near-borehole environment. |
|
|
Neutron log |
[0.1 m] |
Detects clay and porosity in fracture washouts. |
|
|
Resistivity log |
[0.1 m] |
Detects clay in fractures and washouts. |
|
|
Density log |
[0.1 m] |
Detects clay in fractures and washouts. |
|
|
Gamma ray log |
[0.1 m] |
Detects radioactive fillers, rock-type identification. |
|
|
Caliber log |
[0.01 m] |
Detects borehole enlargement. |
|
|
Temperature log |
[0.01 m] |
Detects temperature changes owing to flow in fracture system. |
|
|
Fluid conductivity log |
[0.01 m] |
Detects salinity changes owing to flow in fracture system. |
|
|
Fluid replacement log |
1–100 m; [1–10 m] |
Detects salinity changes owing to flow in fracture system. |
|
|
Geological observation |
0.1–500 km |
Surface lineations, structures, etc., may indicate fractures at depth. |
|
|
Satellite airborne imaging |
1–500 km; [1–100 m] |
Direct observation of lineaments and inference of fractures from geological structures. |
|
|
Core inspection |
[0.1–10 cm] |
Core may not be representative. |
|
|
Optical imaging |
[0.1–10 cm] |
Borehole fluid must be clear. |
lies. In addition, because they are commonly organized into one or more sets, each of which has a preferred spatial orientation, fractures commonly impose some anisotropy in physical properties on the rock mass. This anisotropy may be an important characteristic for fracture detection, especially when the anisotropy is simple and not aligned with other fabric (such as bedding planes) in the rock mass. In mildly deformed bedded rocks, fractures are commonly oriented nearly vertical, with a single preferred azimuth, or two orthogonal azimuths. Several of the detection techniques rely on this characteristic. However, in tectonically active areas, there may be several sets of fractures or fracture zones with a variety of orientations.
The methods listed in Table 4.1 detect fractures indirectly. Typically, the reduced data from each detection method (e.g., seismic travel times) must be inverted to yield estimates of local rock properties (e.g., seismic velocities). Normally, these rock properties are not fracture properties (e.g., fracture density). Instead, the fracture properties must be indirectly deduced from the rock properties. This deduction requires the help of rock property theory (see Chapter 3), which may unavoidably rely on strong idealizations of fracture geometry. These fracture properties are not always the properties (e.g., fracture permeability) of direct interest in many applications. Instead, they must be interpreted from the deduced fracture properties. This interpretation requires higher levels of subjectivity than the first (inversion) or the second (deduction) steps.
SURFACE METHODS
Seismic Reflection
Elastic properties can be determined at greater ranges than electric or electromagnetic properties; hence, seismology is the technique most widely used to explore the deep subsurface. Seismological investigations use P waves, in which the rock deforms (compresses and dilates) along the direction of wave travel (as with ordinary sound in air), or S waves, in which the rock deforms (shears) transverse (or perpendicular) to the direction of wave travel. S waves may be further classified according to polarization (i.e., the orientation of the transverse deformation); this distinction is ignored in most seismological studies but turns out to be crucial for fracture detection. Some of the energy of P waves is converted to S waves at reflecting horizons, and these S waves also return to the surface, where they can be detected and analyzed.
In reflection seismology a controlled seismic source (or a closely spaced array of sources) imparts energy into the ground. The energy travels through the rock, reflects off features (e.g., lithologic boundaries and fractures) where the rock properties change abruptly, and returns to the surface, where it is received and recorded at many points. The receivers, which are a closely spaced array of sensors, record the vertical component of the seismic motion, one or two horizon-
tal components, or all three components. Shear waves are not transmitted by fluids, so in a conventional marine survey the receivers record only the pressure pulse (P wave). Each recording consists of a digital record, several seconds long, of arriving energy from all paths. After each shot, the source and receivers are moved to new locations, and the procedure is repeated.
Extensive data processing is required to extract useful information from this voluminous data set. An elementary step in this data processing gathers together the records corresponding to reflections under the common midpoints of various source-receiver pairs. The records are digitally stretched in time so that obliquely traveling waves arrive at the same adjusted time as vertically traveling waves; then the records are averaged together. This is called stacking.
In conventional two-dimensional (2-D) surveys the sources and receivers are distributed and moved together along a straight line on the surface, and the processed data are displayed in a format similar to a 2-D vertical section of the subsurface below that line. More common in recent times is the 3-D survey, where both sources and receivers are distributed in a 2-D pattern on the surface. As these patterns are moved in a swath across the surface, the investigated region is a 3-D volume of rock, and the processed data are presented to the interpreter in vertical, horizontal, or oblique slices through this volume.
These same principles apply even if the survey is not conducted at the earth's surface but from a tunnel or borehole.
P Waves
P-wave reflection seismology at near-vertical incidence is the primary means by which most of the world's oil and gas reservoirs have been found. However, this technique is not very sensitive to the presence of vertical fractures, as evidenced by the lack of consistent success at finding the ''sweet spots" (i.e., the zones of fracture concentration) in fractured reservoirs. This is due to the insensitivity of near-vertically traveling P waves to the presence of vertical fractures (Hudson, 1980; Thomsen, 1995; see Chapter 3).
In modern surveys, seismic data are not necessarily restricted to near-vertical raypaths. Typically, the maximum source-receiver offset can be adjusted so that the reflections at the target depth span an angular aperture of 25° or more. Obliquely traveling P waves are affected by vertical fractures, both in velocity and attenuation, if their rays do not lie in the plane of the cracks (see Chapter 3). Hence, when data from a set of such oblique paths are processed into a conventional seismic reflection section, the zones of intense fracturing may appear as velocity or amplitude anomalies, most commonly as "dim spots." Kuich (1989) discusses how such techniques have been used to locate fractured oil reservoirs in the Austin Chalk fields in central Texas.
Garotta (1989) discusses the limitations of this technique, noting that dim spots may occur for a number of other reasons, not involving fractures at all. To
test whether a particular dim spot is due to fractures, it is useful to look for the characteristic azimuthal anisotropy of fractures by collecting data along another survey line that crosses the dim spot at some angle (usually 90°) to the first survey line. Fractures are indicated by an azimuthal variation in the dimness of the stacked reflection at the intersection point or in the amplitude variation with source-receiver offset. This procedure is expensive and must be repeated separately for each spot to be investigated. An additional complication is that the set of oblique raypaths from the crossing survey line averages a different volume of rock than for the first survey line. When comparing the two data sets, the possibility of confusing lateral heterogeneity with anisotropy arises. However, in offshore areas this technique may be the only one available because the S-wave techniques discussed below are not applicable, for S waves are not transmitted by fluids.
In situations where near-horizontal fracture zones are present, vertically traveling P waves can be used to indicate their size and orientation, although individual fractures cannot be resolved (Green and Mair, 1983). An example is shown in Figure 4.1, where reflections obtained from a subhorizontal fracture zone or fault are compared to acoustic televiewer (BHTV; see "Borehole Imaging
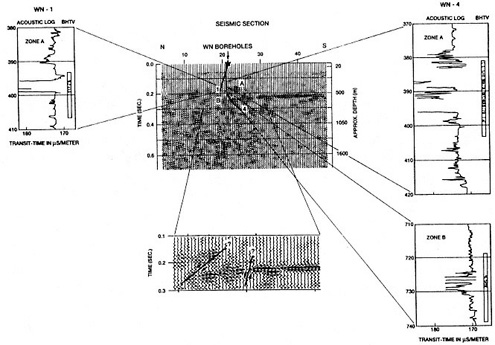
FIGURE 4.1 Comparison of a conventional P-wave reflection seismogram with acoustic televiewer image logs. The image logs show the distribution of fractures where two boreholes penetrate the reflector at locations close to the center of the seismic line. Modified from Green and Mair (1983).
Logs" in the section of this chapter entitled "single-Hole Methods") images of fractures intersecting boreholes near the center of the seismic section. The scale differences between the remote seismic sounding and the local borehole measurements are apparent in the figure. The P-wave reflections indicate a single, horizontally continuous fracture zone, whereas the borehole images indicate a great deal of variability in the local distribution of fractures in the fracture zone. This illustrates the low spatial resolving power of remote sensing methods, like seismic reflection, when used to probe to depths of several kilometers.
Three-dimensional seismic data (usually P-wave data) are remarkable for their ability to detect subtle features in the subsurface. For example, differences in the amplitudes of reflected waves may be too slight to be noticeable on a vertical section from a 2-D survey, yet they may form a distinctive pattern that is easily recognized on a horizontal section from a 3-D survey. Figure 4.2 shows a horizontal section through the 3-D survey of an oil field in Oman. The section clearly shows a pattern of orthogonally intersecting quasi-linear features, interpreted to be the seismic expression of sets of regional faults and fractures. These features are oriented vertically and in two orthogonal horizontal directions by the stress (or paleostress) field. The fractures form preferred pathways for the movement of fluids; the difference in seismic velocities between oil-filled and brine-filled rocks accounts for the linear features in the image. Advanced processing and color displays further enable the recognition of such subtle patterns.
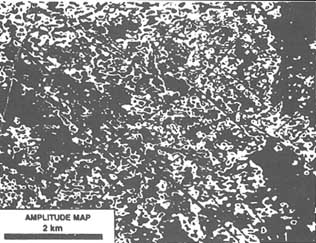
FIGURE 4.2 Horizontal section (more precisely, a map of processed reflection amplitudes, corresponding to constant reflection times) over a portion of the Yibal oil field, in Oman, showing patterns of near-orthogonal lineations interpreted as vertical faults and fractures. From Paillet (1993).
In 3D surveys on land the source and receiver patterns may include sufficient distribution of azimuths that the amplitude variation with offset of reflected P waves is measurable (cf. Lefeuvre and Desegaulx, 1993). This "azimuthal AVO" effect also is indicative of the presence of fractures, following the principles of Chapter 3.
S Waves
As discussed in Chapter 3, seismic shear waves are markedly influenced by aligned fractures, even though their wavelengths may be much greater than the size of the fractures. If the fractures are uniformly distributed and small compared to the wavelength, the waves propagate as though in a homogeneous anisotropic medium. By contrast, if the wavelength is small compared to the fractures, the waves will be scattered. However, long waves can penetrate much deeper into a rock mass than short waves (the range is approximately proportional to the wavelength), thus permitting deep investigation.
Anisotropies in the rock arising from aligned fractures split incident shear waves into two modes: (1) one polarized roughly in the plane of predominant fracturing and (2) one polarized roughly perpendicular to this plane. Of course, both of these shear modes are polarized roughly perpendicular to the raypath. To visualize this fact, imagine a pile of business cards standing on edge, with the spaces between the cards representing a set of vertical fractures. Imagine your hands holding the cards (from above and below), with your palms flat and horizontal, representing the wave fronts of a vertically traveling wave. Orient your fingers across the cards (representing shear motion in that direction), and shear the deck of cards sideways. It deforms easily, shearing along the zones of weakness between the cards (the fractures), indicating that the deck (representing a rock mass) is compliant for this sense of shear. With your palms still flat and horizontal, orient your fingers along the cards and try to shear the deck in that direction. It is much stiffer for this sense of shear because you must deform the cards themselves, without help from the zones of weakness between them.
Shear waves polarized obliquely to the fractures resolve themselves vectorially into these two particular directions, determined by the rock mass. These two modes travel at different speeds; the faster mode is polarized in the plane of the fractures. The difference in speed depends on the degree of fracturing. In a simple case (see Chapter 3) the delay depends on the dimensionless fracture density, ![]() , defined for penny-shaped cracks as
, defined for penny-shaped cracks as
where Nv is the number of fractures per unit volume (called the fracture density elsewhere in this report), and < l3 > is the average of the cube of the fracture
length. The second formulation above (Eq. 4.lb) gives the nondimensional fracture density in terms of the fracture porosity, фf, and crack aspect ratio, ![]() , the ratio of fracture thickness to fracture length. In a simple 2-D case (see Hestir and Long, 1990), the 2-D analog of parameter
, the ratio of fracture thickness to fracture length. In a simple 2-D case (see Hestir and Long, 1990), the 2-D analog of parameter ![]() (rather than, e.g., фf or Nv) controls the fracture network permeability. The theory is valid for fractures that are small compared to a seismic wavelength, that is, for microfractures up through joints; however, the < l3 > factor in the equation indicates that a few large cracks will dominate the behavior of the fracture network.
(rather than, e.g., фf or Nv) controls the fracture network permeability. The theory is valid for fractures that are small compared to a seismic wavelength, that is, for microfractures up through joints; however, the < l3 > factor in the equation indicates that a few large cracks will dominate the behavior of the fracture network.
Differences in arrival times of the two shear-wave modes after propagation through an interval several wavelengths thick provide stable averages of the nondimensional fracture density over that interval. Using typical oil industry acquisition practice, for example, average velocity differences of as little as 1 percent can be measured reliably. It is possible to measure such small differences even though neither velocity is known to within 10 to 20 percent of its absolute value. This is because shear modes both travel through the same rock and share the same uncertainties (e.g., the same unknown thickness of the interval), as with an interferometer (Thomsen, 1988). It follows that the average nondimensional fracture densities can be determined with similar high sensitivity and similar low spatial resolution. Recent advances in the application of these principles have come because of the capability to manipulate the source polarization and to record all signal components.
Petroleum industry experience has shown (e.g., Willis et al., 1986) that a low "background" density of fractures (![]() = 0.01) is ubiquitous in sedimentary rocks and that failure to account for it may result in uninterpretable shear-wave data. Such low fracture densities may not correspond to fracture permeabilities of great production significance; however, they may affect the subsurface fluid pressure regime. This happens because fractures may penetrate formations (e.g., shales) that would otherwise form pressure seals, thus establishing hydraulic continuity and a local hydrostatic pressure gradient over thousands of meters of section. See Powley (1990) for a discussion of these "subsurface fluid compartments."
= 0.01) is ubiquitous in sedimentary rocks and that failure to account for it may result in uninterpretable shear-wave data. Such low fracture densities may not correspond to fracture permeabilities of great production significance; however, they may affect the subsurface fluid pressure regime. This happens because fractures may penetrate formations (e.g., shales) that would otherwise form pressure seals, thus establishing hydraulic continuity and a local hydrostatic pressure gradient over thousands of meters of section. See Powley (1990) for a discussion of these "subsurface fluid compartments."
It is possible to apply S-wave reflection analysis by using converted P waves (i.e., P → split S waves; Garotta, 1989) to detect vertical fractures at depth. Of course, such an application involves only one source polarization. However, a single horizontal source orientation with two horizontal receiver components can provide sufficient information for the analysis (Thomsen, 1988). Meadows and Winterstein (1994) report the detection and characterization of an artificial hydraulic fracture via analysis of the reflection of split shear waves back to the surface. Macbeth (1991) discusses the practicality of various methods to estimate shear-wave anisotropy from raw seismic data.
These seismic techniques for fracture detection can be expensive. A full acquisition scheme (three source orientations, three-component receivers) may be two to five times as expensive as a traditional one-source vertical recording
survey. If only one or two horizontal sources with two horizontal receivers are used, the cost is still roughly one and one-half to three times the traditional cost. Garotta (1989) argues that a traditional vertical or explosive source, using three-component receivers, recording P waves converted to split S waves is sufficient, making the marginal cost almost negligible. Research in the next few years will determine the utility of these less expensive alternatives.
S wave methods work best in rocks that are structurally simple (e.g., horizontal beds), with simple anisotropy owing to aligned vertical cracks. In the future it may be possible to deal with more complicated situations, using the full power of the raw (prestack) data. A recent conference, summarized by Crampin (1991), provides a good cross-section of recent advances.
Electrical and Electromagnetic Methods
Detection of water-filled fractures by electrical and electromagnetic methods is possible because water-filled fractures generally have higher electrical conductivities than intact rock. This higher conductivity is attributed to the connected geometry of the fracture, the mobility of conductive ions in the water saturating the fracture, and the conductivity of clay minerals present as fracture linings or as alteration products in the adjacent rocks (see Chapter 3). Obviously, these effects are more apparent if the surrounding rocks have low porosities. A number of different methods have been developed since the beginning of the century, when these methods were first formulated.
Electrical Methods
Electrical methods utilize what from a functional viewpoint may be considered as direct current (DC). That is, the electric fields satisfy the Laplace equation. In practice, frequencies of a few Hertz are normally used, so that noise from other frequencies can be filtered out. Two electrodes are used to inject current into the ground, and two electrodes are used to measure the voltage caused by the current. A number of different electrode configurations have been invented since the beginning of the century, but only a few are commonly used (Figure 4.3). Results are normally presented as "apparent resistivity," which is calculated from the ratio of measured voltage to injected current, multiplied by a geometric factor that depends on the configuration of the electrodes.
These configurations are normally used in two modes, sounding or profiling. In the sounding mode the separation between electrodes is changed (e.g., increased), while the center of the array remains at the same location. In profiling mode the relative positions of the electrodes are kept constant, while the entire electrode array is moved along a profile, with measurements taken at regular intervals. In principle, sounding gives information on changes in resistivity with depth, whereas profiling gives information on lateral changes in resistivity. Today,
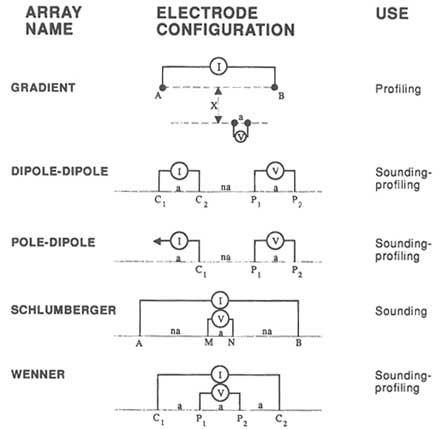
FIGURE 4.3 Common arrays used in resistivity surveys. Symbols: A, B, and C are current electrodes; M, N, and P are potential electrodes; V is voltage, I is current, a is electrode separation, n is an integer multiplier, and x is the separation distance between injection and measurement electrodes.
computer technology makes it possible to use multi-electrode arrays that allow a combination of profiling and sounding to be performed simultaneously. The dipole-dipole and pole-dipole arrays (Figure 4.3) are most commonly used in combined surveys.
Electrical soundings are made to investigate the earth beneath the sounding point, most commonly in horizontally stratified environments where the method is used to find the depth, thickness, and electrical properties of different strata. In this context, "Schlumberger sounding" is a standard technique in the search for horizontal aquifers in such environments (Ward, 1990). This and similar techniques can only be used to detect fracture systems that are semihorizontal.
The presence of steeply dipping fracture systems causes distortions in the data that can be erroneously interpreted in terms of horizontal stratification. The fact that the electric fields satisfy the Laplace equation implies that resolution deteriorates rapidly with depth. Hence, deep electrical soundings can only be expected to detect larger fracture zones. The resolving power of electrical sounding can be quantified through numerical modeling (e.g., Rijo et al., 1977; Johansen, 1977; Ward, 1990).
Electrical profiling has the capability to detect steeply dipping fractures and fracture zones and, if combined with sounding, can make rough estimates of the dip of the zones. Resolution of fractures and precision in location are normally excellent if the fractures extend to the surface. However, in many cases, fractured bedrock is covered with overburden having electrical properties similar to those of the fracture zones. In practice, this limits resolution and prevents detection of fractures and minor fracture zones. In combined sounding and profiling, the effects of overburden and loss of resolution with depth inhibit accurate estimates of dip. The effects of overburden with different conductivities and thicknesses have been investigated through extensive theoretical work and numerical modeling. Based on this work, estimates can be made of attainable resolution and deductibility in different environments. Generally speaking, resolution and depth penetration are proportional to electrode separation (Dey et al., 1975; Coggon, 1973; Barker, 1989). General quantitative estimates are difficult to make, so scoping calculations are useful in defining survey layout and expected results.
Electrode arrays may be rotated around the center point in order to obtain measurements of electrical resistivity as a function of azimuth. If the overburden is horizontally isotropic and the bedrock contains vertical fractures, the measurements appear more resistive if soundings are directed transverse to the fracture planes. This is termed directional sounding and has been applied by Lieblich et al. (1991, 1992a,b) at several sites in New England.
Electromagnetic Methods
Electromagnetic methods utilize electric and magnetic fields in the earth that satisfy the diffusion equation, which ignores the "displacement currents" that are necessary for true wave propagation. This implies that anomalies in the data, attributed to anomalous conductors in the ground, in most cases are caused by induced currents. Electromagnetic methods commonly use frequencies from a few hundred Hertz to about 100 kHz. Lower frequencies may be used to investigate large-scale structures (e.g., magnetotelluric techniques).
Electromagnetic methods commonly use noncontacting sources or receivers, in the form of loops that measure one or more of the magnetic field components. Some instrumentation also makes use of the electric field. Noncontacting sources offer an advantage, compared to electrical methods, with respect to ease of use and efficiency in the field. Electromagnetic data can be collected from airplanes
or helicopters, allowing large areas to be surveyed quickly and at relatively low cost.
Some common electromagnetic methods are presented in Figure 4.4. Like electric methods, electromagnetic methods can be used for sounding, profiling, or a combination thereof. For some applications it is advantageous to use planewave sources, that is, sources located sufficiently far away that the primary field appears to be a plane wave in the survey area. In other applications, sources and receivers are separated by fixed finite distances.
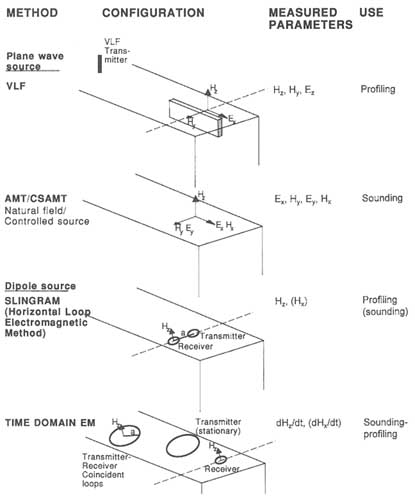
FIGURE 4.4 Common electromagnetic methods in geophysical sounding. Hx, Hy, and Hz are the components of the magnetic field; Ex, Ey, and Ez are the components of the electric field.
Modern electromagnetic equipment normally allows measurements over a wide frequency band. This can be achieved in two ways: through the use of multiple fixed frequencies (frequency domain) or by sampling the real-time response of a transmitted pulse (time domain). Mathematically, frequency and time domain methods are equivalent; the choice of domain depends mainly on practical considerations during instrument design and on noise reduction considerations.
The "skin depth" is used as a measure of the depth of penetration for electromagnetic methods. The skin depth is the distance over which a plane wave decreases in magnitude by the factor 1/e (where e, Euler's number, is approximately 2.72). The skin depth is proportional to the square root of the ratio of resistivity to frequency, so that penetration decreases with decreased ground resistivity and/or increased frequency. This implies, for example, that penetration will be poor if there is a clay-rich overburden. The actual depth of penetration for a specific method or instrument depends on the source-receiver configuration and the sensitivity and signal-to-noise ratio of the instrumentation used. It is roughly proportional to the average skin depth at a specific survey location.
When used in the sounding mode, electromagnetic methods are poor at resolving buried resistive layers but good at detecting conductive layers. This is because the electromagnetic response is from induction currents that are concentrated in the conductive layers. Thus, these methods can be used to detect semihorizontal fracture zones. Resolution deteriorates with depth owing to the diffusive nature of the electromagnetic field. Consequently, sounding methods detect fracture zones better than individual fractures at depth.
In profiling mode, overburden normally masks information about the underlying bedrock. A large fraction of the anomalies observed by using the SLINGRAM or Horizontal Loop Electromagnetic Method (HLEM), for example, are caused by localized overburden thickening, which in many cases is caused by differential weathering of the bedrock at a fracture zone. However, indirect indications of the existence of steeply dipping fracture zones may be obtained (Villegas-Garcia and West, 1983). In such cases it is not possible to estimate the dip of the fracture zone because the induced current does not flow through the zone itself. Generally speaking, dip estimates of fracture zones based on electromagnetic measurements are uncertain because currents induced at depth are much smaller than those induced closer to the surface. Thus, the measured anomalies are only weakly dependent on dip (Ketola and Puranen, 1967).
Ground-Penetrating Radar
Ground-penetrating radar (GPR) uses electromagnetic energy to obtain information about the subsurface. Use of the word "radar" implies that the electric and magnetic fields in this case satisfy the wave equation, which includes
the ''displacement currents." In principle, GPR is similar to reflection seismic techniques (Figure 4.5). The radar produces a short pulse of high-frequency (10- to 1,000-MHz) electromagnetic energy, which is transmitted into the ground. Propagation of the radar signal depends on the electric properties of the rock, mainly the dielectric constant and electrical conductivity. These properties are primarily controlled by fluid content and the presence of clay minerals. Where these properties change abruptly in the subsurface, part of the energy is reflected back to the surface.
An important consequence of the applicability of the wave equation is that resolution is of the same order as the dominant wavelength. In combination with probing ranges of many wavelengths, this implies that detailed information can be obtained on structures located "far" away (i.e., in the probing range). In some sense this is equivalent to "seeing" through the rock. The radar range is roughly proportional to the first power of the resistivity of the rock. In highly resistive granites, probing ranges of about 100 m are regularly obtained for frequencies in the 20- to 100-MHz range (Holloway et al., 1992; Olsson et al., 1992). In
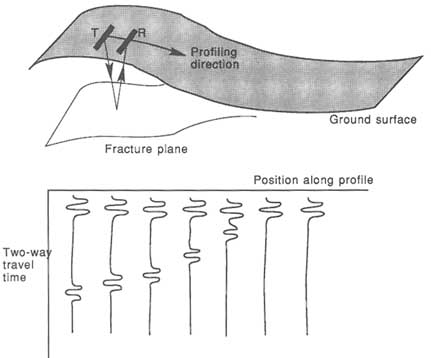
FIGURE 4.5 Schematic illustration of ground-penetrating radar used in profiling mode. T is the transmitter; R is the receiver.
other resistive rock types, probing ranges of 10 to 20 m are common. In highly conductive media such as clays, probing ranges are commonly only a few meters. Probing range decreases with increasing frequency, but resolution improves. Frequencies in the range of 500 to 1,000 MHz make it possible to obtain detailed information on structures in a few meters of the surface. For example, high-frequency radar is regularly used in the investigation of roads and other structures for fractures, rebars, voids, asphalt, and concrete thickness.
In principle, GPR is an excellent tool for finding fractures. For example, GPR surveys on granitic outcrops at the Underground Research Laboratory in Manitoba, Canada (Holloway et al., 1992) located semihorizontal fracture zones to depths of 70 to 80 m below the surface (Figure 4.6). However, as with all electric or electromagnetic methods, conductive overburden presents a problem because it prevents significant energy from penetrating into the underlying bedrock. In cases when significant overburden is present, very little information on bedrock structures will be obtained. However, GPR can be used to estimate the thickness of the overburden or to investigate its internal structure. The effectiveness of GPR in indicating fracture zones is illustrated by comparing the number
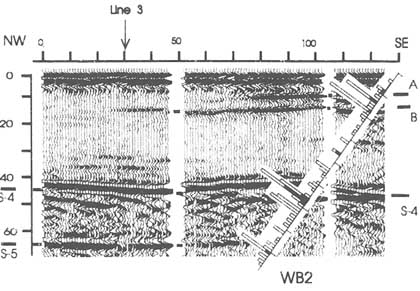
FIGURE 4.6 Semihorizontal fracture zones observed by ground-penetrating radar along a profile measured on granitic outcrops at the Underground Research Laboratory, Manitoba, Canada, showing distribution of fractures along borehole WB2. Reflectors S-4 and S-5, seen at depths of 40 to 50 m and 65 m, respectively, are verified by increased fracture frequency observed in the slanted borehole NB2. The smallest bars indicate single fractures; the other bars are scaled accordingly. From Holloway et al. (1992).
of closed fractures (indicated by open solid bars) and open fractures (solid bars) in borehole WB2 drilled through the section imaged with the GPR in Figure 4.6.
In summary, GPR is an excellent tool for mapping fractures or fracture zones with high resolution in the absence of overburden. If overburden is present, it can be used to map the structure of the overburden. If GPR is used in boreholes and tunnels, the problems caused by the overburden can be avoided. The capabilities and applications of borehole radar are discussed in a later section.
Tiltmeters
Tiltmeters installed on or below the earth's surface can detect volumetric strains in the subsurface. These strains can result from active hydraulic fracturing or from poroelastic or thermoelastic strains resulting from fluid injection at less than fracture pressure.
For fracturing operations the depth of fracturing is normally controlled by the placement of packers in the hole. The vertical extent, azimuth, and horizontal length of these features are indirectly controlled by varying the pumping pressure and can be monitored by using tiltmeters. A circular array of tiltmeters, typically with a radius 40 percent of the nominal fracture depth and sensitive to tilts of 10-9 radians, can delineate the azimuth and volume of fracturing. (The dimensions of the fractures also can be inferred from these data; e.g., Lacy and Smith, 1989.) Tiltmeter data are used to determine how well the operator has succeeded in engineering these fractures. For fluid injection, tiltmeter data can be used to determine the pore pressure distribution in the subsurface by relating the observed deformation to changes in effective stress. Tiltmeter data can also provide an approximate estimate of the permeability tensor.
One specific application of tiltmeter measurements to hydraulic fracture studies is the identification of fracture orientation changes around boreholes. These changes occur in response to changes in the direction of principal stress in rock around the borehole. For example, the minimum principal stress may be horizontal immediately adjacent to the borehole wall and vertical away from the local stress concentration produced by the borehole. In such situations, borehole imaging techniques will indicate vertical fractures in the wellbore. However, tiltmeters arrayed around the wellbore will indicate a symmetrical distribution of tilt away from the borehole during fracture inflation. These tiltmeter measurements indicate the presence of horizontal fractures, signaling that the vertical fractures observed in the wellbore have rotated to horizontal positions as they propagate away from the wellbore. Such results have been reported (R. H. Morin, U.S. Geological Survey, 1992, personal communication) for a 365-m-deep hydraulic fracture generated in granitic rocks on the western side of the Sierra Nevada uplift in California.
Geological Observations
Fracture orientations observed visually at the surface are commonly preserved at depth, as discussed in Chapter 2. Surface fractures may be observed in road cuts or river cuts or as lineaments on air photos or satellite imagery. Schmidt (1985) gives an example of how surface exposures can be used to constrain subsurface fracture occurrences. Even when fractures are not visible at the surface, air photos and surface geophysical or geological maps can serve as valuable guides in designing borehole networks or excavations to sample fractures and to identify possible relationships between fracture distributions and large-scale geological structures.
BOREHOLE-BOREHOLE AND BOREHOLE-SURFACE METHODS
For most surface characterization techniques, overburden introduces difficulties because of its attenuation properties and the high contrast in its properties compared to the underlying rock. In many cases the overburden acts as a filter that obscures information about the subsurface, requiring the use of complex correction procedures to obtain useful information. Boreholes and tunnels provide access to measurement points below the ground surface, allowing many of the problems introduced by the overburden to be avoided. The main advantages of performing measurements underground is that they provide subsurface confirmation of the surface measurements. They also allow surface measurements (e.g., seismic reflection data) to be tied directly to lithology and structure. Many of the measurement techniques applied at the ground surface, which were presented in the previous section, can be applied in boreholes with appropriate modifications.
Compared to surface surveys, borehole measurements sometimes require complex (and compact) sensors. Furthermore, the measurement locations are restricted to a few lines through the space represented by the boreholes and tunnels. Borehole investigations are also more costly than comparable surface surveys, owing to higher drilling and measurement costs.
The techniques discussed in this section apply to the determination of rock properties at considerable distances from the measurement locations; that is, they are remote sensing techniques. The subject of near-borehole measurements is deferred to the section "Single-Hole Methods," later in this chapter.
Remote sensing techniques are based on the propagation of waves, either seismic or electromagnetic, through the rock. As from the surface, these techniques can be applied in either transmission or reflection mode. It should be recognized that a combination of transmission and reflection data normally are collected during a survey, but in most surveys only one of the data sets is actually used. Remote sensing is done with sources and receivers placed in the same borehole, in different boreholes, or one in the borehole and the other at the
ground surface. Depending on the application, these surveys are referred to by different "trade" names, but the principles are the same.
Vertical Seismic Profiling
The vertical seismic profile (VSP) survey method provides a compromise between the large scale of surface seismic soundings and the fine scale of borehole logs. The VSP survey is performed by using a surface seismic source and receivers located in the wellbore. The method was originally designed to verify travel time versus depth inversions for surface surveys but has since been expanded to include a variety of applications (White, 1983; Balch and Lee, 1984). The smaller spatial scales and the depth control given by the borehole allow inversions of somewhat higher frequencies than those typical of conventional surface seismic surveys. The higher frequencies provide greater spatial resolution of the target area. At the same time, these conditions restrict the volume of rock that can be investigated to the vicinity of a borehole.
The simplest form of a VSP survey places the source as close to the wellhead as practicable (i.e., zero offset). If the source is placed some distance away from the wellhead, the survey is referred to as an offset VSP survey. If several offset source positions (located on a line leading away from the borehole) are used, it is called a walkaway VSP survey. If the source is in the borehole and the receivers are on the surface, it is a reverse VSP survey (an RVSP). There may be one receiver station or many for each source. If the borehole is deviated from the vertical, other configurations are possible. For example, in a walkabore survey both source and receiver are translated together, so that the raypaths are always vertical. For a 100-m-deep borehole, the volume of investigation in a typical VSP survey would range from 100 to about 1,000 m in diameter.
Other types of P-wave VSP surveys have been used successfully to characterize fracture zones in crystalline rock. Carswell and Moon (1989) used a walkaway VSP survey to characterize semihorizontal fault zones at the Underground Research Laboratory in Manitoba, Canada. The experiment was successful in mapping several fracture zones; however, wide-angle reflections and mode conversions limited the useful data window at large offsets.
A new technique for processing VSP-type data for the identification of fracture zones was developed within the framework of the International Stripa Project by Cosma et al. (1991). Referred to as image space processing, it is based on the assumption that fracture zones are planar reflectors in a constant-velocity host rock. This assumption has been found to be valid in many crystalline rock environments. This processing method determines the statistical significance of possible reflectors by comparing their strengths with the noise level in the data. It has proved to be very useful in detecting fracture zones in crystalline rock, as it allows enhancement of very weak reflections caused by fracture zones.
Recent developments in VSP technology related to fracturing of reservoirs include the use of three-component geophones to register S waves (see "S Waves," in the section on "Seismic Reflection," earlier in this chapter). The borehole environment is particularly amenable to split shear-wave analysis, because interference from reflection effects at the ground surface is avoided (Crampin et al., 1986). Shear-wave splitting of vertically traveling S waves is assumed to be caused by preferentially aligned fractures, and the magnitude and orientation of shear-wave splitting reflect the frequency and orientation of such fractures. The first field application of this technique was in a geothermal environment at The Geysers (Majer et al., 1992). Winterstein and Meadows (1991a,b) reported a correlation between the orientation of the faster shear waves and in situ stresses (1991a) and significant changes in polarization orientation and magnitude with depth (1991b). Liu et al. (1993) discuss the detailed characterization of multiple subsurface fracture sets, using VSs, RVSs, and cross-hole surveys to measure the azimuthal anisotropy of shear-wave velocity and attenuation at the Conoco Borehole Test Facility in Oklahoma.
One particular form of VSP survey, the VSP hydrophone tube-wave analysis, has been found especially useful for detection of fractures intersecting boreholes. "Tube waves" are confined to the interior and neighborhood of the borehole, and travel somewhat slower than shear waves in rock. This method uses hydrophones suspended in a fluid-filled borehole to detect tube waves generated by the interaction of P waves from the surface source with hydraulically conductive fractures that intersect the borehole. When source strength is corrected for geometrical spreading, the amplitude of the tube waves generated by this interaction can be related to fracture hydraulic conductance (Hardin and Toksöz, 1985; Hardin et al., 1987). The relative variation of amplitudes of the tube waves from different offset source azimuths can be used to estimate the strike and dip of the permeable fractures. VSP tube-wave surveys have been compared to other geophysical and hydraulic data at several fractured rock sites and have generally been found to agree qualitatively but not always quantitatively with these data (Paillet et al., 1987; Paillet, 1991a). Used in this manner, VSP is not exactly a remote sensing method because the information obtained represents properties of fractures where they intersect the borehole.
Transmission Tomography
Transmission measurements are normally made between boreholes, between a borehole and the ground surface, or both. Measurements are commonly made of travel times and amplitudes of first arrivals, which directly yield the average velocity and attenuation for the wave type used. The basic idea behind tomographic reconstruction is that information about the properties of the interior of a volume can be obtained through measurements performed at the boundary. For this purpose, multiple source and receiver locations are required to probe the volume of investigation with multiple crossing rays, each a source-receiver combi-
nation (e.g., Figure 4.7). The travel time and amplitude data for each transmitter-receiver pair are assumed to represent the average of material properties of the rock along the raypath. In tomographic inversion the task is to reconstruct the velocity or attenuation distribution in the interior of the investigated volume from these averages.
To obtain an estimate of the unknown property at a given point, it is necessary that several rays pass close to the same point and that the rays have different directions and thus different information content. The requirement that several rays pass within each volume (of roughly spherical shape) with dimensions on the order of a wavelength places constraints on the borehole geometry. In practice, this implies that the source and receiver positions, and hence the boreholes, must be located in the same plane. Three-dimensional tomography is possible in principle, but in practice it is difficult to obtain ray coverage dense enough for reasonable resolution in three dimensions.
In borehole-to-borehole—or cross-hole—measurements, data on both travel time and amplitude of the direct wave between transmitter and receiver (i.e., the first arrival) can be extracted. Consequently, two types of tomograms can be constructed: one based on travel times that resolves the distribution of velocity, and the other that resolves the distribution of attenuation. The latter type has only recently been applied, but a number of good examples exist. It is assumed that the travel time, ti, for the ith ray can be constructed as the line integral of inverse velocity ("slowness"), 1/v(x), along each ray Li:
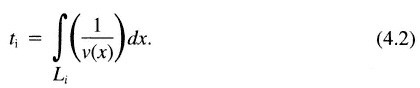
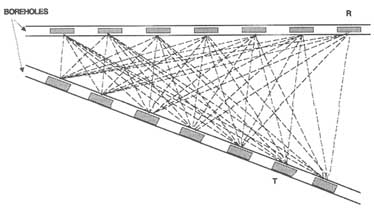
FIGURE 4.7 Schematic configuration of sources and receivers for transmission tomography between boreholes, also called borehole-to-borehole or cross-hole tomography. R is the receiver; T is the transmitter.
The amplitudes cannot be obtained from the line integral directly, but by taking the logarithm of the amplitudes the problem can be linearized:
where ![]() i is the total attenuation along ray i, ri is the distance between transmitter and receiver,
i is the total attenuation along ray i, ri is the distance between transmitter and receiver, ![]() is the local attenuation at position x, E0 is a normalization constant, Ei is the measured (vector) amplitude, as(
is the local attenuation at position x, E0 is a normalization constant, Ei is the measured (vector) amplitude, as(![]() 1) is a function describing the radiation pattern of the source, and ar(
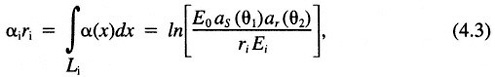
1) is a function describing the radiation pattern of the source, and ar(![]() 2) is the corresponding function for the receiver. An inversion of the logarithm of the received amplitudes should give an estimate of the distribution of attenuations in the plane of investigation. Examples of a slowness tomogram and an attenuation tomogram of the same rock mass are given in Figure 4.8.
2) is the corresponding function for the receiver. An inversion of the logarithm of the received amplitudes should give an estimate of the distribution of attenuations in the plane of investigation. Examples of a slowness tomogram and an attenuation tomogram of the same rock mass are given in Figure 4.8.
The slowness and attenuation tomograms exhibit small differences in the location of anomalies. A possible explanation for the observed differences, to some extent supported by data from the International Stripa Project, is that the increased slowness corresponds to open fractures (increased porosity), while the
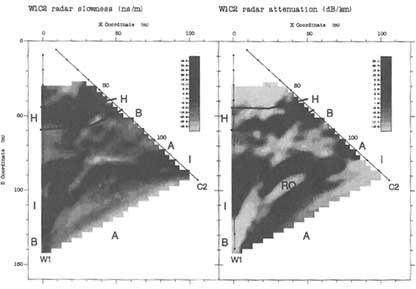
FIGURE 4.8 Tomographic reconstruction of a borehole section in the Stripa mine using 60-MHz radar, showing radar slowness (left) and radar attenuation (right). Arrows and letters give the positions of fracture zones inferred from these and other data. From Olsson et al. (1992).
increased attenuation is caused by alteration of the rock (the presence of clay minerals). This hypothesis is based on the fact that increased slowness is mainly due to increased water content, while increased attenuation is mainly due to increased electrical conductivity.
If velocity contrasts are smaller than 10 to 15 percent, ray bending according to Snell's law can be neglected, and the raypaths, Li, can be assumed to be straight lines. This makes the system of equations linear. The straight-ray assumption can also be justified, even if velocity contrasts are larger, when there are low-velocity anomalies embedded in a high-velocity medium, as demonstrated by Dyer and Worthington (1988). This situation frequently occurs when mapping fracture systems (low-velocity anomalies) in crystalline rock. The straight-ray assumption is normally not useful if there is a general velocity gradient over the investigated area. This is commonly the case in sedimentary basins where velocity generally increases with depth.
Tomographic inversion can be performed either with transform methods or series expansion methods. Integral transform methods (e.g., the inverse plane-wave transform) are commonly used in medical tomography, where the angular ray coverage of the investigated region is quite complete. In geophysical tomography there is generally incomplete angular ray coverage (i.e., sources and/or receivers cannot be located on all sides of the region of investigation), and ray bending is significant in many cases. This makes series expansion methods more useful. In these methods the target region is assumed to consist of a discrete set of pixels, and the measured property is formed as the sum of the pixel values along the raypath. This approximates the physical problem as a matrix equation, which must be solved numerically.
If raypaths are straight, there is a linear relationship between travel time and slowness or inverse velocity (Eq. 4.2), or between amplitude and attenuation (Eq. 4.3). However, if ray bending is significant, the system is nonlinear because the length of the raypath becomes a function of the slowness. To obtain a solution of the nonlinear system, a series of linearized problems are solved iteratively. The system of travel time equations is generally large, sparse, ill posed, and overdetermined; it may also be underdetermined. "Overdetermined" means that there are more data available than unknowns; the data are mutually inconsistent (in the strict sense), so that a solution is found that "best" fits the data. "Underdetermined" means that the data are not sufficient to determine all of the unknowns, for example, those pertaining to pixels with insufficient illumination by the rays.
The system of equations is solved by using some minimization criterion for the difference between the model solution and the measured data. Several iterative inversion algorithms have been devised and are referred to by acronyms such as ART, SIRT, and CG (for a description, see Ivansson, 1986). These methods generally yield similar results; there are standard methods for determining the validity of the solutions in light of the problems mentioned above. It is also
possible to solve the equation system by direct inversion, but this is normally not done because of the very large number of unknowns and the long computing times required.
Resolution of a tomogram depends in a complex manner on a number of factors. At best, resolution is no better than about one-quarter the dominant wavelength. It also depends on the ray pattern (density and angular coverage), geological structure, noise levels, and placement accuracy of source-receiver positions. In practically all geological applications, sources and receivers cannot be located on all sides of the investigated area. This leads to artifacts or errors in the reconstructed image, particularly in parts of the plane where the ray density is low or the rays are nearly parallel. These problems have been discussed in a number of papers (e.g., Nolet, 1987; Dyer and Worthington, 1988a, b; Bregman et al., 1989; Krajewski et al., 1989). Limited ray coverage generally leads to smearing of anomalies. The effect of ray coverage can be quantified by computing the ability of the data to resolve each pixel (Nolet, 1987). Errors due to noise, zero-time offset, and inadequately known source and receiver locations are more difficult to quantify.
Tomographic inversion normally assumes that the medium is isotropic. However, this method requires a large angular distribution of raypaths in order to include rays with different information content. This inevitably exposes the technique to artifacts if the medium is in fact anisotropic. It is easy to see that small travel time differences owing to large velocity differences in small anomalous areas may be comparable in magnitude to those caused by even weak velocity anisotropy throughout the entire region crossed by the rays. One way to handle this problem is to use all the raypaths to define an average anisotropy. Then all the travel times are adjusted to remove the differences caused by this average anisotropy (Majer et al., 1990; Olsson et al., 1991). The residual differences in travel times are then assumed to be due to heterogeneities alone. One difficulty with anisotropy correction is that the variation in travel times caused by fracture zones that are aligned with the fabric of the rock may be removed by the correction. The difference between heterogeneity and anisotropy is blurred in this case.
Tomographic surveys can be repeated to indicate some change of state in the rock, occurring between the initial and subsequent surveys. This is called difference or alterant tomography. For example, this technique makes it possible to study groundwater flow paths through rock. Saline tracer injected into the rock increases the attenuation of radar waves. Tomographic inversion of the difference in attenuation data before and after injection of tracer provides an image of the location and amount of tracer in the tomographic plane. Multiple repetition measurements provide data on the spreading of tracer as a function of time (Olsson et al., 1991). A fuller discussion is given later in this chapter under "Fluid Flow Monitoring Using Geophysical Methods."
Seismic Tomography
Seismic cross-hole tomography can be applied at a variety of scales, ranging from detailed engineering studies on the meter scale to reservoir studies on the kilometer scale. The frequencies used vary with the scale of investigation from a few tens of hertz for kilometer-scale investigations to tens of kilohertz for meter-scale investigations.
To obtain large cross-hole probing ranges, powerful seismic sources are required. Explosives can provide the necessary power, but their use must be restricted to avoid damage to the borehole. Commonly applied sources include air guns, electric sparkers, down-hole hammers, and piezoelectric sources. To avoid borehole damage, these sources provide limited energy output and can be used only for shorter ranges. Further development of new seismic borehole sources is needed. A promising technique is to use nonimpulsive sources where the signal is extended in time (e.g., swept-frequency sources, whose total energy may be substantial), but the instantaneous power rate is small.
Either hydrophones, which sense the scalar pressure pulse in the borehole fluid caused by the wave, or geophones, which are clamped to the borehole wall and sense the vector motion of the wave, are used as receivers. These instruments sense the velocity of the medium caused by the wave. In detailed engineering applications, three-component accelerometers are sometimes used because of their high-frequency response.
Comprehensive studies of fracture characterization with seismic tomographic techniques have been performed in nuclear waste disposal programs. In situ tests have generally been successful in mapping the location and properties of fracture zones (Sattel and Gelbke, 1987; Bregman et al., 1989; Cosma, 1990; Majer et al., 1990; Tura et al., 1991). An example from a detailed characterization of a fracture zone at the Grimsel test site in the granitic Alps of Switzerland, using sources and receivers on all four sides of the investigated area, is shown in Figure 4.9.
Radar Tomography
Borehole radar normally implies the application of a pulsed source. Radar wave propagation is only feasible in resistive formations, for example, crystalline rocks, limestones, and salt formations. Tomographic surveys have been performed using frequencies in the range of 20 to 500 MHz, corresponding to wavelengths of approximately 5 to 0.2 m in rock. Useful cross-hole ranges for the lower frequencies can be more than 100 m. Fracture zones normally appear in the tomographic images as regions of low velocity and increased attenuation compared to the surrounding rock. Radar has also been used successfully to map saline tracer transport through fractured rock by repeated tomographic measure-
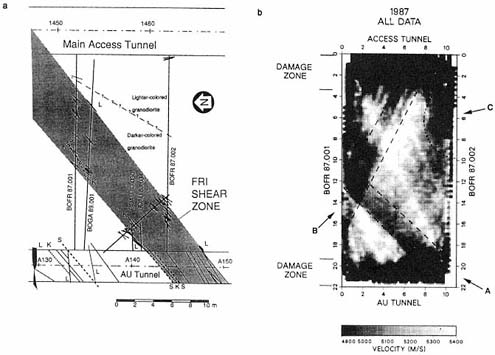
FIGURE 4.9 (a) Geological plan view of the FRI fracture zone at the Grimsel test site that is intersected by two parallel tunnels. (b) Seismic tomogram obtained with complete (four-sided) coverage by inverting the 1987 data. From Majer et al. (1990).
ments (e.g., Olsson et al., 1991). Increases in radar attenuation caused by a saline tracer can be used to estimate flow porosity (Olsson et al., 1991).
An example of a radar attenuation and seismic velocity tomogram from the same borehole section is shown in Figure 4.10. The low-velocity and high-attenuation anomalies correspond to fracture zones, with widths ranging from 1 to 8 m, intersecting a granite intrusion. The agreement between seismic and radar results is remarkable considering that they represent different physical properties of the rock mass.
Electromagnetic Tomography
There are also a number of continuous-wave electromagnetic systems that can be used for cross-hole surveys. Some work in the high-frequency range (above 10 MHz), where wave propagation is the dominant phenomenon in resistive rock types. These systems are normally used for attenuation tomography and yield resolutions comparable to the pulsed-radar systems described above.
There are also a few systems that use frequencies of a few hundred kilohertz. In this frequency range, diffusion processes dominate, which results in an inherent loss of resolution. An investigation method of this type is the radio imaging
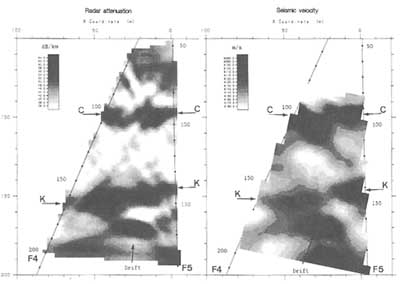
FIGURE 4.10 Tomographic reconstruction of borehole Section F4-F5 at the Stripa mine. Left, radar attenuation data; right, seismic velocity data. From Olsson et al. (1992).
method, which is applied in underground openings to characterize resistive beds (e.g., coal seams) surrounded by more conductive strata. The resistive bed acts as a wave guide because the waves are less attenuated in the resistive rock; ranges of several hundred meters can be obtained (Stolarczyk, 1990). Faults can be detected indirectly as changes in affected coal seams. Because fractures are usually less resistive than their surroundings, this method is infrequently used for fracture detection.
Horizontal magnetic dipoles (vertical loops) located in drifts or boreholes are used as sources and receivers. This results in a vertical electric field component between the conductive layers, with the magnetic field component horizontally polarized in the seam. Data from multiple sources and receivers can be inverted by tomographic techniques to yield maps of electric properties in the resistive bed. Interpretation of the reconstructed images normally requires the knowledge and skill of a geologist.
Three-dimensional inversion schemes for electromagnetic data require modeling the forward problem repeatedly. Successful inversion requires a great deal of high-quality data from many sources (Alumbaugh and Morrison, 1993; Lee, 1993).
Electric Resistivity Tomography
Inversion techniques for cross-hole direct-current electric data also have been developed and are commonly referred to as electrical resistivity tomography. In
this case the inversion assumes that the media satisfy the Laplace equation. Laplace methods inherently have a lower resolving power. Inversion techniques based on iterative finite-element algorithms (Yorkey et al., 1987; Daily and Owen, 1991) and alpha centers (Shima and Saito, 1989; Shima, 1990) have been developed and tested on synthetic and field data. Results appear promising, but further research is required to resolve issues concerning resolution and uniqueness of solutions in geological environments.
Borehole Reflection Methods
Reflectivity is not an intrinsic property of rock; instead, it is a function of the differences in rock properties and the distance over which such differences occur. Hence, derivation of rock properties based on reflection data is difficult. Instead, reflections primarily give information on the geometric characteristics of geological features.
Cross-Hole Seismic Reflection
The image space processing technique discussed earlier has been applied to reflection data from borehole-to-surface, borehole-to-borehole, and borehole-to-tunnel surveys (e.g., Blumling et al., 1990; Cosma, 1991). Seismic reflection techniques can also be applied in tunnels (during excavation) to predict the occurrence of fracture zones or other geological features that may disrupt excavation work ahead of the tunnel face (Sattel et al., 1992).
Borehole Radar
The borehole radar technique was developed during the 1980s and is now available for commercial use. One of the most significant contributions to the technique was made by the international Stripa Project, where new equipment, processing, and interpretation techniques were developed. The new system can be used for single-hole reflection measurements and for cross-hole reflection and tomography surveys.
A recent development is a directional antenna that senses the direction of the received radiation. This makes it possible to uniquely determine the orientation of a fracture zone from measurements in a single borehole (Sandberg et al., 1991). Figure 4.11 shows the main components of the short-pulse directional borehole radar system developed in the Stripa Project. It includes a computer unit that is used for control of measurements, data storage, presentation, and analysis. The transmitter and the directional receiver are connected to the control unit through optical fibers; power is supplied through downhole batteries. The system uses dominant frequencies in the range of 20 to 60 MHz, corresponding to wavelengths in most rock types of 6 to 2 m. The transmitter in the directional
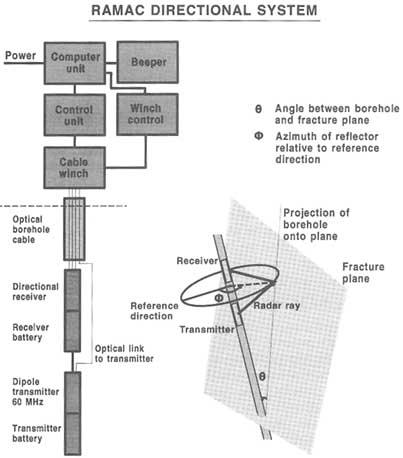
FIGURE 4.11 Main components of the short-pulse directional borehole radar system. From Olsson (1992).
radar system is equipped with an electrical dipole antenna aligned with the borehole axis. The receiver is sensitive to the direction of the incoming radiation, and this makes it possible to find the location of a reflector relative to the borehole (see Appendix 4.A).
Evaluation of borehole radar data enables understanding the observed features with respect to physical properties, orientation, and size. Reflections are caused by differences in electric properties and can be understood from general arguments concerning wave propagation. In this respect the general characteristics of radar-and seismic-wave propagation are similar and have been described in numerous textbooks (e.g., Stratton, 1941; Telford et al., 1976; Claerbout, 1985).
Features with large contrasts in electric properties will cause strong reflections, independent of their thickness. For example, a thin metallic foil is sufficient for total reflection of radar waves. In the typical case in which the contrast in properties is low, a certain minimum thickness is required to give a reflection that stands above background. This is referred to as the detectable limit and is sometimes taken to be about one-thirtieth the dominant wavelength. For borehole radar applications, this corresponds to about 10 cm (thicker than a single fracture). Hence, borehole radar will detect fracture zones, clusters of fractures, and tectonized zones rather than single fractures. The capability to detect features with a thickness of about 10 cm has been verified in the Stripa Project mine, where a reflector was identified by using radar and was later excavated and found to be a 10-cm-wide tectonized zone.
Borehole radar detection ranges vary considerably, depending on the conductivity of the host medium. In highly resistive granites or rock salt, probing ranges of about 100 m or greater are common; ranges in conductive clays or brine-saturated porous sandstones can be so short that the method is virtually useless in such environments.
Coupled Inversion of Transmission and Reflection Data
In most cross-hole measurements where pulsed sources are used, the entire waveform form is recorded. In most cases only the time or amplitude of the first arrival is used for tomographic inversion, as described in the previous section. However, the entire waveform contains information about the structure of the rock and can be included in the data inversion. An inversion algorithm of this type is termed diffraction tomography. Principles for the 2-D case have been outlined by Wu and Toksöz (1987), who provide several synthetic examples showing that reconstructed images of rock properties with satisfactory resolution could be obtained from cross-hole configurations. Pratt and Worthington (1988) tested the 2-D algorithm in an ultrasonic tank experiment and obtained reasonable agreement with the experimentally defined velocity distribution. They recognized that the use of point sources to characterize 2-D objects (i.e., a 2.5-D geometry) requires extensions to the original scheme outlined by Wu and Toksöz. Tura et al. (1991) used a pseudospectral finite-difference technique to investigate the applicability of the Born approximation to actual data. Although the results were not as good as desired, they showed that diffraction tomography may become practical if the first-arrival wavelet can be removed from the data. Further experience is needed before the practical applicability of diffraction tomography can be resolved.
The velocity field obtained from tomographic inversion of transmission data can also be used as input to image construction (depth migration) with reflection data. Velocities derived from transmission data are used to obtain a more exact velocity field, which is then used as a priori information in the interpretation
of reflection data. Reflection and transmission data can be used iteratively to successively improve the seismic image of the subsurface regions (Lines, 1991). These procedures are commonly referred to as seismic reflection tomography and are applied to surface measurements. An integrated scheme for wave equation and tomographic inversion of borehole data also has been suggested by Pratt and Goulty (1991).
Acoustic Emissions
Acoustic emissions (AEs) normally accompany the growth of fractures. These microseismic events, containing measurable frequencies of 10 to 1,000 Hz, can be detected at ranges of several hundred feet in competent rock (Lacy and Smith, 1989) and frequently indicate the presence of a fractured zone rather than a single isolated fracture (Wills et al., 1992). It is known from laboratory and small-scale field experiments that seismic signals are generated during and after the hydrofracture process (Lockner and Byerlee, 1977; Solberg et al., 1977).
Acoustic emissions have been used to infer the effects of fluid injections and hydrofractures on scales ranging from laboratory to field (Pearson, 1981; Batchelor, 1982; Majer and McEvilly, 1982; Majer et al., 1983; Majer and Doe, 1986). Acoustic emissions are used to identify the location of fluids injected into ''tight" rock. For years earthquake seismologists have been concerned with characterizing the seismic signals generated from slip along a discontinuity in the earth; AEs are no different except for their size. AEs are used to specify the dynamic source properties (fracture orientation, dimensions, slip orientation, time history of slip, and stress distribution) from the seismic waveforms.
The dominant mechanism in these signals is shear, rather than tensile slip. Because of the relatively high frequency of the AE, it may offer a real-time method for monitoring with greater resolution than tilt or magnetic measurements. In the past, most efforts have used single or multicomponent sensors, either on the ground surface (if there is no weathered overburden) or in a nearby borehole, to detect P and/or S waves (Power et al., 1976; Smith et al., 1978; Nyland and Dusseault, 1983). In an important large-scale field experiment, Baria and Green (1986) observed that when a viscous fluid is used for injection, the AEs are more likely to be tensile events, whereas lower-viscosity injection fluids yield shear events.
In deeper injections, slip is more likely to develop on preexisting fractures if there is a large differential stress. In such a case, the change in pore pressure would more likely cause shear failure on preexisting planes. (It must be kept in mind, however, that such AE activity is possible without significant fluid flow.) On the other hand, if new fractures are created, tensile failure would be expected. In the case of grouting, the pressures are held well below the breakdown point, so no tensile failures should occur. The question of the relationship of AE activity to fluid flow is then crucial. Does AE activity mean fluid flow in the same area
as the AE events, or is it mainly a pressure buildup without significant fluid flow? These and other questions regarding the significance and characteristics of the seismic signals can be addressed by analyzing acoustic emissions.
To avoid the high attenuation of the near-surface layer, receivers are normally placed in boreholes. The orientation of the clamped three-component receiver is determined from the signals received on each component from controlled sources, usually fired at a number of azimuths on the surface. Then the direction of acoustic emissions caused by the hydraulic fracturing is determined by resolution of the P-wave arrival on the three components, and the distance is estimated from the difference between the P- and S-wave arrival times. Alternatively, if several wells are available for monitoring, the location of the slip event can be determined from P waves recorded in single-component receivers, or hydrophones, by standard triangulation methods.
AE studies have proven especially useful in complex geothermal reservoirs, where downhole transducers cannot be readily inserted into the hostile environment and where transmission losses from remote seismic sources can be severe. Acoustic emissions induced by pressure and temperature changes in the reservoir rock can be related to the thermomechanical deformation of the reservoir. Acoustic emissions can be used to interpret the nature of reservoir deformation, to characterize the nature of fracture formation and propagation, and to interpret the location and geometry of fractures in the reservoir. A detailed description of the application of acoustic emission methods to reservoir studies is given in the discussion of fracture studies at The Geysers Geothermal Area in Chapter 8.
SINGLE-HOLE METHODS
Boreholes and tunnels provide the only direct means of access for measurements of fracture properties at depth. Most geophysical logging methods were designed to meet the need for measurements performed in situ, adjacent to a borehole, and in sample volumes small enough to significantly improve spatial resolution over that obtained from surface or surface-to-borehole methods. The primary drawbacks of geophysical logging in fracture applications include the effects of the borehole and drilling damage on the fracture in the measurement volume, and the restriction of sampling to the immediate vicinity of the borehole. This spatial restriction introduces significant bias in the characterization of fracture populations because boreholes are not very effective in sampling fractures, especially those aligned parallel to the borehole axis. The need to sample enough of the formation adjacent to the borehole to offset the effects of drilling damage and the effects of the fluid column on the geophysical measurements also impacts the ability to resolve fractures. Despite these important limitations, measurements made in the immediate vicinity of boreholes are very useful in characterizing fractures and fluid flow through fractures in a number of important applications.
Core Inspection
One of the most obvious and direct methods for characterizing fractures in situ is core examination. Samples containing fractures are commonly obtained by conventional rotary coring. This method is suitable for hard crystalline rocks where samples generally remain intact. It is usually found that in crystalline rocks the amount of core recovered is inversely proportional to the density of the fractures and the intensity of weathering associated with fracturing. Fracture samples in softer sedimentary formations are sometimes recovered in a relatively natural state by analogous methods, by using "shale" bits rather than diamond coring bits, or by driving the sampling barrel directly into the formation.
The orientation of recovered samples may be determined by comparing the core with oriented borehole image logs (Paillet, 1991a) or by orienting the core barrel during drilling. Core orientation is frequently determined by drilling slightly off vertical (usually by 15 or 20 degrees at a known azimuth) and fitting the core barrel with a gravitationally oriented scribe that scores the core on the downward side as it is extruded into the barrel. However, this technique is impractical for long boreholes.
Fractures are usually described as they are recovered from the core barrel. A qualitative or semiqualitative measure of fracture density is given by the "rock quality designation" factor, which is defined as the ratio of recovered core more than 4 in. (about 10 cm) long and of good quality to the total drilled length and is expressed as a percentage. Another measure of fracture density is the number of fractures intersecting the core per unit length. However, core is commonly lost or the core barrel is filled with rubble in many intensely fractured intervals, strongly biasing such fracture frequency determinations.
Fractures are also described by their openness or apparent ability to conduct fluids. In a simple example, fractures might be described as closed, open, and opened by drilling. A fourth classification, rubble, is sometimes added to include sections of core that are so badly broken that it is not practical to refit the many broken and ground pieces together. In many cases it is these very rubblized zones that dominate fluid flow.
In more sophisticated studies the degree and type of weathering associated with fracture faces is recorded. This information might include the chemical composition and nature of staining films on mineral grains, the width of alteration halos, and the amount of various infilling minerals. Fracture apertures may be estimated by measuring the diameter of isolated crystals deposited on the fracture faces. It is assumed that these crystals grew in place in the fracture, so that their size is a lower limit of the size of the opening in which they developed.
Although core inspection would appear to be a simple and direct method for characterizing fractures, it has several important drawbacks. The method can be slow and prohibitively expensive. Core samples provide a very small volumetric sample of the fracture, especially when core diameters are only a few centime-
ters. Small samples are not necessarily representative of fractures in the surrounding rock mass. Even small core samples are likely to have been damaged during drilling, and core recovery may be poor in the intensely fractured and weathered parts of the rocks that provide most of the hydraulic conductivity. Hence, core studies may not be reliable for determining characteristics of dominant fractures or fracture zones.
Even with these drawbacks, cores provide useful direct evidence of the hydraulic and geological properties of fractures and host rocks. The use of core is most effective when it is related to geophysical well logs from the borehole. Core analysis can be used to relate geophysical measurements of the rock to geochemical and hydraulic properties of more intrinsic interest. The geophysical measurements can then be used to determine fracture properties in intervals where core is missing. The combined analysis of core and geophysical logs provides information on fractures that is not available when the techniques are applied separately.
Conventional Well Logs
Conventional measurements or logs made in boreholes, quasi-continuously over extended intervals, are a tried and proven way for determining the properties of the rocks adjacent to the wellbore. As a general class of measurements, well logs have both specific advantages and significant drawbacks. The unique advantages of well logs are (1) they provide a consistent one-dimensional profile of rock properties expressed in terms of a consistent length scale, (2) they provide measurements of rock properties in situ, and (3) they provide multiple independent measurements of rock properties that can be used to solve for multiple independent variables. The disadvantages of well logs are (1) they measure properties that may not be of direct interest and that are not uniquely related to the properties that are of direct interest; (2) they represent measurements on rocks that are disturbed by drilling; (3) they may average rock properties with those of the borehole fluid; and (4) they have a directional bias because they sample along the direction of the wellbore rather than in three dimensions.
The advantages of logging can be illustrated with a few common examples:
-
A limited number of laboratory test data on discrete samples can be correlated with geophysical log measurements at specific depths; the rest of the logs then show how the lab data might be extrapolated between sample points.
-
Core samples are subject to damage during recovery and desiccation after recovery, so a comparison between core results and logs can be used to infer the extent and nature of possible damage during drilling and recovery.
-
In many surface geophysical soundings, a single geophysical property (e.g., electrical resistivity) is mapped over a depth section. When such a property depends on more than one variable (e.g., electrical resistivity depends on water
-
salinity, pore size, and clay mineral fraction), multiple geophysical logs can be used to identify methods for uncoupling these dependencies.
These examples illustrate the advantages of well logging as a general investigation technique giving fine-scale (sample volumes ranging from 10 cm to 10 m in diameter) descriptions of the properties of rocks and sediments encountered by boreholes.
Geophysical logging has been applied to fracture identification and characterization for many years (Keys, 1979). The identification of fractures by most conventional logs is complicated by the borehole itself and the fluids it contains (Figure 4.12). Most geophysical logs are designed to resolve beds thicker than about 10 cm; they have great difficulty in clearly defining the properties of thinner
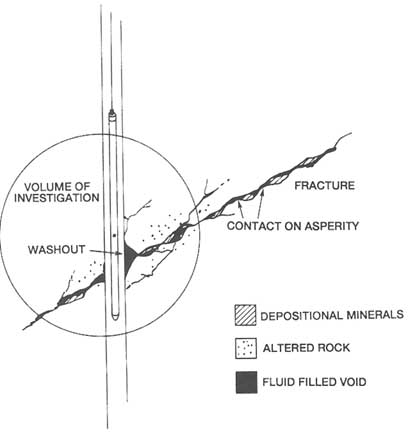
FIGURE 4.12 Schematic example of natural fractures intersecting a borehole and the geophysical volume of investigation.
beds, whose properties are averaged with those of surrounding beds. In this context, individual fractures such as those illustrated in Figure 4.12 might be considered "thin beds," with thicknesses usually less than a few centimeters for most individual fractures. If fracture zones are present or if concentrations of subparallel fractures are associated with faults and geological contacts, the thickness may be great enough that the average property of the zone will be indicated by the geophysical measurement. Even then, the properties of fractures will be averaged with those of the intervening rock and borehole fluids.
There are practical approaches to fracture analysis using conventional geophysical logs that are almost always based on physical effects indirectly related to fractures. The model of a typical fracture illustrated in Figure 4.12 was generated by breaking the rock fabric along grain boundaries, imposing some slippage along the face, and then allowing recontact of the two rock faces at asperities. Subsequent movement of fluids through the voids between asperities allows for alteration of rock around the fracture and deposition of minerals in some of the openings. The geophysical response to fractures indicated in most conventional well logs is associated with these alteration halos and with the mechanical enlargement of the borehole at the point where the fracture intersects the borehole wall. These are indirect effects, and their magnitudes may be related in a qualitative way to the "size" of the fracture. However, precise relationships between numbers, spacings, and apertures of fractures are almost impossible to define on the basis of these measurements. Appendix 4.B discusses the typical response of several conventional logs to fractures.
One of the recognized drawbacks in geophysical logging of fractured rocks is the effect of sample volumes on resolution. Because most conventional geophysical logging measurements average the properties of rocks over equant volumes about 0.3 m in diameter, these measurements are relatively insensitive to the presence of individual fractures. One class of logging tools, known collectively as micrologging devices, has been designed to improve vertical resolution for the detection of thin beds and fractures. These logging tools are modified versions of conventional neutron, gamma density, and electrical resistivity devices, with closely spaced sources and receivers or closely spaced electrodes embedded in pads that are pressed against the borehole wall. The short source-to-detector or electrode spacings are associated with sampling volumes only a few centimeters in diameter. These logging probes are used extensively in the coal industry, for example, where accurate measurements of the tops and bottoms of coal-bearing strata are of great economic importance. Microelectrical resistivity probes are also used extensively in the petroleum industry to estimate the properties of "mudcake" (a layer of drilling mud at the borehole wall) and the invaded zone immediately behind the mudcake. The sensitivity of microneutron and microdensity logs to borehole wall roughness caused by mechanical damage during drilling (known as rugosity in the logging industry) severely limits their use in some applications. Microresistivity logs have been useful in identifying fractures and
fracture zones in boreholes, but these devices have been largely superseded by more sophisticated microresistivity tools, especially the formation microscanner, which is capable of producing images of the borehole wall. The formation microscanner is described in the next section, along with other borehole wall imaging devices.
Other types of logs can sometimes be used to provide information about water movement related to fractures. For example, temperature logs measure temperature in the well as a function of depth. When borehole temperatures are at equilibrium with the local wall rocks, the temperature log accurately reflects the local formation temperature. When water is circulating along the wellbore, departures from the geothermal gradient indicate where water is entering or existing from the borehole. Fluid conductivity logs provide similar information because changes in fluid conductivity may indicate where entry or exit of water induces sharp contrasts in dissolved solids contents.
Natural circulation of water in boreholes is almost always too slow to be measured with conventional impeller flowmeters, which require vertical velocities of at least a few feet per second in order to turn the most sensitive impeller blades (Hess, 1986). However, measurable flows can be induced by pumping, if the pumping does not dewater the wellbore. Conventional flowmeter measurements during pumping can sometimes be an effective means of identifying conductive fractures that intersect the borehole (Keys and Sullivan, 1979). Temperature and fluid conductivity logs obtained during production or injection may likewise be effective methods for identifying the depths at which producing fractures intersect boreholes (Keys, 1979; Keys and Brown, 1985).
One specialized application for geophysical well logs is geothermal reservoir characterization. Most geothermal reservoirs produce hot water from fractures, but the elevated temperatures and high mineral contents of geothermal waters result in an intense interaction between fractures and water during drilling and well regulation. High temperatures, the presence of water and steam, and corrosive fluids affect the performance of logging equipment. Hostile borehole conditions also degrade the wall rock, making it more difficult to characterize fractures using geophysical logging methods. The general approach used in log analysis for geothermal applications is similar to that outlined previously for more general fracture studies. However, the difficult borehole environment greatly complicates data interpretation.
Logging equipment must be designed to withstand the elevated temperatures and pressures typically encountered in geothermal wells. Conventional logging cables cannot be used at temperatures above 150°C, and the most advanced geothermal logging cables are limited to temperatures below about 300°C. Electronic components and circuits are built to fit into specially designed dewar flasks. The presence of both steam and water limits the performance of some equipment. The high pressures encountered in geothermal reservoirs require that logs be obtained by running the logging cable through pressure control devices or "lubri-
cators," which greatly complicates the operational aspects of logging. Examples of the application of fracture characterization methods to well logging in geothermal studies are given by Keys and Sullivan (1979) and Paillet and Morin (1988).
Borehole Imaging Logs
One of the most direct and effective methods for detecting fractures in boreholes is borehole wall imaging. Many devices based on optical, acoustic, or electrical techniques have been designed to provide photographs or other images of the borehole wall, so the intersection of fractures with the borehole can be "seen" and described (Paillet et al., 1990). Optical devices include photoelectric transformers, conventional cameras operated remotely from a wireline and television cameras operated remotely using coaxial cable. These cameras are used extensively in shallow water wells and other near-surface applications for a variety of borehole and casing inspection tasks.
Fracture detection applications are sometimes limited because cameras require clear borehole fluids, and they commonly image the borehole at oblique angles using local illumination sources that produce shadows, which interfere with fracture detection and interpretation (Paillet et al., 1990). Furthermore, the data are not in digital form initially, and so are not amenable to sophisticated processing. However, under the right conditions, these logs can produce striking images of fractures.
The digital borehole scanner (DBS) is a new logging tool that provides optical, true-color images of a borehole wall (Figure 4.13). The digitally recorded data yields very high resolution images, enabling detailed measurement of fractures, identification of fracture mineralization, and observation of other microscale properties not generally available with other instruments (Cohen, 1996). The primary components of the DBS system are the white light source, rotating mirror, magnetic compass or gyroscope, and photoelectric transformer. The mirror rotates at 3,000 rpm, simultaneously illuminating the borehole wall and directing the reflected light through a lens and into a photoelectric transformer. The transformer measures the intensity of the red, blue, and green light wavelengths and converts them to digital form. The data stream passes through an azimuth and a depth gauge and the data is stored on digital tape. A scrolling, unrolled image of the borehole wall is stored and simultaneously recorded on videotape.
Since the tool records high-resolution color images, mineral-filled fractures, open fractures, zones of discoloration due to rock alteration by fluids, and even gouged and altered zones can be detected. Fracture features are easier to detect in lighter color rocks such as granites and gneisses than in darker colored rocks such as shale. The maximum vertical resolution of the DBS instrument is 0.001 mm, and the horizontal resolution depends on the diameter of the borehole. For a 17 cm well, the resolution can be 0.5 mm. In general, the DBS can provide borehole images with resolutions comparable to photographs of core.
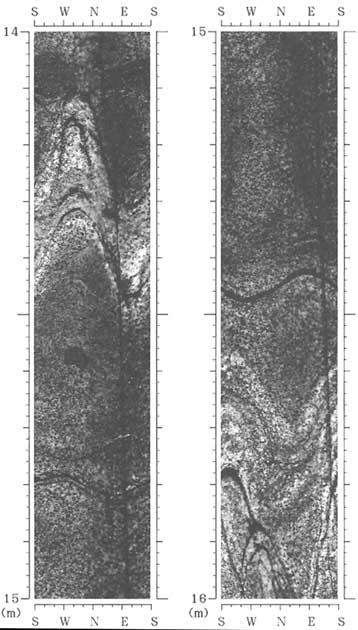
Television cameras require coaxial cable rather than conventional wireline. For these reasons, acoustic and electrical imaging methods are the most frequently used techniques to investigate the distribution of fractures and properties of fractured rocks in boreholes more than 50 m in depth.
The first acoustic imaging method consistently used in fracture characterization was the borehole televiewer (BHTV; Zemanek et al., 1970). The modern BHTV uses an ultrasonic beam with centerband frequency of 500 KHz to 1.5 MHz and a beam diameter of 0.5 to 1.0 cm. The BHTV operates by scanning the borehole wall at a rate of about three revolutions per second while the probe is steadily drawn along the borehole. The transducer is fired at a rapid rate and serves as both the source of the acoustic pulse and the receiver for the reflected signal. In the earliest version of this instrument the borehole image was recorded in the form of a photographic display of the intensity of reflection (Figure 4.14a). The BHTV image is oriented with respect to the local magnetic field by a downhole magnetometer. The image is split along the apparent north azimuth and "unwrapped" for display.
The intersection of the fracture with the borehole wall scatters acoustic energy, producing dark sinusoidal features on the image. The image allows the geophysicist to interpret the strike and dip of fractures, although deviation surveys are required to determine the local orientation of the borehole, so that measured orientations can be corrected for borehole orientation and for deviation between local magnetic field and true north (Kierstein, 1983; Lau, 1983). The apparent thickness of the linear feature identified on the BHTV log may be taken as a qualitative indicator of fracture "size" or aperture. However, this thickness depends on both the actual fracture aperture and the beam width and represents the fracture where it has been affected by drilling. For these reasons the interpretation of fractures using BHTV logs is at best semiquantitative.
Figure 4.14c shows a BHTV log from a granite batholith where a smooth core-hole wall provides optimum conditions for imaging. This BHTV log is compared with a synthetic televiewer image constructed by using fracture descriptions given from inspection of oriented core of the same interval. The comparison shows that on the BHTV log most of the open fractures are clearly "larger" than closed fractures. However, some of the closed fractures appear to be as large as the open ones, especially the uppermost set of parallel closed fractures. The crumbling of the layers of rock between these sealed fractures (a process known as spalling) has probably resulted in local enlargement of the fractures at the borehole wall. These fractures appear to be open fractures, comparable in size on the BHTV log to those identified by core inspection as truly open and conductive.
A second example (Figure 4.14b) illustrates that BHTV data can sometimes provide a more representative depiction of fractures than core. In the figure, core photographs are compared to BHTV logs for a borehole in granite (Paillet et al., 1985). The BHTV log indicates a single, large, near-vertical fracture, with faint indications of near-horizontal fractures close to the bottom of the larger fracture.
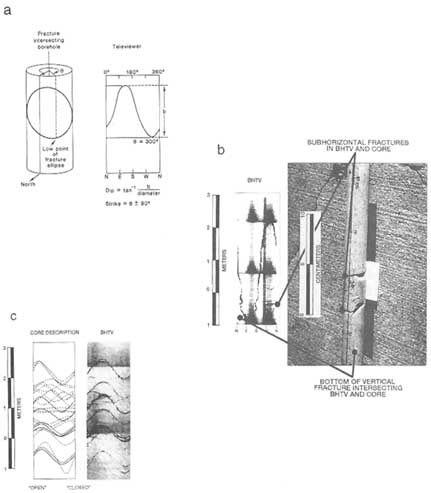
FIGURE 4.14 Acoustic borehole televiewer (BHTV) logs: (a) Schematic illustration of fracture representation by a BHTV image of the borehole wall. (b) Compression of BHTV log from a granite pluton in Manitoba, Canada, with the corresponding interval of core, indicating that apparently open horizontal fractures in core were closed in situ. (c) Example of BHTV log on right compared with core fracture description for oriented core in the same granite pluton, where closed fractures (sealed by minerals in core) are shown by dotted lines and open fractures are shown by solid lines. From Paillet et al. (1985).
The core has separated on two of the horizontal fractures, and the near-vertical fracture is barely visible as a tight fracture in the intact core. The subhorizontal fractures were nearly closed under confining pressure in situ as indicated by the BHTV log, but opened during core recovery. Although fractures shown in BHTV
logs are commonly affected by drilling damage, at least they are shown under in situ stress conditions as modified by the presence of the borehole. This is especially important in intensely fractured intervals where core is not recovered or comes out of the core barrel as rubble.
BHTV has been a reliable and tested means of borehole imaging in fracture studies for nearly two decades. In recent years the conventional approach in BHTV logging of photographing and displaying an image of the intensity of ultrasonic reflections with an oscilloscope has been modified in a number of useful ways (Paillet et al., 1990; Maki et al., 1991). An important variant is the recording of reflection time, rather than amplitude, thus giving the distance to the reflector (often referred to as an ''acoustic caliper"). Further, the BHTV signal is now routinely recorded on conventional video recorder systems in the field and digitized in the laboratory. A few BHTV prototype probes now digitize reflection intensity and two-way travel time directly for each source pulse and store them on magnetic disks. Various image enhancement techniques have been used in conjunction with PC graphics packages to produce a wide variety of useful displays (Barton et al., 1991; Barton and Zoback, 1994). As an example, Figure 4.15 shows a three-dimensional side view of a borehole surface; the software allows for rotation of images and indexing along the borehole axis. The
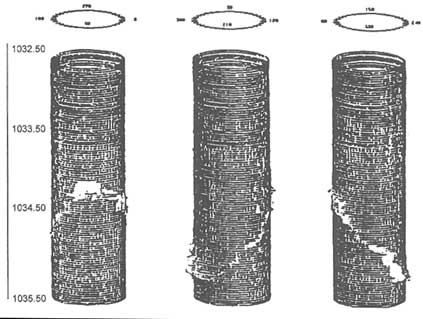
FIGURE 4.15 Example of three-dimensional side view of borehole-fracture intersection generated by digital processing of BHTV data. From Barton (1988).
advantage of such a display is the ability to represent the fracture/borehole intersection in three dimensions, without the severe vertical-scale compression of conventional BHTV displays. Reduced-scale versions of BHTV logs can be directly depth correlated with other geophysical logs; this reduction in scale is a useful advance made possible by the digitization of the BHTV signal.
There have been recent important improvements in televiewer logging transducers. The most significant of these improvements is the ability to focus the acoustic source beam and to optimize the degree of focus for specific borehole conditions (Paillet et al., 1990; Maki et al., 1991). The focused acoustic beam is achieved by fabricating the source transducer with a concave surface. The degree of concavity determines the amount of beam focus and the radial interval over which focus is achieved. In the most advanced BHTV-like systems, the transducer is formed by a series of concentric piezoelectric transducers that can be fired in a sequence to produce optimum focusing for a given local borehole diameter and fluid impedance.
Although acoustic imaging systems have been the most frequently used method for identifying fractures in situ, electrical imaging systems have become available in recent years. The first commercially available version of this system was known as the formation microscanner or FMS (Dennis et al., 1987; Ekstrom et al., 1987; Bourke, 1989; Paillet et al., 1990). The FMS system is an outgrowth of the conventional dipmeter, where the four electrical pads of the dipmeter have been enlarged to include many more individual electrodes. The electrical response of the four pads is processed to produce four vertical "strips" showing the detailed pattern of electrical resistivity of the formation. FMS data provide a visual indication of fine sedimentary structure as well as fractures. A typical FMS image of fractures is illustrated in Figure 4.16. The images in this figure show that FMS systems can provide an effective display of fractures in comparison to the BHTV. The latest applications of FMS use independent measurements of fluid conductivity to relate the measured electrical anomaly associated with the fracture to fracture aperture (Hornby et al., 1992).
Probably one of the most important limitations of this system in fracture studies is the incomplete azimuthal coverage of the wellbore provided by the FMS image. This can make it difficult to determine fracture strike and dip in some situations. This limitation is offset by the much greater operational simplicity of FMS logs. Both television and televiewer logs are run at very slow speeds, and both are affected by borehole fluids. The opacity of borehole fluid is frequently a problem with remote optical image (television) logging, and viscous drilling mud can severely degrade televiewer log performance (Paillet and Goldberg, 1991). In contrast, the FMS log can be run at typical logging speeds and under typical logging conditions, and the FMS logging sonde is not affected by the many operational delays typically associated with the much more electromechanically sensitive optical and acoustic imaging devices.
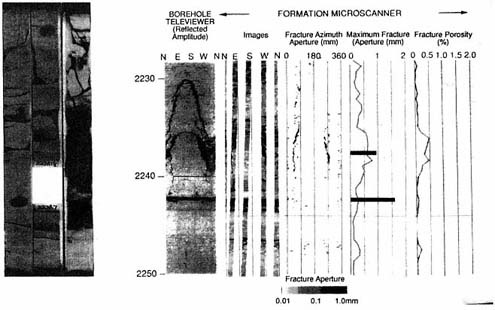
FIGURE 4.16 Comparison of fractures in a sandstone formation as indicated on (left) core samples, (center) BHTV log, and (right) FMS log. From Hornby et al. (1992).
Until recently, acoustic and electric borehole imaging devices have been extensively used in fracture studies despite the much greater potential spatial resolution of optical imaging devices. As noted previously, there are practical problems with optical imaging, such as opacity of drilling fluids, shadows cast from light sources, and lack of digital data or processing. Most of these problems appear to have been solved with at least one of the latest optical borehole imaging systems (Kamewada and Hu, 1990). This downhole digital optical imaging system provides digital image data with reliable color at a spatial resolution significantly better than that available from acoustic or electrical imaging systems such as the FMS and BHTV. This system functions in boreholes filled with clear fluid or air, and the digitized image data can be processed by state-of-the-art image enhancement software, such as that described by Paillet et al. (1990). An example of the image obtained with this new device is illustrated in Figure 4.17. This system appears to have all of the advantages described for televiewer and FMS logging systems coupled with a significantly improved spatial resolution. In addition, the system provides true color images suitable for description of lithology and identification of alteration halos and mineral staining adjacent to fractures.
Acoustic Waveform Logging Methods
Acoustic waveform logs (AWFLs) are obtained by recording the complete pressure signal at an array of receivers located some distance along the borehole
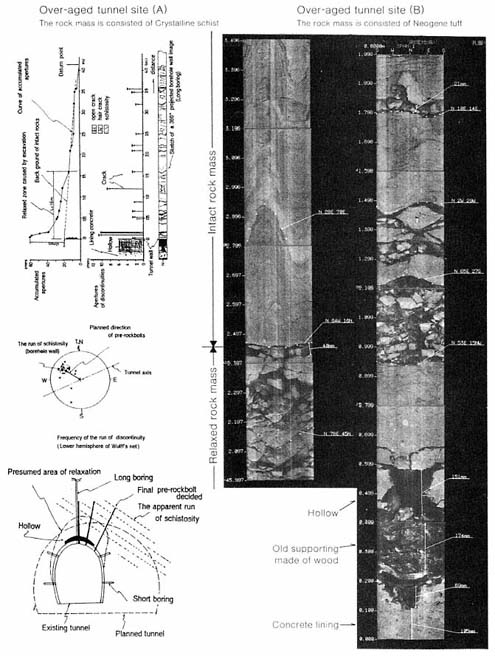
FIGURE 4.17 Example of digitally processed, downhole television data obtained in fractured bedrock. From Kamewada and Hu (1990).
axis from a conventional transducer. Early attempts to develop this method applied established seismic data processing techniques in a scaled-down version of conventional acoustic refraction and reflection methods (Christensen, 1964). In well-consolidated rocks, such techniques can identify both P waves and S waves in
the wavetrain. However, little success was achieved in evaluating the properties of fractures previously identified on BHTV (or other imaging) logs until the approach was modified (Paillet, 1980, 1985a,b; Figure 4.18).
In analyzing AWFL data it must be remembered that the fractures may be large compared to the wavelength. The waves may therefore scatter from the fractures, rather than propagate through them as through an effective medium.
Examples of AWFL data for typical fractures are given in Figure 4.19. For nearly horizontal fractures, all of the wave modes comprising the composite waveform are attenuated, because all waves must travel across the fracture between source and receiver. The example shown in Figure 4.19a illustrates the variation of shear-wave amplitudes, plotted as the mean square amplitude of acoustic energy in a window centered on the shear arrival. The same display shows the amplitude of the Stoneley or tube wave, a guided wave mode confined
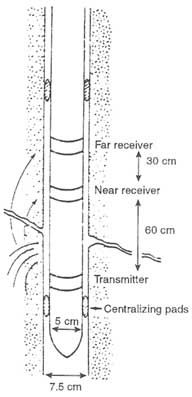
FIGURE 4.18 Schematic illustration of acoustic waveform logging as a scaled-down refraction study of fractures and adjacent rock. The technique records the changes in the refracted acoustic waveforms caused by propagation across permeable fractures. From Paillet (1980).
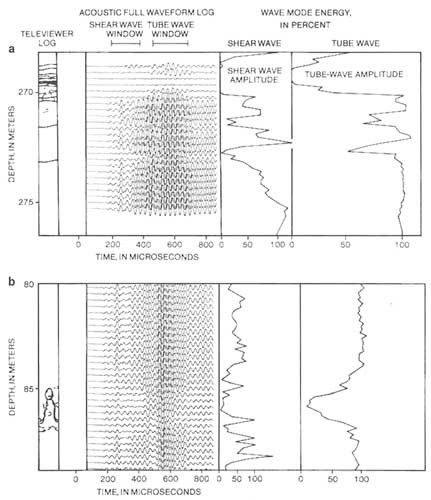
FIGURE 4.19 Examples of AWFL data for (a) nearly horizontal fracture zone and (b) nearly vertical fracture. Both data sets are from small-diameter coreholes in granite. From Paillet (1993).
mostly to the fluid column, which is known to be sensitive to borehole wall permeability (Rosenbaum, 1974; Paillet, 1983, 1991c; Burns, 1990). The second example (Figure 4.19b) illustrates AWFL data for a near-vertical fracture, where there is some azimuth of the borehole wall where acoustic waves can propagate through unfractured rock, no matter where the logging tool is positioned. Such a condition occurs whenever the distance over which the fracture intersects the borehole exceeds the source-to-receiver distance of the logging tool. In Figure 4.19b
the shear-wave amplitude does not show a simple anomaly that correlates with the fracture very well, but the tube-wave amplitude remains surprisingly consistent in correlation with the fracture. Experiment and theory indicate that tube-wave amplitude can be related to the fluid conductivity of fractures. For example, Paillet (1983, 1991b) shows that the interval-integrated tube-wave amplitude deficit (the shaded area indicated in Figure 4.19b) correlates with independent measurements of fracture-fluid conductance.
Attempts to construct a rigorous theory relating fracture properties to tube-wave amplitude and velocity have not been as successful. Early plane-fracture models indicate that tube waves are reflected but not attenuated by fractures having effective hydraulic apertures, such as those illustrated in Figure 4.19b. In contrast, the data show that there is significant attenuation without measurable reflections. Multifrequency experiments further confirm that reflections are absent at typical acoustic logging frequencies (10 to 30 kHz) and only become important at frequencies below 5 kHz (Paillet, 1984). At these lower frequencies, the intensity of tube-wave reflections is a better indicator of fracture permeability than attenuation (Hornby et al., 1989, 1992). Furthermore, the lower frequencies are associated with longer acoustic wavelengths, which produce a larger effective volume of investigation, thus making the method suitable for larger, more transmissive fractures. In this sense the two methods complement each other: the high-frequency amplitude methods can be used for fine-scale fractures, and the lower-frequency reflection method is appropriate for larger fracture zones.
The discrepancy between theory and experiment has only recently been resolved (Paillet et al., 1989a) by considering more complex fracture models that account for the heterogeneity and contacts along asperities of real fractures. An example of a model for a set of AWFL data in the crossover frequency range (where both amplitude and reflection methods apply) is illustrated in Figure 4.20.
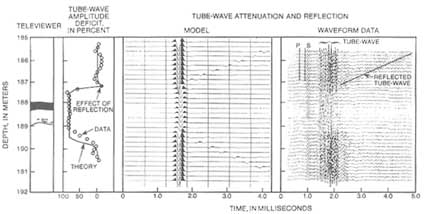
FIGURE 4.20 Comparison of AWFL data obtained by using a 5-kHz source in granite with synthetic seismograms computed for tube-wave propagation. From Paillet (1993).
There is a good agreement between the dynamic wave propagation models and AWFL data (Tang and Cheng, 1989). It is also important to note that comparison of these results to permeability measured at near steady state using conventional straddle packer and injection tests must include a complex hydraulic impedance factor related to the dynamic version of Darcy's law that applies to flow at acoustic frequencies (1 to 30 kHz).
A new generation of shear-wave logging tools is under development. These tools utilize two orthogonal (in the horizontal plane) dipole sources and receivers, so that the multisource/multireceiver analysis of split shear waves at the surface (see "S Waves," earlier in this chapter) and in the VSP context (see "Vertical Seismic Profiling," earlier in this chapter) may be utilized to detect fractures in the borehole. In the past two years, such "crossed-dipole" tools have been marketed worldwide by several service providers.
High-Resolution Flowmeter Methods
The availability of borehole imaging methods for fracture identification and other geophysical logs for fracture characterization provides effective methods for describing fractures that intersect exploratory boreholes. However, this near-borehole data does not provide useful information about connections between fractures and the larger-scale groundwater flow systems. Established techniques to locate flow systems are based on geochemical analyses of groundwater samples, tracer studies, and radar and seismic tomography. However, recently developed logging techniques that utilize high-resolution flowmeters provide the capability to investigate how the population of fractures intersected by a borehole is related to flow paths in the surrounding rock. A number of different flowmeters are being developed, including heat pulse (Hess, 1986; Hess and Paillet, 1990), electromagnetic (Molz and Young, 1993), acoustic-doppler (Almén and Zellman, 1991), and laser-doppler systems (Momii et al., 1993). These systems are just now becoming available for routine use in geotechnical studies.
The application of high-resolution flowmeters to fracture characterization can be illustrated by the performance of the heat pulse flowmeter, which works by measuring the time required for heat, which is produced by a short current pulse on a wire screen placed across the flow, to be convected 2 cm up or down the borehole (Figure 4.21). The latest version of this system increases sensitivity by means of an inflatable packer, which is designed to block the annulus around the measurement section of the tool, thereby forcing all of the flow to pass through the measurement section. Tool response is calibrated in the laboratory by relating the inverse of pulse travel time in inverse seconds to borehole discharge in liters per minute. Calibration studies demonstrate that the heat pulse flowmeter can resolve flows as small as 0.01 liters per minute.
Two case studies of high-resolution flow logging (see Appendix 4.C) discuss potential applications of these newly developed flow measurement techniques.
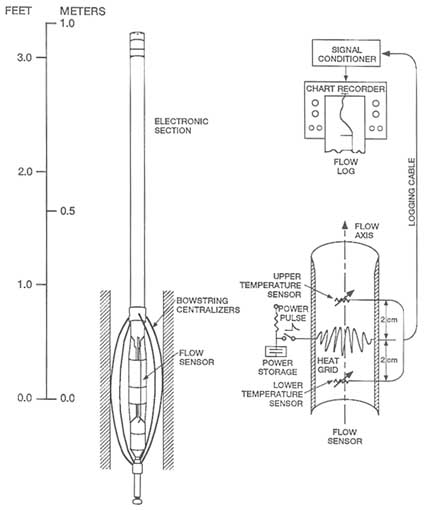
FIGURE 4.21 Schematic illustration of the operating principles and probe configuration for the heat pulse flowmeter. From Hess and Paillet (1990).
These methods seem especially useful in bridging the gap between small-scale measurements of conventional well logging and intermediate-scale measurement techniques such as straddle packer tests and borehole-to-borehole sounding.
Fluid replacement logging is a recently developed technique for the identification of permeable fractures that intersect the borehole (Tsang et al., 1990). The method provides estimates of electrical conductivity and the pH of fluids entering the borehole, as well as the depths and relative permeabilities of fractures
or fracture zones. The technique involves replacement of the fluid column in the borehole with deionized water and measurement of electrical conductivity of the fluid column over time as formation waters enter the borehole. The analysis assumes a diffusion process to infer both inflow rates and the electrical resistivity of the inflowing water.
Fluid replacement logs are compared to other geophysical logs for a borehole in fractured granitic rocks in Figure 4.22. The flowmeter and fluid replacement data show where water is entering the borehole during production. The fluid replacement log data provide a slightly better resolution than the high-resolution flowmeter analysis. Although fluid replacement logging is somewhat more time consuming and cumbersome than flowmeter logging, both techniques are effective in identifying the fracture zones associated with inflow to this borehole.
FLUID FLOW MONITORING USING GEOPHYSICAL METHODS
The best way to detect and characterize the actual flow of fluid in fractures is through differential measurements—that is, measurements before, during, and after the application of a known perturbation of the fluid system. For example, Wills et al. (1992) detected acoustic emissions and tiltmeter strains during a hydrofrac treatment, which indicated that the main fracture was surrounded by a large process zone (an area of inelastic deformation, suggesting the existence of seismic activity). They also performed simple cross-well tomography, detecting the fracture zone as a "shear-wave shadow zone" through which shear waves
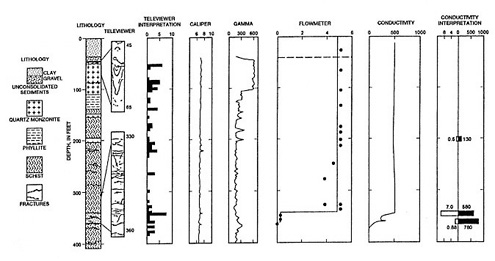
FIGURE 4.22 Example of fluid replacement logging in a borehole in fractured granite rocks in southeastern New Hampshire. Most of the geophysical logs are explained in previous sections of this chapter. The BHT data have been analyzed by assigning a size score to each fracture on a scale of one to five and then summing the total scores in depth intervals. From Vernon et al. (1993).
did not propagate. They detected fracture closing as inflections in the pressure decline curve (following classical arguments) and correlated these with changes in the seismic measurements.
The dependence of bulk electric properties on pore fluids allows monitoring of fluid flow by electrical or electromagnetic methods. Normally, it is difficult to distinguish between permeable and impermeable fractures through electrical methods because their electrical properties are similar, especially when the impermeable fractures are filled with gouge, clay minerals, or other alteration products.
Remote sensing methods normally provide very little information concerning large-scale hydraulic connections in fractured systems. However, changes in the conductivities of pore fluids may be measured by using electric or electromagnetic methods. In general, measurements are collected at several times, and changes are assumed to be due to differences in physical properties of the pore fluid or to changes in fracture geometry. Changes in pore fluid conductivity can be caused deliberately by injection of brine solutions during tracer experiments or inadvertently by leachates from landfills (contaminants may be more conductive than natural groundwater) or from mining operations. Hence, these methods can be used to measure the distribution of flow in fractured systems and to monitor confinement systems.
Electrical methods are usually applied by installing an electrode array in the area to be investigated (e.g., downstream from a landfill). The electrical resistances between pairs of electrodes are monitored during an appropriate time period. The geometrical distribution of resistivity changes will indicate if, when, and where changes in groundwater conductivity have occurred. In most cases, arrays are set up to monitor the lateral spread of contaminants (e.g., Van et al., 1991), but information on the vertical distribution also can be obtained by using sounding techniques (described in ''Seismic Reflection," earlier in this chapter).
Electromagnetic methods (e.g., Tangential Electric Mode, Slingram; see Figure 4.4) also have been used for monitoring purposes. Profiles across the survey are normally remeasured at regular intervals, and the observed changes are interpreted in terms of contaminant locations (Hanson et al., 1991). Induction logging is also a useful technique for monitoring conductive plumes if boreholes are available (McNeil, 1990).
The limited resolution of electrical and electromagnetic methods also applies when they are used for monitoring purposes. A possible source of error when these methods are used for shallow monitoring of groundwater flow is a change in saturation owing to variations in precipitation or to freezing. These changes can cause annual variations in resistivity that must be removed from the data.
Tomographic techniques have higher resolutions than electric or electromagnetic methods. The basic principle is to produce a reference tomogram before injection of a conductive tracer into the fracture system. Tomographic measurements are then repeated at regular intervals to get "snapshots" of the distribution
of the tracer. Increases in radar attenuation can be attributed to the presence of saline tracer and allow the tracer mass to be estimated (Olsson et al., 1991).
There are a number of examples where repeated borehole radar tomography has been used to map the transport of a brine tracer in fractured granite. Figure 4.23 shows the difference tomogram obtained after continuous injection of saline tracer into a fracture zone. The tracer can be seen to follow the fracture zone from the injection point to the adjacent boreholes, which act as drains. The
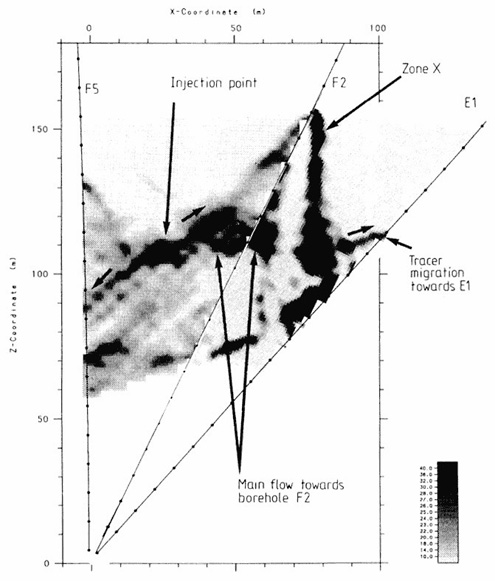
FIGURE 4.23 Increase in radar attenuation (dark regions) owing to injection of saline tracer (0.5 percent NaCl) into a fracture zone. From Andersson et al. (1989).
irregular distribution of tracer in the fracture zone is clearly demonstrated. Several intersecting tomograms were obtained at the same site. They were internally consistent and in agreement with the observed tracer inflows to the draining boreholes.
These tomography methods are especially significant for studies of flow in fractures. Almost all geophysical tomograms disclose distributions of physical properties that are only indirectly related to flow. For example, radar tomograms of fractured crystalline rocks show the distribution of alteration clays and other electrically conductive minerals. These patterns of anomalous radar transmission are likely to be indirectly related to the three-dimensional distribution of fractures, but they do not provide direct evidence of fluid flow. However, repeated borehole tomograms obtained before and during brine injection do provide unambiguous direct evidence of the three-dimensional distribution of flow. This distinction makes the brine injection studies (e.g., Olsson et al., 1992) more significant for flow system identification than other seismic, electric, and radar tomography studies given in the literature.
Radar difference tomography also has been used to map the spreading of grout in dams (Andersson et al., 1991) and to monitor the progress of the flame front in oil shale retorting (Daily, 1984). This technique has also been used to monitor the progression of flood fronts in thermal-enhanced oil recovery (Justice et al., 1989). Difference tomography has been used to map the location of new fractures induced by blasting (Cumerlato et al., 1991). In principle, any operation that alters the compressibility of the fracture-filling fluid (e.g., by changing the saturation state) should be detectable by difference tomography.
DISCUSSION
The preceding sections have discussed a broad array of fracture detection methods. These methods are summarized in Table 4.1. The following methods are particularly useful at various detection distances:
-
for detection at great distances, seismic methods based on split shear waves;
-
for detection at moderate distances, the directional borehole methods;
-
for detection in the borehole, the televiewer, FMS, and scanner methods; and
-
for characterization of the actual flow associated with fracture systems, the high-resolution flowmeter methods and radar difference tomography.
The objectives of most studies are to both detect and characterize fractures. The properties of interest include the physical characteristics of the fractures (e.g., orientation, size, shape, fluid and mineral content), and hydraulic properties (e.g., permeability and its variability with pressure).
With any of the geophysical detection methods, raw data (e.g., voltages from a measuring instrument) are acquired and processed into a form suitable for inversion to estimate physical properties of the rock mass (e.g., seismic velocity). This inversion may be computationally intensive and may rely on oversimplified theories. Nevertheless, there is broad consensus on the validity of these methods, and their resolution and uniqueness are well understood.
In contrast, the inference of fracture parameters (e.g., fracture size) from these physical properties is open to considerably greater debate. (The term inference is used rather than inversion to emphasize a lesser degree of reliability.) In most cases the theory that guides this inference involves strong assumptions about the properties of the fracture (e.g., that it has the shape of a prolate ellipsoid) that are not readily defensible. Further, these fracture parameters tend to be lumped parameters (e.g., the nondimensional fracture density as given by Eq. 4.1) rather than a single fracture characteristic. This inference, even if correct, still retains significant uncertainty with respect to fluid flow. For this reason, multiple studies using different methods that produce different lumped parameters are clearly useful for constraining fracture properties.
Finally, few detection methods allow direct interpretation of these inferred fracture characteristics in terms of fracture flow. (An interpretation is less scientifically based and less reliable than either an inference or an inversion.) Perhaps the best exceptions to this generalization are methods that track differences over time (e.g., see preceding section on radar tomography). Changes in tomographic images over time in response to induced changes in flow provide convincing evidence that these images can be used to characterize flow through fracture systems.
Given the breadth of methodologies evident in Table 4.1, it might seem unnecessary to look for new methods of acquisition, processing, and inversion. However, major new methods have recently been developed (e.g., split shear waves that do not rely on oversimplified theories. Additionally, advancements in technology continue to allow for significant refinements to older methods (e.g., the borehole imaging devices).
By contrast, progress is clearly needed in the inference process in order to obtain better estimates of fracture properties. In particular, the deduction process should rely less heavily on unsupportable assumptions. This may require the use of more data (e.g., the entire signal, not just the first breaks, for seismic data) or better experiments (e.g., broader-band sources, downhole sources) in the deduction process.
Finally, there is the need to better learn how to interpret the hydraulic properties of direct interest from the inferred fracture parameters. The best hope for improvement lies in the application of multiple methods in the inference step, repeated over time as the fracture system responds to a known stimulus. The numerical modeling methods discussed in Chapter 6 have an important role to play in this effort.
APPENDIX 4.A
DIRECTIONAL BOREHOLE RADAR SYSTEM
IN a reflection measurement with a directional borehole radar system (Sandberg et al., 1991), the transmitter and receiver are kept at a fixed separation while lowered together into the borehole. Measurements are normally made at 0.5-m depth intervals to avoid spatial aliasing. A measurement along a single borehole produces three independent radar images (one dipole image and two orthogonal directional component images) that must be combined in order to find the orientation of the reflectors.
In practice, inversion of directional radar data is made by using an interactive program. The program calculates the radar reflection maps for the dipole and the directional signal for every 10 degrees of azimuth. Reflectors are marked in the radar maps, and models corresponding to plane or point reflectors are adjusted to fit each observed reflector (Figure 4.A1, left). The depth of intersection and the angle between the borehole and the reflector are displayed automatically. Then the azimuth is changed until the minimum directional signal is found for a particular reflector (Figure 4.A1, right). There are two minima, and the correct azimuth is determined by comparing the phase of the directional signal at maxi-
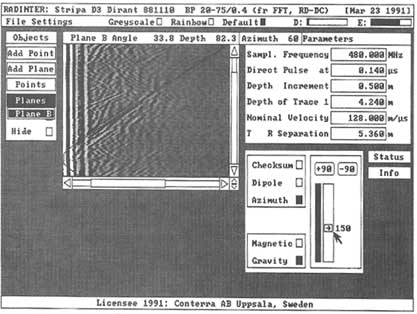
FIGURE 4.A1 Screen display of a commercially available software product for interactive interpretation of directional radar data. Reproduced with permission of MALÅ GeoSciences, Malå, Sweden.
mum signal strength with the phase of the dipole signal. The dip and strike of the fracture plane can be calculated if the orientation of the borehole is known. The azimuth can normally be determined with an accuracy of ±5° for data with good signal-to-noise ratio. For weak reflectors in a noisy environment, it may not be possible to find the azimuth with that accuracy.
During a reflection measurement in a borehole, the reflection point traces a line on the fracture plane (see Figure 4.18). It is along this line that the existence and orientation of the fracture plane are actually known. The reflectors detected can then be plotted (e.g., with a 3-D computer-aided design system) at the locations in space where the reflections actually occurred. In this way, 3-D visualization of actual fracture locations makes it possible to construct models of the fracture pattern recognizing the information actually available. Figure 4.A2 illustrates reflectors observed from different boreholes at the SCV (Site Characterization and Validation) site at the Stripa project's mine (see Chapter 8) and the assignment of reflectors to different fracture zones.
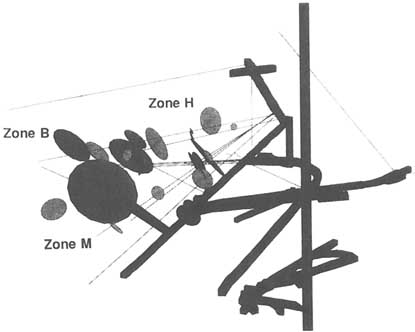
FIGURE 4.A2 Distribution in space of radar reflections derived from single-borehole directional radar data at the Site Characterization and Verification (SCV) site at the Stripa Project's mine. Different shades indicate reflectors interpreted as belonging to different fracture zones. From Olsson (1992).
APPENDIX 4.B
SUMMARY OF CONVENTIONAL LOG APPLICATIONS IN FRACTURE STUDIES
Geophysical well logs can be used to determine the physical properties of rocks encountered by boreholes, whether or not cores and other sample data have been recovered during drilling. Figure 4.B1 gives a summary of the applications of conventional well logs to fractures as described by Keys (1979) and Paillet (1993). The figure gives a schematic illustration of the fractures as they might look in core samples and shows how the presence of each fracture might be represented in each of the logs. In many cases the rock volume sampled by the measurement is so large relative to the fracture that the open fluid-filled passages in the fracture are a negligible volumetric fraction of the sample volume. Therefore, the geophysical measurement is much more sensitive to the indirect effects of the fracture, such as fracture mouth enlargement at the wellbore or alteration surrounding the fracture, than to the permeability or hydraulic aperture of the fracture. Electric and neutron logs appear to be especially sensitive to clay mineral alteration and infilling (Nelson et al., 1983; Katsube and Hume, 1987). These logs and the density log are also sensitive to borehole wall enlargement or
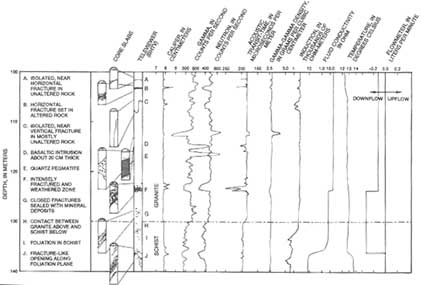
FIGURE 4.B1 Comparison of fracture permeability interpreted from borehole televiewer image logs with results of high-resolution flowmeter measurements of flow under ambient hydraulic head conditions and permeability measured by packer isolation-hydraulic injection tests for two boreholes in fractured dolomite at a site near Rockford, Illinois. From Paillet (1991d).
borehole wall roughness, known as "rugosity" in the well logging literature (Keys, 1979; Paillet, 1991a). All of the fracture responses listed in Figure 4.B1 represent idealized measurements where isolated fractures and their local alteration halos are embedded in homogeneous unfractured crystalline rock. In many situations the host rocks are foliated, cross-cut by sedimentary beds or intrusions, or intensely fractured and altered, so the "idealized" log responses associated with individual fractures cannot be recognized.
The natural gamma ray log is not sensitive to borehole enlargement and is only moderately sensitive to alteration minerals. In some situations, gamma ray logs are used to indicate fractures because radioactive minerals such as uranium and radium may be deposited in fractures in acidic plutonic rocks such as granite. But this response is generally inconsistent, and such fracture-related concentrations of radioisotopes cannot be reliably distinguished from similar deposits lodged in veins and pegmatites (Aguilera, 1979; Paillet, 1991a).
Conventional acoustic logs frequently indicate a response to fractures related to effects other than alteration and borehole enlargement. The first arrival may be only minimally delayed, but its small amplitude prevents detection. Instead, subsequent pulses are detected. This produces an abrupt decrease in acoustic velocity. These fracture-associated spikes are known as "cycle skips" and may serve as fracture indicators. Most modern acoustic logging systems are designed such that routine signal processing rejects these anomalies, and, hence, the log almost always ignores fractures.
Conventional caliper logs measure the average diameters of boreholes (using several spring-loaded arms) and are useful for detecting fractures. As shown in Figure 4.B1, fractures are usually associated with large spikelike anomalies on caliper logs. These spikes represent the effects of mechanical enlargement of fracture mouths during drilling. Experience demonstrates that caliper logs indicate the depths where almost all significant fractures and fracture zones intersect boreholes. However, the spike is a secondary effect related to alteration and drilling damage, and there are situations where caliper logs show absolutely no indication of the presence of fractures. Generally, such fractures are not hydraulically significant.
The schematic application of conventional logs to fracture characterization is illustrated by a typical suite of logs from fractured crystalline basement rocks in New Hampshire (Figure 4.B2). In this figure the caliper log shows anomalies associated with some of the major fractures (label "A" in the figure), and the natural gamma log indicates a major change in lithology below about 46 m (label "B" in the figure). The neutron log illustrates responses associated with major fracture zones (label "C'' in the figure); there is also a gamma ray anomaly that may be associated with radioisotope concentrations in one of the fractures (label "D" in the figure). Electrical resistivity anomalies associated with both borehole enlargement and alteration are indicated by the response of the single-point resistance log (label "E" in the figure). The resistivity log indicates a major shift
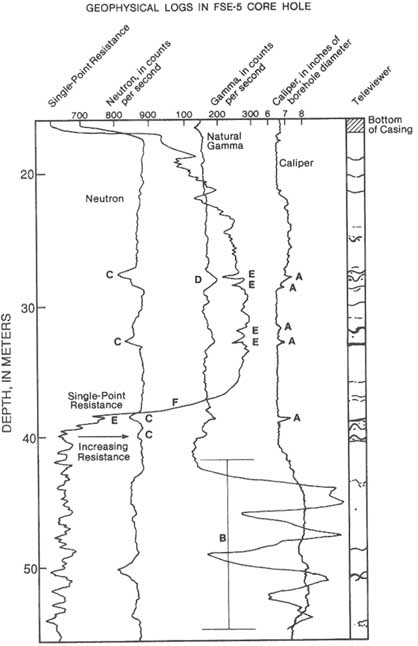
at about 41 m, where fresh water circulating from above exists through one of the fractures, leaving more saline groundwater in the deeper part of the borehole. All of these fracture indicators may be compared to the televiewer log (see "Borehole Imaging Logs" in this chapter) for this well, which gives an image of the fractures intersecting the borehole wall. The televiewer image indicates the orientation and relative size of fractures. Note the extent to which the geophysical logs respond to the most prominent fractures on the televiewer image and fail to indicate many of the smaller and possibly closed fractures.
APPENDIX 4.C
FLOWMETER CASE STUDIES
An example of the use of the heat pulse flowmeter to identify fracture connections to larger-scale flow systems is illustrated in Figure 4.C1, which shows the caliper log for a borehole in fractured schist north of New York City. The BHTV image indicates a high density of fracturing in this rock mass; there are fractures intersecting every meter of this borehole over the entire depth of more than 100 m. This borehole was drilled to investigate a contamination site, and water level monitoring indicated transient drawdowns apparently related to pumping of water wells in the area. This situation raised important practical
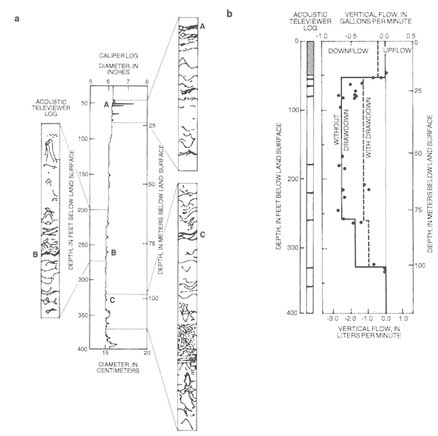
FIGURE 4.C1 Example of high-resolution flowmeter measurements used to define fractures connected to larger-scale flow systems for a borehole in fractured schist in New York. (a) Distribution of fractures indicated by caliper and BHTV logs; (b) distribution of vertical flow under ambient conditions. From Hess and Paillet (1990).
problems about where to install packers to isolate flow systems and to ensure effective sampling of the potential contaminant plume.
Vertical velocity profiles generated with the heat pulse flowmeter showed that, although there were many open fractures intersecting the borehole, fluid actually entered and exited it during the pumping transients at only three depths. Furthermore, each of these entry and exit points could be associated with specific sets of fractures identified on the BHTV image. The individual flow measurements made with the flowmeter are shown in Figure 4.C1b; they show considerable scatter. This scatter is the result of a continuously changing flow regime as drawdowns in adjacent water wells fluctuate. The entry and exit points are resolved by scanning the borehole for the general characteristics of the flow and then making repeat measurements above and below suspected entry or exit fractures.
The most important result of this study was the identification of the three fracture zones that are connected to larger-scale flow systems. The high-resolution flowmeter data allowed these three points to be identified and subsequently isolated with only two packers. The characteristics of these three flow systems could then be monitored over time, and each zone could be sample while the packers prevented cross-contamination of zones.
A second example of high-resolution flow logging for fracture characterization is illustrated by the logging of a potential water well before and after hydraulic stimulation. In the crystalline basement uplift in suburban areas around Boulder, Colorado, domestic water supplies are furnished by wells drilled in fractured granitic rocks. Although these rocks were intensely fractured by at least two separate tectonic events, production statistics indicate that approximately 20 percent of the wells drilled produce less than the 2 liters per minute generally needed for household use (Paillet et al., 1989b). Most of these "dry" wells can be salvaged by a stimulation process whereby fractures are opened by pressurization below a packer and propped by injection of sand into the open fractures. An example of the changes induced by the stimulation of a well is illustrated in Figure 4.C2 (Paillet et al., 1989b). Caliper and BHTV logs before and after stimulation indicate that the borehole is intersected by a number of fractures and that the stimulation process produced no measurable change in these fractures in the immediate vicinity of the borehole. However, flowmeter measurements during injection indicate that stimulation has changed the pattern of fracture connectivity because two relatively minor fractures were capable of accepting about 10 times as much water under the same recharge conditions after stimulation. The large decrease in outflow at the uppermost fracture is attributed to a small rise in water level in the well after stimulation, saturating a previously unsaturated fracture that had accepted much of the recharge during the prestimulation experiment.
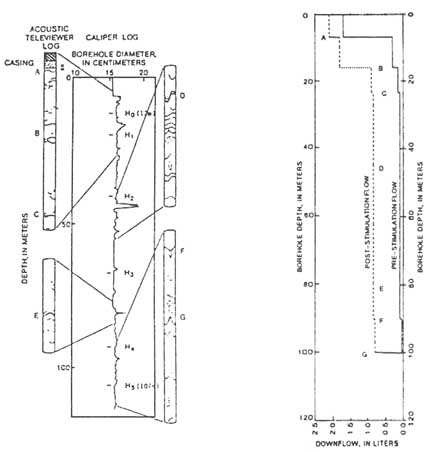
FIGURE 4.C2 Example of high-resolution flowmeter measurements used to characterize changes in fracture properties induced by hydraulic stimulation at a site in Colorado. Left, distribution of fractures indicated by caliper and BHTV logs; right, distribution of vertical flow under about 7 m of hydraulic head during injection before and after stimulation. From Paillet et al. (1989b).
APPENDIX 4.D
EXAMPLE OF SHEAR-WAVE ANISOTROPY IN FRACTURED RESERVOIRS
Shear waves have properties that make them very attractive for characterizing fractured rock. When shear waves propagate through an anisotropic material, their polarization (the direction of the transverse deformation) is controlled by the material's anisotropy rather than by the source. The study of fractured reservoirs has shown that in such cases fracturing is the dominant cause of seismic anisotropy.
Figure 4.D1 is a schematic representation of shear-wave propagation in a homogeneous medium with aligned fractures. The incident wave is shown to be
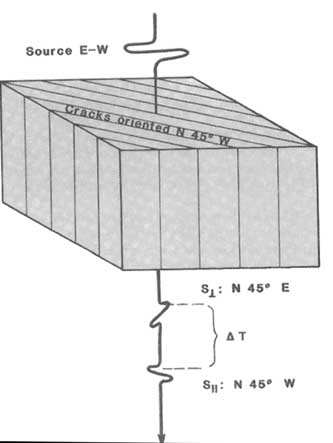
FIGURE 4.D1 Schematic illustration of shear-wave propagation in a homogeneous medium with aligned fractures. From Martin and Davis (1987).
polarized east-west. While traveling through the fractured interval, the incident wave splits into two shear waves—a fast wave polarized parallel to the fractures (N45W) and a slow wave polarized perpendicular to the fractures (N45E). After leaving the fractured interval, both shear waves propagate with the same velocity but have different polarizations and travel times, which were established by the fractured interval. The orientation of the fractures can be determined from the polarization of the first-arriving shear wave.
Digital processing of shear-wave recording allows them to be resolved into the components parallel and perpendicular to the natural coordinate system (a coordinate system assumed to be defined by fracture orientation). The presence of fracturing is seen in travel time differences between parallel and perpendicular orientations, and the orientation of fracturing is determined from the rotation angles.
The use of shear-wave anisotropy information is demonstrated by a case history from a seismic reflection survey of the Silo field in southeastern Wyoming (Martin and Davis, 1987). This field is a naturally fractured reservoir that produces oil from chalks within the late Cretaceous Niobrara formation at depths of about 2,440 m. Because the production in this field is controlled by the orientation and density of fractures, a multicomponent seismic line was obtained to record both P waves and shear waves.
Figure 4.D2 shows a P-wave reflection profile with a P-wave VSP (vertical seismic profile) from a nearby well. The VSP gives depth control to the seismic travel times. The P-wave profile clearly shows the Niobrara formation (labeled "Kn") at 1.7 s, about 2,744 m (9,000 feet) in depth, but there is no fracture information.
Figure 4.D3 shows the parallel (left) and perpendicular (right) shear-wave reflection sections. Various reflections, labeled A through F, clearly show fracture induced time delays between sections, with reflection C, the top of the Niobrara, having a 120-ms time difference. The parallel polarized section (left side) has less travel time because these shear waves are faster. A shear-wave VSP acquired in a nearby well, and polarized perpendicular to fracturing, is shown in the perpendicular reflection section (right side). The observed delay times between orthogonally polarized shear waves correlate with both mapped fracture orientations and fracture intensities inferred from production data throughout the Niobrara formation.
This example demonstrates the utility of split shear waves for mapping from the surface the locations, orientations, and intensities of fractures at great depth.
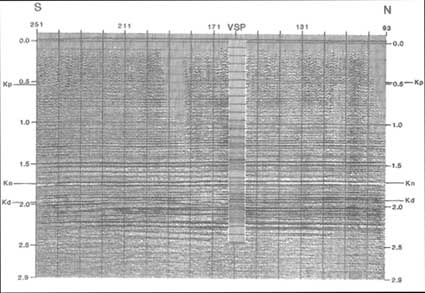
FIGURE 4.D2 P-wave reflection profile and P-wave vertical seismic profile from a well in the Silo field in southeastern Wyoming. The y axis represents two-way travel time. From Martin and Davis (1987).

FIGURE 4.D3 Parallel (left) and perpendicular (right) shear-wave vertical seismic profiles from the Silo field in southeastern Wyoming. From Martin and Davis (1987).
REFERENCES
Aguilera, R. 1979. Naturally Fractured Reservoirs. Tulsa, Okla.: Petroleum Publishing.
Alford, R. M. 1986. Shear data in the presence of azimuthal anisotropy. Pp. 476–479 in Society of Exploration Geologists Convention Expanded Abstracts. Tulsa, Okla.: Society of Exploration Geologists.
Almén, K. E., and O. Zellman. 1991. Äspö Hard Rock Laboratory—field investigation methodology and instruments used in the preinvestigation phase, 1986–1990. SKB TR 91-21. Stockholm: Swedish Nuclear Fuel and Waste Management Co.
Alumbaugh, D. L., and H. F. Morrison. 1993. Electromagnetic conductivity imaging with an iterative Born inversion. IEEE Transactions on Geoscience and Remote Sensing , 31(4):758–763.
Andersson, P., E. Gustafsson, and O. Olsson. 1989. Investigation of flow distribution in a fracture zone at the Stripa mine, using the radar method results and interpretation. SKB TR 89-33. Stockholm: Swedish Nuclear Fuel and Waste Management Co.
Andersson, P. M., B. G. Linder, and N. R. Nilsson. 1991. A radar system for mapping internal erosion in embankment dams. Water Power & Dam Construction, July:11–16.
Balch, A. H., and M. W. Lee, eds. 1984. Vertical Seismic Profiling: Techniques, Applications, and Case Histories. Boston, Mass.: International Human Resources Development Corp.
Baria, R., and A. S. P. Green. 1986. Seismicity induced during a viscous stimulation at the Camborne School of Mines Hot Dry Rock Geothermal Energy Project in Cornwall, England. Pp. 120–121 in European Association of Exploration Geophysics Expanded Abstracts. Zeist, Netherlands: European Association of Exploration Geophysics.
Barker, R. D. 1989. Depth of investigation of collinear symmetrical four-electrode arrays. Geophysics, 54:1031–1037.
Barton, C. A. 1988. Development of in situ stress measurement techniques for deep drillholes. Ph.D. dissertation, Stanford University, Stanford, Calif.
Barton, C. A., and M. D. Zoback. 1994. Stress perturbations associated with active faults penetrated by boreholes: possible evidence for near-complete stress drop and a new technique for stress magnitude measurement. Journal of Geophysical Research, 99 (B5):9373–9390.
Barton, C. A., L. G. Tessler, and M. D. Zoback. 1991. Interactive image analysis of borehole televiewer data. Pp. 265–284 in Automated Pattern Analysis in Petroleum Exploration, I. A. P. S. Sengupta, ed. New York: Springer-Verlag.
Batchelor, A. S. 1982. The stimulation of a hot dry rock reservoir in the Cornubian Granite, England. In Proceedings of the 8th Workshop on Geothermal Reservoir Engineering.
Blumling, P., C. Cosma, M. Korn, C. Gelbke, and B. Cassel. 1990. Geophysical methods for the detection of discontinuities ahead of the tunnel face. NAGRA TR 90-07. Wettingen, Switzerland: Swiss National Cooperative for Radioactive Waste Disposal (NAGRA).
Bourke, L. T. 1989. Recognizing artifact images of the formation microscanner. Pp. WW1-WW25 in the 30th Annual Logging Symposium Transactions. Houston, Tex.: Society of Professional Well Log Analysts.
Bregman, N. D., R. C. Bailey, and C. H. Chapman. 1989. Crosshole seismic tomography. Geophysics, 54:200–215.
Burns, D. R. 1990. Acoustic waveform logs and the in-situ measurement of permeability—a review. Pp. 65–78 in Geophysical Applications for Geotechnical Investigations, F. L. Paillet and W.R. Saunders, eds. ASTM STP 1101. Philadelphia, Pa.: American Society for Testing and Materials.
Carswell, A., and W. M. Moon. 1989. Application of multioffset vertical seismic profiling in fracture mapping. Geophysics, 54:737–746.
Christensen, D. M. 1964. A theoretical analysis of wave propagation in fluid-filled drill holes for the interpretation of three-dimensional velocity logs. Pp. K1–K130 in 5th Annual Logging Symposium Transactions. Houston, Tex.: Society of Professional Well Log Analysts.
Claerbout, J. F. 1985. Imaging the Earth's Interior. Oxford: Blackwell.
Coggon, J. H. 1973. A comparison of IP electrode arrays. Geophysics. 38:737–761.
Cohen, A. 1996. Hydrogeologic Characterization of Fractured Rock Formations: A Guide for Ground-water Remediators. Report in preparation, Lawrence Berkeley Laboratory, Berkeley, Calif.
Cosma, C. 1990. Fracture characterization by seismic and sonic methods, techniques applied during Phase III of the Stripa Project. Pp. 85–95 in Proceedings of the 3rd NEA/SKB symposium on in-situ experiments associated with the disposal of radioactive waste. Paris: Organization for Economic Cooperation and Development, Nuclear Energy Agency .
Cosma, C. 1991. Seismic imaging techniques applied to rock engineering. Pp. 37–49 in Proceedings of the 1st Society of Exploration Geophysicists of Japan International Symposium on Geotomography. Tokyo: Society of Exploration Geophysicists of Japan.
Cosma, C., P. Heikkinen, and S. Pekonen. 1991. Improvement of high resolution seismics: Part I, Development of processing methods for VSP surveys; Part II, Piezoelectric signal transmitter for seismic measurements. Stripa Project TR 91-13. Stockholm: Swedish Nuclear Fuel and Waste Management Co.
Crampin, S. 1991. A decade of shear-wave splitting in the earth's crust. Geophysical Journal International, 107(3):387–408.
Crampin, S., I. Bush, C. Naville, and D. Taylor. 1986. Estimating the internal structure of reservoirs with shear-wave VSP's. Geophysics: The Leading Edge of Exploration, 5(11):85.
Cumerlato, C. L., V. J. Stachura, and D. R. Tweeton. 1991. Assessing presplit blast damage with crosshole seismic tomography. Pp. 514–517 in Society of Exploration Geophysicists Expanded Abstracts. Tulsa, Okla.: Society of Exploration Geophysicists.
Daily, W. 1984. Underground oil-shale retort monitoring using geotomography. Geophysics, 49:1701–1707.
Daily, W., and E. Owen. 1991. Cross-borehole resistivity tomography. Geophysics, 56:1228–1235.
Dennis, B., E. Standen, D. T. Georgi, and G. O. Callow. 1987. Fracture identification and productivity predictions in a carbonate reef complex. SPE 16808, Society of Petroleum Engineers, Richardson, Tex., pp. 579–588.
Dey, A., W. H. Meyer, H. F. Morrison, and W. M. Dolan. 1975. Electric field response of two-dimensional inhomogeneities to unipolar and bipolar configurations. Geophysics, 40:615–632.
Dyer, B. C., and M. H. Worthington. 1988a. Seismic reflection tomography—a case study. First Break, 6:354–365.
Dyer, B., and M. H. Worthington. 1988. Some sources of distortion in tomographic velocity images. Geophysical Prospecting, 36:209–222.
Ekstrom, M. P., C. A. Dahan, M. Y. Chen, P. M. Lloyd, and D. J. Rossi. 1987. Formation imaging with microelectrical scanning arrays. The Log Analyst, 28(3):294–306.
Garotta, R. 1989. Detection of azimuthal anisotropy. Pp. 861–863 in European Association of Exploration Geophysicists, 51st Annual Meeting Extended Abstracts, Zeist, Holland.
Green, A. G., and J. A. Mair. 1983. Subhorizontal fractures in a granitic pluton: their detection and implications for radioactive waste disposal. Geophysics, 48(11):1428–1449.
Hanson, J. C., D. R. Tweeton, M. J. Friedel, and L. J. Dahl. 1991. A field test of electromagnetic methods for the detection of conductive plumes. Pp. 569–572 in Society of Exploration Geophysicists (SEG) Expanded Abstracts. Tulsa, Okla.: Society of Exploration Geophysicists.
Hardin, E. L., and M. N. Toksöz. 1985. Detection and characterization of fractures from generation of tube waves. Pp. II1–II21 in 26th Annual Logging Symposium Transactions. Houston, Tex.: Society of Professional Well Log Analysts.
Hardin, E. L., C. H. Cheng, F. L. Paillet, and J. D. Mendelson. 1987. Fracture characterization by means of attenuation and generation of tube waves in fractured crystalline rock at Mirror Lake, New Hampshire. Journal of Geophysical Research, 92(B8):7989–8006.
Hess, A. E. 1986. Identifying hydraulically conductive fractures with a slow-velocity borehole flowmeter. Canadian Geotechnical Journal, 23(1):69-78.
Hess, A. E., and F. L. Paillet. 1990. Applications of the thermal-pulse flowmeter in the hydraulic characterization of fractured rocks. Pp. 99–112 in Geophysical Applications for Geotechnical Investigations, F. L. Paillet and W. R. Saunders, eds. ASTM STP 1101. Philadelphia, Pa.: American Society for Testing and Materials.
Hestir, K., and J. Long. 1990. Analytical expressions for the permeability of random two-dimensional poisson fracture networks based on regular lattice percolation and equivalent media theories. Journal Geophysical Research, 95(B13):21565–21582.
Holloway, A. L., K. M. Stevens, and G. S. Lodha. 1992. The results of surface and borehole radar profiling from permit area B of the Whiteshell research area, Manitoba, Canada. Special Paper 16, 329-337. Espoo: Geological Survey of Finland.
Hornby, B. E., D. L. Johnson, K. W. Winkler, and R. A. Plumb. 1989. Fracture evaluation using reflected Stoneley-wave arrivals. Geophysics, 54(10):1274–1288.
Hornby, B. E., S. M. Luthi, and R. A. Plumb. 1992. Comparison of fracture apertures computed from electrical borehole scans and reflected Stoneley waves: an integrated interpretation. The Log Analyst, 32(1)50–66.
Hudson, J. A. 1980. Overall properties of a cracked solid. Mathematical Proceedings of the Cambridge Philosophical Society, 88:371.
Ivansson, S. 1986. Seismic borehole tomography—theory and computational methods. Proceedings of the Institute of Electrical and Electronic Engineers, 74:328–338.
Johnsen, H. K. 1977. A man/computer interpretation system for resistivity soundings over a horizontally stratified earth. Geophysical Prospecting, 25:667–691.
Justice, J. H., A. A. Vassiliou, S. Singh, J. D. Logel, P. A. Hansen, B. R. Hall, P. R. Hutt, and J. J. Solanki. 1989. Acoustic tomography for monitoring enhanced oil recovery. The Leading Edge, 8(2):12–19.
Kamewada, S., and S. G. Hu. 1990. Application of a borehole image processing system to the survey of a tunnel. Pp. 51–58 in Rock Joints, Proceedings of the International Symposium on Rock Joints, Loen, Norway, W. Barton, and E. Stephannson, eds. Rotterdam: A. A. Balkema.
Katsube, T. J., and J. A. Hume. 1987. Permeability determination in crystalline rocks by standard geophysical logs. Geophysics, 52(3):342–352.
Ketola, M., and M. Puranen. 1967. Type curves for the interpretation of Slingram (horizontal loop) anomalies over tabular bodies. Report of Investigations #1. Espoo: Geological Survey of Finland.
Keys, W. S. 1979. Borehole geophysics in igneous and metamorphic rocks. Pp. 1–26 in the 20th Annual Logging Symposium Transactions. Houston, Tex.: Society of Professional Well Log Analysts.
Keys, W. S., and R. F. Brown. 1985. Effects of artificial recharge on the Ogallala aquifer, Texas. USGS Water Supply Paper 2251, U.S. Geological Survey, Reston, Va.
Keys, W. S., and J. K. Sullivan. 1979. Role of borehole geophysics in defining the physical characteristics of the Raft River geothermal reservoir, Idaho. Geophysics, 44(6):1116–1141.
Kierstein, R. A. 1983. True location and orientation of fractures logged with the acoustic televiewer (including programs to correct fracture orientation). USGS Water Resources Investigations Report 83-4275, U.S. Geological Survey, Reston, Va.
Krajewski, C., L. Dresen, C. Gelbke, and H. Ruter. 1989. Iterative tomographic methods to locate seismic low-velocity anomalies: a model study. Geophysical Prospecting, 37:717–752.
Kuich, N. 1989. Seismic fracture identification and horizontal drilling: keys to optimizing productivity in a fractured reservoir, Giddings Field, Texas. Transactions of the Association of Geological Societies, 34:153-158.
Lacy, L. L., and X. Smith. 1989. Fracture azimuth and geometry determinations. Pp. 357–375 in SPE Monograph 12: Recent Advances in Hydraulic Fracturing. Richardson, Tex.: Society of Petroleum Engineers.
Lau, J. S. O. 1983. The determination of true orientation of fractures in rock cores. Canadian Geotechnical Journal, 20(2):209–221.
Lee, K. H. 1993. Three-dimensional interpretation of electromagnetic (EM) field data using a nonlinear inversion scheme. Paper presented at the Computational Technology Initiative for the Oil and Gas Industry, Santa Fe, N.Mex., June 20–24.
Lefeuvre, F., and P. Desegaulx. 1993. Azimuthal anisotropy analyzing with P-waves: the AVOAVAZ approach. European Association of Exploration Geophysicists Abstracts, 55:C031.
Lieblich, D. A., J. W. Lane, and F. P. Haeni. 1991. Results of integrated surface geophysics studies for shallow subsurface fracture detection at three New Hampshire sites. Proceedings of Society of Exploration Geophysicists (SEG) Convention Expanded Abstracts. Tulsa, Okla.: Society of Exploration Geophysicists.
Lieblich, D. A., F. P. Haeni, and R. E. Cromwell. 1992a. Interactive use of surface geophysics methods to indicate subsurface fractures at Tibbitts Road, Barrington, New Hampshire. USGS Water Resources Investigation Report 92-4012, U.S. Geological Survey, Reston, Va.
Lieblich, D. A., F. P. Haeni, and J. W. Lane. 1992b. Interactive use of surface geophysics methods to indicate subsurface fractures in Milford, New Hampshire. USGS Water Resources Investigation Report 92-4056, U.S. Geological Survey, Reston, Va.
Lines, L. 1991. Applications of tomography to borehole and reflection seismology. The Leading Edge, 10:11–17.
Liu, E., S. Crampin, J. H. Queen, and W. D. Rizer. 1993. Velocity and attenuation anisotropy caused by microcracks and macrofractures in azimuthal reverse VSPs. Canadian Journal of Exploration Geophysics, 29(1):177–188.
Lockner, D., and J. Byerlee. 1977. Hydrofracture in Weber sandstone at high confining pressure and differential stress. Journal of Geophysical Research, 82:2018–2026.
Macbeth, C. 1991. Inversion for subsurface anisotropy using estimates of shear-wave splitting. Geophysical Journal International, 107(3):585–595.
Majer, E. L., and T. W. Doe. 1986. Studying hydrofractures by high frequency seismic monitoring. International Journal of Rock Mechanics and Mineral Science, 23(3):185–199.
Majer, E. L., and T. V. McEvilly. 1982. The Stripa acoustic emission experiment. Pp. 569–582 in Proceedings of a Workshop on Hydraulic Fracturing for Stress Measurements, USGS Open File Report 82-1075, U.S. Geological Survey, Reston, Va.
Majer, E. L., T. V. McEvilly, and T. W. Doe. 1983. Laboratory studies of acoustic emissions (AE) in salt during hydrofracturing. EOS, Transactions of the American Geophysical Union, 64(45).
Majer, E. L., L. R. Myer, J. E. Peterson, K. Karasaki, J. C. S. Long, S. J. Martel, P. Blumling, and S. Vomvoris. 1990. Joint seismic, hydrogeological and geomechanical investigations of a fracture zone in the Grimsel Rock Laboratory, Switzerland. NAGRA TR 90-49. Wettingen, Switzerland: Swiss National Cooperative for Radioactive Waste Disposal (NAGRA).
Majer, E. L., R. H. Chapman, W. D. Stanley, and B. D. Rodriguez. 1992. Monograph on The Geysers Geothermal Field, Special Report 17, Geothermal Resources Council, Davis, Calif.
Maki, V., S. Gianzero, R. Strickland, H. N. Kepple, and M. V. Gianzero. 1991. Dynamically focused transducer applied to the cast imaging tool. Pp. HH1–HH24 in 32d Annual Logging Symposium Transactions. Houston, Tex.: Society of Professional Well Log Analysts.
Martin, M. A., and T. L. Davis. 1987. Shear-wave birefringence: a new tool for evaluating fractured reservoirs. Geophysics: The Leading Edge of Exploration, 6(10):22.
McNeil, J. D. 1990. Use of electromagnetic methods for groundwater studies. Pp. 191–218 in Geotechnical and Environmental Geophysics, vol. 1, S.H. Ward, ed. Tulsa, Okla.: Society of Exploration Geophysicists.
Meadows, M. A., and P. F. Winterstein. 1994. Seismic detection of a hydraulic fracture from shear-wave VSP data at Lost Hills Field, California. Geophysics, 59:11–26.
Molz, F. J., and S. C. Young. 1993. Development and application of borehole flowmeters for environmental assessment. The Log Analyst, 34(1):13–23.
Momii, K., K. Jinno, and F. Herein. 1993. Laboratory studies on a new LDV system for horizontal groundwater velocity measurement in a borehole. Water Resources Research, 29:283–291.
Nelson, P. H., K. A. Magnusson, and R. Rachiele. 1983. Applications of borehole geophysics at an experimental waste storage site. Geophysical Prospecting, 30:910–934.
Nolet, G. 1987. Seismic Tomography. Dordrecht, Holland: D. Reidel.
Nyland, E., and M. Dusseault. 1983. Fire flood microseismic monitoring results and potential for process control. Journal of Canadian Petroleum Technology, March–April:61–68.
Olsson, O., ed. 1992. Site characterization and validation. Final report, Stripa Project, TR 92-22. Stockholm: Swedish Nuclear Fuel and Waste Management Co.
Olsson, O., P. Anderson, and E. Gustafsson. 1991. Site characterization and validation—monitoring of saline tracer transport by borehole radar measurements. Final report, Stripa Project TR 91-18. Stockholm: Swedish Nuclear Fuel and Waste Management Co.
Olsson, O., L. Falk, O. Forslund, L. Lundmark, and E. Sandberg. 1992. Borehole radar applied to the characterization of hydraulically conductive fracture zones in crystalline rock. Geophysical Prospecting, 40:109–142.
Paillet, F. L. 1980. Acoustic propagation in the vicinity of fractures which intersect a fluid-filled borehole. Pp. DD1–DD30 in 21st Annual Logging Symposium Transactions. Houston, Tex.: Society of Professional Well Log Analysts.
Paillet, F. L. 1983. Acoustic characterization of fracture permeability at Chalk River, Ontario. Canadian Geotechnical Journal, 20(3):468–476.
Paillet, F. L. 1984. Field tests of an acoustic sparker source for waveform logging . Pp. GG1–GG25 in 25th Annual Logging Symposium Transactions. Houston, Tex.: Society of Professional Well Log Analysts.
Paillet, F. L. 1985a. Problems in fractured-reservoir evaluations and possible routes to their solution. The Log Analyst, 26(6):26–41.
Paillet, F. L. 1985b. Borehole acoustic applications in rock mechanics. Pp. 207–219 in Proceedings of the 26th U.S. Symposium on Rock Mechanics. Rotterdam: A. A. Balkema.
Paillet, F. L. 1991a. Use of geophysical well logs in evaluating crystalline rocks for siting of radioactive waste repositories. The Log Analyst, 33(2):85–107.
Paillet, F. L. 1991b. High-resolution flow logging in observation boreholes during hydraulic testing of fractured-rock aquifers. Pp. L1–L23 in 32d Annual Logging Symposium Transactions. Houston, Tex.: Society of Professional Well Log Analysts.
Paillet, F. L. 1991c. Qualitative and quantitative of fracture permeability using acoustic full-waveform logs. The Log Analyst, 32(3):256–270.
Paillet, F. L. 1991d. Comparing geophysical logs to core and cross borehole flow logging in the Mirror Lake drainage basin. U.S. Geological Survey Toxic Substances Hydrology Program, Proceedings of the Technical Meeting, Monterey, California. March 11–15. G. E. Mallard and D. A. Aronason, eds. USGS Water Resources Investigation Report 91-4034, U.S. Geological Survey, Reston, Va.
Paillet, F. L. 1993. Application of borehole geophysics in the characterization of flow in fractured rocks . USGS Water Resources Investigation Report 93-4214, U.S. Geological Survey, Reston, Va.
Paillet, F. L., and C. H. Cheng. 1991. Acoustic Waves in Boreholes—The Theory and Application of Acoustic Full-Waveform Logs. Boca Raton, Fla.: CRC Press.
Paillet, F. L., and D. Goldberg, 1991. Acoustic televiewer log images of natural fractures and bedding planes in the Toa Baja borehole, Puerto Rico. Geophysical Research Letters, 18(3):501–504.
Paillet, F. L., and R. H. Morin. 1988. Analysis of geophysical well logs obtained in the state 2-14 borehole, Salton Sea geothermal area, California. Journal of Geophysical Research, 93(B11):12,981–12,994.
Paillet, F. L., W. S. Keys, and A. E. Hess. 1985. Effects of lithology on televiewer-log quality and fracture interpretation. Pp. JJJ1–JJJ30 in the 26th Annual Logging Symposium Transactions. Houston, Tex.: Society of Professional Well Log Analysts.
Paillet, F. L., P. Hsieh, and C. H. Cheng. 1987. Verification of acoustic waveform and seismic VSP measurement of fracture permeability. Pp. PP1–PP21 in the 28th Annual Logging Symposium Transactions. Houston, Tex.: Society of Professional Well Log Analysts.
Paillet, F.L., C.H. Cheng, and X.M. Tang. 1989a. Theoretical models relating acoustic tube-wave attenuation to fracture permeability—reconciling model results with field data. Pp. FF1–FF24 in the 30th Annual Logging Symposium Transactions. Houston, Tex.: Society of Professional Well Log Analysts.
Paillet, F. L., J. Waltz, and R. E. Boyle. 1989b. Geophysical log investigation of formation changes produced by hydraulic fracture stimulation in a crystalline-bedrock aquifer. Pp. EE571–EE594 in Proceedings of the Third Symposium on Borehole Geophysics for Minerals and Geotechnical Logging. Houston, Tex.: Society of Professional Well Log Analysts.
Paillet, F. L., C. Barton, S. Luthi, F. Rambow, and J. Zemanek. 1990. Borehole Imaging. SPWLA Reprint Series. Houston, Tex.: Society of Professional Well Log Analysts.
Paillet, F. L., R. T. Kay, D. Yeskis, and W. Pedler. 1993. Integrating well logs into a multiple-scale investigation of a fractured sedimentary aquifeu. The Log Analyst, 34(1):13–23.
Pearson, C. 1981. The relationship between microseismicity and high pore pressures during hydraulic stimulation experiments in low permeability granitic rocks. Journal of Geophysical Research, 86(B9):7855–7865.
Pickett, G. R. 1960. The use of acoustic logs in the evaluation of sandstone reservoirs. Geophysics, 25(1):250–274.
Power, D. V., C. L. Shuster, R. Hay, and J. Twombly. 1976. Detection of hydraulic fracture orientation and dimensions in cased wells. Journal of Petroleum Technology, pp. 1116–1124.
Powley, D. 1990. Pressures and hydrogeology in petroleum basins. Earth Science Reviews, 29:215–226.
Pratt, R. G., and C. H. Chapman. 1992. Travel-time tomography in anisotropic media: application. Geophysical Journal International, 109(1):20–37.
Pratt, R. G., and N. R. Goulty. 1991. Combining wave-equation imaging with travel-time tomography to form high-resolution images from crosshole data. Geophysics, 56:208–224.
Pratt, R. G., and M. H. Worthington. 1988. The application of diffraction tomography to cross-hole seismic data. Geophysics, 53:1284–1294.
Rijo, L., W. H. Pelton, E. C. Feitosa, and S. H. Ward. 1977. Interpretation of apparent resistivity data from Apodi Valley, Rio Grande Do Norte, Brazil. Geophysics, 42:811–822.
Rosenbaum, J. H. 1974. Synthetic microseismograms: logging in porous formation . Geophysics, 39:14–32.
Sandberg, E. V., O. L. Olsson, and L. R. Falk. 1991. Combined interpretation of fracture zones in crystalline rock using single-hole, cross-hole tomography and directional borehole-radar data. The Log Analyst, 32(2):108–119.
Sattel, G., and C. Gelbke. 1987. Non-destructive rock testing with seismic crosshole tomography. Pp. 845–848 in Society of Exploration Geophysicists (SEG) Convention Expanded Abstracts. Tulsa, Okla.: Society of Exploration Geophysicists.
Sattel, G., P. Frey, and R. Amberg. 1992. Prediction ahead of the tunnel face by seismic methods—pilot project in Centovalli Tunnel, Locarno, Switzerland. First Break, 10(1):19–25.
Schmidt, R. D. 1985. Fracture zone dewatering to control ground water inflow in underground coal mines. RI 8981, pp. 4–16. Washington, D.C.: U.S. Department of the Interior, Bureau of Mines.
Shima, H. 1990. Two-dimensional automatic resistivity inversion technique using alpha centers. Geophysics, 55:682–694.
Shima, H., and H. Saito. 1989. Automatic three-dimensional resistivity inversion of crosshole data. Paper presented at European Association of Exploration Geophysicists meeting, June, West Berlin, Germany .
Smith, M. B., G. B. Holman, C. R. Fast, and R. J. Covlin. 1978. The azimuth of deep penetrating fractures in the Wattenburg field. Journal of Petroleum Technology, 30:185–193.
Solberg, P., D. Lockner, and J. Byerlee. 1977. Shear and tension hydraulic fractures in low permeability rocks. PAGEOPH, 115:191–198.
Stolarczyk, L. G. 1990. Radio imaging in seam wave guides. Pp. 187–209 in Geotechnical and Environmental Geophysics, vol. 3, Ward, S. H., ed. Tulsa, Okla.: Society of Exploration Geophysicists.
Stratton, J. A. 1941. Electromagnetic Theory. New York: McGraw-Hill.
Tang, X. M. and C. H. Cheng. 1989. A dynamic model for fluid flow in open borehold fractures. Journal of Geophysical Research, 94(B6):7567–7576.
Telford, W. M., L. P. Geldart, R. E. Sherif, and D. A. Keys. 1976. Applied Geophysics. Cambridge: Cambridge University Press.
Thomsen, L. 1988. Reflection seismology over page 146 anisotropic media. Geophysics, 53(3):304–313.
Thomsen, L. 1995. Elastic anisotropy due to aligned cracks in porous rock. Geophysical Prospecting, 43:805–829.
Tsang, C. F., P. Hufschmied, and F. V. Hale. 1990. Determination of fracture inflow parameters with a borehole fluid conductivity logging method. Water Resources Research, 26(4):561–578.
Tura, M. A. C., L. R. Johnson, E. L. Majer, and J. E. Peterson. 1991. Application of diffraction tomogrophy to fracture detection. Geophysics, 57(2):245-257.
Van, G. P., S. K. Park, and P. Hamilton. 1991. Monitoring of leaks from storage ponds using resistivity methods. Geophysics, 56:1267–1270.
Vernon, J. H., F. L. Paillet, W. H. Pedler, and W. J. Griswold. 1993. Applications of borehole geophysics in defining the wellhead protection area for a fractured crystalline bedrock aquifer. The Log Analyst, 34(1):41–57.
Villegas-Garcia, C. J., and G. F. West. 1983. Recognition of electromagnetic overburden anomalies with horizontal loop electromagnetic survey data. Geophysics, 48:42–51.
Ward, S. H. 1990. Resistivity and induced polarization methods. Pp. 147–189 in Geotechnical and Environmental Geophysics, vol. 1, S. H. Ward, ed. Tulsa, Okla.: Society of Exploration Geophysicists.
White, J. E. 1983. Underground Sound: Application of Seismic Waves. New York: Elsevier.
Willis, H. A., G. L. Rethford, and E. Bielouski. 1986. Azimuthal anisotropy: occurrence and effect on shear-wave data quality. Pp. 470–481 in Society of Exploration Geophysicists (SEG) Convention Expanded Abstracts. Tulsa, Okla.: Society of Exploration Geophysicists.
Wills, P. B., D. C. DeMartini, H. J. Vinegar, and J. Shlyapobersky. 1992. Active and passive imaging of hydraulic fractures. Geophysics: The Leading Edge of Exploration, 11(7):15–23.
Winterstein, D. F., and M. A. Meadows. 1991a. Shear-wave polarizations and subsurface stress directions at Lost Hills field. Geophysics, 56:1331–1348.
Winterstein, D. F., and M. A. Meadows. 1991b. Changes in shear-wave polarization azimuth with depth in Cymric and Railroad Gap oil fields. Geophysics, 56:1349–1364.
Wu, R. S., and M. N. Toksöz. 1987. Diffraction tomography and multisource holography applied to seismic imaging. Geophysics, 52:11–25.
Yorkey, T. J., J. G. Webster, and W. J. Tompkins. 1987. Comparing reconstruction algorithms for electrical impedance tomography. IEEE Transactions in Biomedical Engineering, 34:843–852.
Zemanek, J., E. E. Glenn, L. J. Norton, and R. L. Caldwell. 1970. Formation evaluation by inspection with the borehole televiewer. Geophysics, 35:254–269.


