
2
Physical Characteristics of Fractures and Fracture Patterns
The purpose of this chapter is to provide a geological and geomechanical understanding of fracture formation, characteristics of various fracture types, network patterns, and internal structure. The geometry of fractures, their internal architecture, and present-day state of stress control fluid flow in fractured rocks. A geomechanical understanding of these properties provides an intellectual platform for making sensible inferences and predictions about the nature and location of fractures in the subsurface and underlies the interpretation of data collected through other indirect characterization techniques.
The theme that underlies rock fracture mechanics is the notion of stress heterogeneities over a broad range of scales. This includes stress concentration around material flaws and other physical discontinuities as well as broad variations in the stress field. It is this heterogeneity of stress that controls the initiation and propagation of individual fractures and the localization and clustering of the fracture systems.
Rock properties also play an important role in the formation of fractures and in the structure of fracture zones. There are marked differences in the internal structures of fractures and fracture zones in different lithologic units.
This chapter will describe some of the most prominent modes of fracturing and fracture structures for common rock lithologies. The first section deals with the definition and classification of fractures to provide a common language for a multidisciplinary readership. A following section addresses mechanisms of fracture initiation and propagation based on the concept of stress concentration. Examples of fracture formation are given for a few common rock types. The geometric characteristics of fracture networks and fracture zones and their varia-
tions in terms of geological regimes and rock lithology are briefly discussed. These fracture network patterns are compared with those commonly used in reservoir simulations.
DEFINITION AND CLASSIFICATION
Fractures are mechanical breaks in rocks involving discontinuities in displacement across surfaces or narrow zones. Fracture is a term used for all types of generic discontinuities. This usage is common among scientists inside and outside the earth sciences and is used in other chapters of this report. However, different kinds of fractures exist, with different geometries, mechanical effects, and flow properties. Based on the nature of the displacement discontinuity, commonly encountered fractures can be classified into three geologically based major groups: (1) dilating fractures/joints, (2) shearing fractures/faults, and (3) closing fractures/pressure solution surfaces. (Pressure solution surfaces are fractures in sedimentary rock that are welded together by solution that occurs at the contact surfaces of grains [Bates and Jackson, 1980].) This chapter is concerned with the first two of these groups, joints and faults, illustrated schematically in Figure 2.1. Dilating fractures, which are also referred to as joints, can be idealized as two rough surfaces with normal displacement discontinuity; that is, the surfaces have moved away from each other in a direction perpendicular to the surfaces (Figure 2.1b). (They are also called mode I fractures in engineering fracture mechanics [Lawn and Wilshaw, 1975].) Shear fractures, which are also referred to as faults, are shear displacement discontinuities where the fracture surfaces move predominantly parallel to each other. This relative movement is either perpendicular (mode II) or parallel (mode III) to the fracture front (Figure 2.1b). Pressure solution surfaces, also referred to as stylolites, are known as anticracks in which the sense of the displacement discontinuity is opposite that of dilating fractures or mode I fractures (Fletcher and Pollard, 1981). For a review of pressure solution surfaces and their hydraulic properties, the reader is referred to Nelson (1985).
Fractures with a combination of these modes (mixed-mode fractures) also are possible. Rock masses with complex deformational histories have fractures produced by two or more of these modes in a sequential manner (Figure 2.2 a–d). This yields fractures with overprinted displacement discontinuities (Barton, 1983; Dyer, 1983; Segall and Pollard, 1983a,b; Zhao and Johnson, 1992). All combinations of displacement discontinuities may occur in nature, but the most common ones are faulted joints and jointed faults. Although these two types of fractures are kinematically similar to faults and joints, which were defined previously, their total displacement discontinuities, geometries, and internal structures may be very different because of the overprinting of two different modes of deformation.
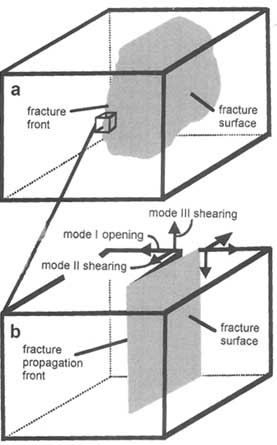
FIGURE 2.1 (a) Block diagram showing a fracture and its propagation front. (b) Three fundamental modes of fractures corresponding to joints (mode I) and faults (mode II or mode III). From Pollard and Aydin (1988).
Joints, faults, and pressure solution surfaces filled by minerals are known as veins, seams, and filled pull-aparts. The mineral fillings have important consequences for fluid flow because they may alter the flow properties of the fractured rock. The mineral fillings may have different permeabilities than the host rock, and vein bridges may keep fractures open. The mineral fillings also provide information about the nature of the fluids flowing in the fractures, the original apertures of the fractures, and the physical and chemical conditions during precipitation.
Joints and faults can be identified by distinctive surface features; joint surfaces are ornamented by the so-called plumose texture (Figure 2.3a), whereas through-
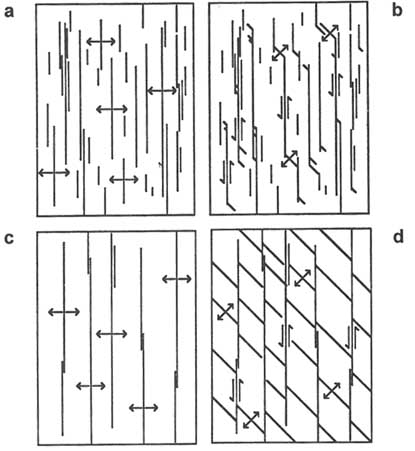
FIGURE 2.2 Development of faulted joints. Parts a and c are original joint patterns, and b and d are faulted joints with dilantant fractures in the overlap regions (b) and in between faulted joints (d). From Pollard and Aydin (1988).
going fault surfaces are polished and are marked by linear features known as grooves and striations or slickensides (Figure 2.3b). Plumose patterns record fracture propagation directions and may be radial or axisymmetric or may have a more complex geometry (Kulander et al., 1979; Pollard and Aydin, 1988; Bahat, 1988). Grooves and striations on fault surfaces record slip directions (e.g., Patterson, 1958; Suppe, 1985). Subsequent motions different from the original movements along faults may cause mismatches between opposite faces of the fracture. This mismatch may produce open channels that are potential pathways for fluid flow.
Joints and faults are fundamentally different in terms of their associated stress fields (Pollard and Segall, 1987). These differences provide a basis for
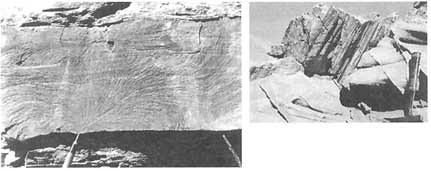
FIGURE 2.3 Left, a joint surface ornament known as plumose structure. From Pollard and Aydin (1988). Right, a normal fault surface with striations. From Aydin and Johnson (1978).
understanding the initiation, propagation, interaction, and termination of joints and faults and the nature and distributions of the associated structures around them.
GENESIS OF FRACTURES
In general, fractures initiate and propagate when the stresses become equal to the strength of rock (a more precise propagation criterion is discussed later in this chapter, under ''Fracture Propagation and Internal Structures"). Several possible sources or mechanisms that are capable of producing high stresses in the earth's crust can be identified. Among these are (1) lithostatic (changes in the weight of overburden either by burial or removal caused by uplift and erosion); (2) fluid pressure; (3) tectonic forces associated with the movement of lithospheric plates; (4) thermal (cooling of intrusive and extrusive rocks, and cooling caused by uplift and erosion of the crust); (5) impact by extraterrestrial objects; and (6) other geological processes such as folding, volcanic activity, and salt intrusion.
The relationship between fracture formation and a particular causal mechanism is obvious in some cases. For example, fractures that form a polygonal geometry (polygonal fractures) in volcanic rocks can be linked directly to thermal stresses produced during cooling of the rocks. In this case the patterns and systematic development of the fracture system can be understood in terms of the thermal history of the magma and rock fracture mechanics (Ryan and Sammis, 1978; DeGraff and Aydin, 1993).
Igneous rocks that crystallize at depth may also fracture during cooling. For example, Segall et al. (1990) dated mineralized fracture fillings in a granitic body from the Sierra Nevada in California. This analysis showed that the fractures formed as the granite was emplaced or shortly thereafter, suggesting that they formed as the granite cooled. The Sierran fractures are nearly parallel to one another, quite unlike the polygonal fracture patterns that develop as a lava flow
cools. This difference in fracture geometry may reflect the fact that the granites cooled at depth when they were subjected to other lithostatic or tectonic forces, whereas the lavas cooled under approximately homogeneous stresses at the surface.
Mechanical analyses can help relate fracture patterns to the causative geological processes when direct information on the timing of fracturing is absent. For example, Delaney et al. (1986) investigated dikes (tabular igneous intrusions) and adjacent clusters of dike-parallel joints. By representing a dike as a pressurized crack and modeling the stress field around it, these investigators showed that dike-parallel joints could open ahead of a dike. Such joints would be juxtaposed along the dike if the dike front advanced.
The task of relating a fracture system to a specific process is more difficult, however, for rocks and regions that have undergone multiple deformational events (Spencer, 1959; Wise, 1964). To establish a relationship between a particular fracture system and the mechanism responsible for its formation, it is necessary to establish the temporal and spatial relationship between the observed fracture system and the proposed process. When geological ages are not available or are uncertain, additional supporting arguments can be used. These are usually in the form of plausibility arguments based on geological and mechanical concepts or models.
The sketch in Figure 2.4 illustrates a system of joints in which the mechanism of fracture formation can be discerned through such an analysis. The joints are perpendicular to the layer and are confined primarily in the convex part of the layer. This pattern is consistent with the distribution and orientation of the axial stresses for a buckled plate. Thus, a strong case can be made that buckling or bending is the origin of these joints. In a buckled layer, dilating fractures occur initially above and perpendicular to the neutral plane, which is consistent with the geometry and distribution of the joints in the layer (Figure 2.4). In laboratory compression tests, conjugate shear fractures and opening fractures both formed, with the opening fractures forming perpendicular to the least compressive stress and bisecting the acute angle between the shear fractures (e.g., Peng and Johnson,

FIGURE 2.4 Sketch of a distorted layer and associated fractures. From Van Hise (1896).
1972). Stearns and Friedman (1972) used these relationships to infer the stresses responsible for natural fracture patterns in folded rock layers.
In some cases, regional distributions of joint and fault patterns mimic the trends of mountain belts, suggesting a causative relationship between the formation of fracture systems and a particular tectonic event responsible for the mountain belt. Nickelsen and Hough (1967) and Engelder and Geiser (1980) have made a case for such a correspondence between the Appalachian Mountains belt and the joints that are parallel and perpendicular to the strike of the belt. Additional examples for the genesis of fractures will be given after introduction of the basic concepts of rock fracture. For the time being it is sufficient to note that some regional or local fracture systems can be linked to one of the mechanisms listed above but that others cannot. There is a need to establish relationships between the common stress production mechanisms in the earth's crust and the resulting fracture patterns. This can be done most efficiently by case studies at the surface of the earth that take advantage of the availability of abundant direct information. Once the nature of the relationship between a process and a fracture system is established, it can be used for subsurface predictions and inferences.
FLAWS, STRESS CONCENTRATION, AND FRACTURE INITIATION
The concepts of stress concentration, amplification, and energy balance, which go back to Inglis (1913) and Griffith (1921), are essential to understanding rock fracture initiation as well as fracture propagation and distribution. Griffith showed experimentally that glass samples fractured at an applied stress level much lower than their theoretical strengths. He attributed this to the amplification of stresses around flaws in the glass, which is known as stress concentration. Most flaws in natural materials are slitlike. However, the stress distribution around a circular hole in a plate subjected to uniaxial tension (Figure 2.5) demonstrates the concept of stress concentration quite well. Because of symmetry, it is sufficient to consider the stresses on one quadrant of the hole (e.g., segments AB in Figure 2.5a). The part of the curve from A to B in Figure 2.5b shows the variation of normalized tangential stress from A to B along the perimeter of the circular hole. At a point on the circle diameter perpendicular to the direction of the applied remote stress (point A in Figure 2.5a), the tensile stress has increased threefold. The stress decreases gradually along the circular hole from point A to point B, changes its sign near point B, and finally becomes equal in magnitude but opposite in sign to the applied stress at point B. The stress concentration falls off rapidly away from the hole, as shown by curve segment BC in Figure 2.5b.
Tensile stresses can be induced even under compressive remote loading systems (Pollard and Aydin, 1988; Einstein and Dershowitz, 1990). Figure 2.6b illustrates the tangential stresses on points from A to B at the perimeter of a circular hole in a plate subjected to uniaxial compression, as shown in Figure 2.6a. A tensile stress equal to the remote (measured at some distance from
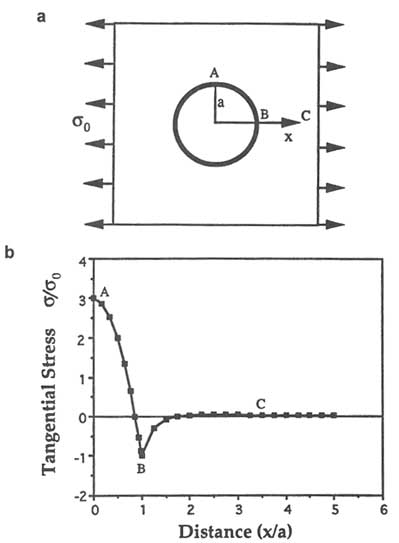
FIGURE 2.5 (a) Circular hole of radius a in a plate subjected to uniaxial tension (![]() 0). (b) Stress distribution (tangential stress normalized by the remote stress around the hole). Because of the symmetry, only a quadrant of the hole (from A to B) is considered. Courtesy of Y. Du.
0). (b) Stress distribution (tangential stress normalized by the remote stress around the hole). Because of the symmetry, only a quadrant of the hole (from A to B) is considered. Courtesy of Y. Du.
the hole) uniaxial compressive stress (![]() 0) in magnitude is induced at point B. Furthermore, tensile stresses can be produced even under hydrostatically compressive loading systems (Figure 2.7a, b) if the internal fluid pressure, P, is greater than twice the applied hydrostatic compression (P > 2
0) in magnitude is induced at point B. Furthermore, tensile stresses can be produced even under hydrostatically compressive loading systems (Figure 2.7a, b) if the internal fluid pressure, P, is greater than twice the applied hydrostatic compression (P > 2![]() 0).
0).
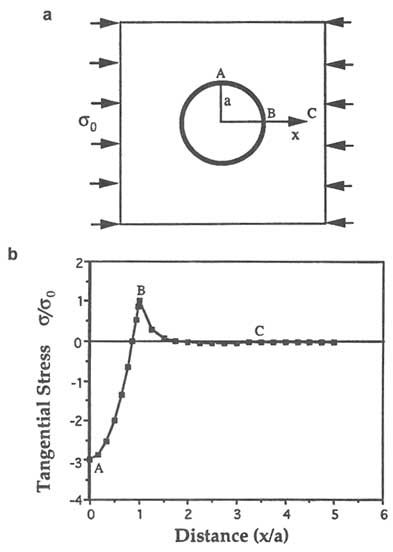
FIGURE 2.6 (a) A circular hole of radius a in a plate subjected to uniaxial compression (![]() 0). (b) Stress distribution around the hole.
0). (b) Stress distribution around the hole.
The amplification of stresses around holes is related to the curvature of the aspect ratio (a/b) of the opening. For an elliptical hole in a plate subjected to a uniaxial stress, the amplification of the stress at the tips is (2a/b) + 1, where a and b are the longest and shortest axes, respectively. Consequently, the magnitude of the stress at one of the tips of a long and thin discontinuity (Figure 2.8) can
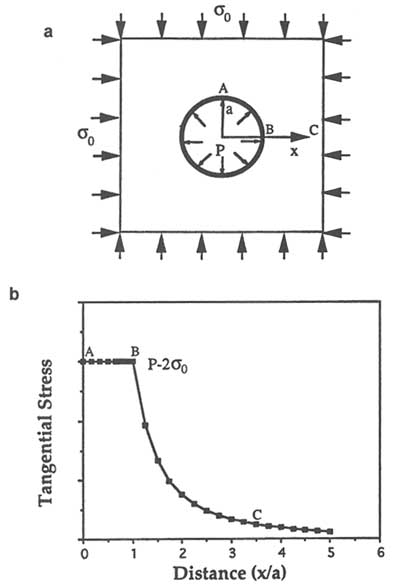
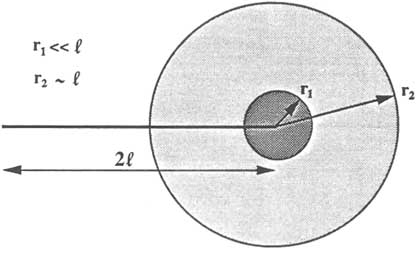
FIGURE 2.8 Regions of stress around a fracture tip. Two regions are defined: one region immediately surrounding the tip (r1 < < l) and one region extending to a distance roughly equal to the half-length (r2 ~ l).
be many times that of the applied remote stress. For this case the expression for stress in a region immediately surrounding the tip based on the assumption of linear elasticity is given by (Lawn and Wilshaw, 1975):
fracture half-length, l, and m = I, II, and III.
Here, Km is the stress intensity factor, that is, a measure of the intensity of the stress concentration, which depends on the applied load and fracture geometry, and is known as KI, KII, and KIII, for modes I, II, and III, respectively. The symbols r and l are defined in Figure 2.8. For the case of a uniformly loaded fracture of half-length l, the stress intensity factor is
The term ![]() m is the stress driving the relative displacement of the fracture walls for a particular mode of fracture (Lawn and Wilshaw, 1975). This equation, together with the previous one, shows that stresses increase near a fracture tip as the fracture lengthens. The remaining terms depend on the geometric factors about the fracture tip; r is the radial and
m is the stress driving the relative displacement of the fracture walls for a particular mode of fracture (Lawn and Wilshaw, 1975). This equation, together with the previous one, shows that stresses increase near a fracture tip as the fracture lengthens. The remaining terms depend on the geometric factors about the fracture tip; r is the radial and ![]() is the angular component (Figure 2.8). Some of the characteristic properties of the fracture tip stress field can be seen from this expression, for example, the dependence on r-1/2, and the singularity as r goes to zero. For larger r this relationship breaks down. For example, for r > l, the distance dependence of the stress is r-2 on average. Recall that
is the angular component (Figure 2.8). Some of the characteristic properties of the fracture tip stress field can be seen from this expression, for example, the dependence on r-1/2, and the singularity as r goes to zero. For larger r this relationship breaks down. For example, for r > l, the distance dependence of the stress is r-2 on average. Recall that
the preceding is based on the assumption of linear elasticity. In reality, stress concentrations at the crack tip cause inelastic behavior (e.g., in the form of microcracking). However, if the inelastic zone is small, the above-mentioned expressions from linear elastic fracture mechanics can be used to analyze the fracturing process (Rice, 1968).
Regional stress fields are generally insufficient to initiate fractures. As a result, heterogeneous stress concentrations are generally necessary for fracture propagation. Such concentrations are abundant in the earth's crust. The heterogeneity and textures in rocks can cause pervasive heterogeneities in the stress field. In detrital sedimentary rocks, for example, grains are stress concentrators (Figure 2.9a; Borg and Maxwell, 1956; Gallagher et al., 1974). In porous sandstone, fracturing on the grain scale is controlled primarily by stress concentration at the contact points between adjacent grains, as shown by Figure 2.9b. In crystalline rocks, structural defects and mismatches between adjacent grains may be the source of stress heterogeneities. Perhaps the most important source of heterogeneities in the stress field is due to geological structures induced by previous deformation at all scales.
Once initiated, fractures themselves significantly alter the stress field in adjacent rock. To illustrate this process, consider the two-dimensional theoretical mean stress fields about a joint (Figure 2.10a) and fault (Figure 2.10b). The mean stress is the average of the in-plane principal stresses (i.e., [![]() 1 +
1 + ![]() 2]/2). Both fractures are of arbitrary length 2l and are subject to a unit driving stress. Uniaxial tension is applied to the joint, and simple shear is applied to the fault. Although the stress fields are different in each case, they are highly heterogeneous and show large stress concentrations near the fracture ends. For the case of the fault, regions of enhanced tension and enhanced compression are arranged antisymmetrically about the fault. The locations and orientations of dilational structures (e.g.,
2]/2). Both fractures are of arbitrary length 2l and are subject to a unit driving stress. Uniaxial tension is applied to the joint, and simple shear is applied to the fault. Although the stress fields are different in each case, they are highly heterogeneous and show large stress concentrations near the fracture ends. For the case of the fault, regions of enhanced tension and enhanced compression are arranged antisymmetrically about the fault. The locations and orientations of dilational structures (e.g.,
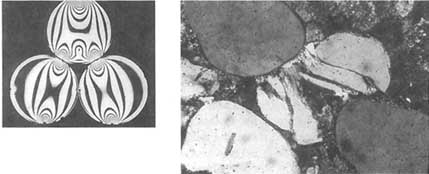
FIGURE 2.9 Left, contact stress between spherical disks made up of Columbia Resin (CR-39). From Gallagher et al. (1974). Right, thin section of Entrada sandstone showing fracturing controlled by contacts between the grains. From Aydin (1978).
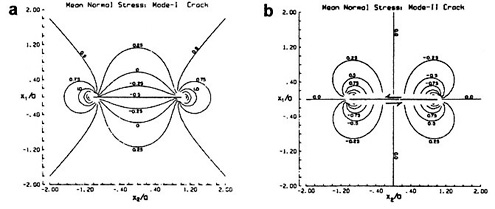
FIGURE 2.10 Mean stress distributions around (a) a joint (mode I fracture) and (b) a fault (mode II fracture). From Pollard and Segall (1987).
veins) and constructional structures (e.g., solution surfaces) near the ends of natural faults (Figure 2.11) are remarkably consistent with the theoretical stress field of Figure 2.10b (Rispoli, 1981). Such a correspondence encourages the use of mechanical analyses as a predictive tool in geological research.
The global-scale inhomogeneity in the stress field is evident from a plate tectonic map of the earth showing the distributions of earthquakes, active volcanoes, and mountain chains. Stresses are high enough to cause active deformation in the interiors of some continents, but the higher intensity of deformation along relatively narrow plate boundaries is evidence for higher stress concentrations in these regions.
In many cases the geometry and mechanics of large structures allow the characteristics and spatial distribution of smaller structures to be predicted. For example, if the geometry and dimensions of a lava bed or regional strike-slip fault are known, the geometry of accompanying fractures can be inferred. Geological and mechanical analyses together can identify stress concentrations in the earth's crust, describe the nature of the stress concentrations, and yield useful descriptions of the fracture distributions. This approach is an economical way to estimate fracture heterogeneity in an aquifer or reservoir because it does not
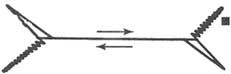
FIGURE 2.11 Map showing small faults and associated structures. From Rispoli (1981). The correspondence between the locations of the increasing and decreasing mean stress values near the fracture tips in Figure 2.10b and the dilating and constricting structures around the natural faults is remarkable.
require expensive equipment or large numbers of personnel. It can also be used in conjunction with the tools described in other parts of this report. It should be noted, however, that the task of predicting subsurface fractures is more difficult in complexly deformed areas and, obviously, when information about the regional structures is limited.
FRACTURE PROPAGATION AND INTERNAL STRUCTURES
The stress field around the fracture tip controls fracture propagation (Figure 2.8) and is characterized by a stress intensity factor (Km), which is a function of the applied stress and the fracture geometry (Equation 2.2). Each fracture mode (I, II, and III) referred to previously has a particular stress intensity factor (KI, KII, and KIII), that can be calculated (Lawn and Wilshaw, 1975). According to linear elastic fracture mechanics, a fracture will propagate when the stress intensity factor exceeds a critical stress intensity factor or fracture toughness (KIC, KIIC, and KIIIC), which is assumed to be a material property and expresses the intrinsic resistance to fracture propagation. For mode I loading the circumferential tensile stress at a small distance from the fracture tip is largest in the plane of the fracture. Therefore, joints propagate in their own plane perpendicular to the direction of the greatest tension near the joint front. As noted earlier (Figures 2.6 and 2.7), an absolute remote tensile load is not required for joint formation. Remote compressive loads can induce localized tensile stresses, as can the presence of flaws with high fluid pressure (Secor, 1965, 1968; Hubbert, 1972; Price, 1974).
The formation and propagation mechanisms of shearing-mode fractures are enigmatic. Although fracture toughnesses for mode II and mode III (KIIC, KIIIC) fractures exist conceptually, they have not been measured reliably in the laboratory, and it is not completely clear how they influence faults that link together by opening-mode fractures (e.g., Segall and Pollard, 1983b).
As a fault propagates, slip on it increases, and this fact has important hydrologic effects. Few faults in nature and few shear fractures in laboratories slip without significantly deforming either the material between the sliding surfaces or the adjacent wall rock. Slip commonly results in zones of brecciated rock and zones of gouge along faults. Zones of breccia can have relatively high hydraulic conductivities. Gouge zones, in contrast, tend to be highly impermeable. Breccia zones and gouge zones for large faults can reach hundreds of meters in thickness. As a result, portions of some faults are extremely conductive while others are practically impermeable. In addition, fault slip commonly juxtaposes different types of rocks. This can cause the hydraulic character of opposing sides of a fault to differ sharply.
The style of fault formation depends on the stress state during slip and on the lithologic and physical properties of the host rock. For example, faulting in porous sandstone occurs by a combination of collapsing of pores and fragmenta-
tion of sand grains (Engelder, 1974; Aydin, 1978; Jamison and Stearns, 1982; Figure 2.9b). This deformation is localized into a narrow band (Figure 2.12a, b) in which grain size, porosity, and permeability can be markedly reduced. The reduction in permeability perpendicular to a narrow zone of deformation bands may be as large as three orders of magnitude (Pittman, 1981; Seeburger et al., 1991; Logan, 1992; Antonellini and Aydin, 1994).
In laboratory compression tests on low-porosity rocks such as granite, shear fractures form by a rather intricate process. First, en-echelon dilating microcracks open perpendicular to the direction of least compression; when these coalesce,
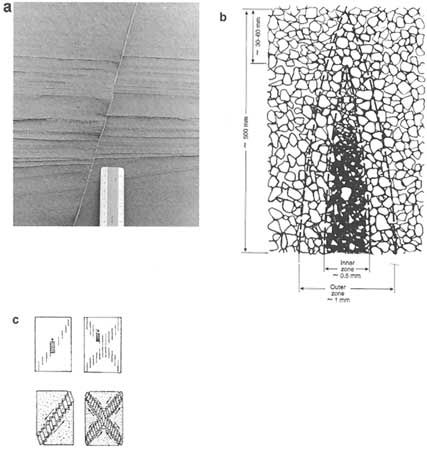
FIGURE 2.12 (a) A small fault in sandstone. From Aydin (1978). (b) Schematic drawing of the fault's tip showing the internal structures. From Aydin (1978). (c) A series of drawings showing the development of small faults in granitic rocks failed in compression tests. From Peng and Johnson (1972).
rock bridges between the cracks rotate and fail, and a shear fracture results (Peng and Johnson, 1972; Horii and Nemat-Nasser, 1985; Reyes and Einstein, 1991), as shown in Figure 2.12c. The localization of microcracks during loading is fairly well understood (for a review see Einstein and Dershowitz, 1990) thanks to improved stiff loading frames and acoustic emission techniques (e.g., Lockner et al., 1992). The en-echelon arrangement of microcracks apparently reflects the fact that each microcrack influences the location of the next microcrack (Du and Aydin, 1991; Olson and Pollard, 1991; Reches and Lockner, 1994).
The mechanics of fault propagation, the nature of friction and slip on faults, and permeabilities across faults are still poorly understood (Rice, 1992, 1993). There is a great need to understand the micromechanical processes of faulting in a host of common geological media (e.g., unconsolidated sediments, shale, sandstone, limestone, granite), the localization of deformation into zones, and possible effects of deformation on fluid flow.
FRACTURE GEOMETRIES
The shapes and dimensions of natural fractures are not well known, partly because the entire extent of a fracture is extremely difficult to observe in three dimensions and partly because a significant effort has not been devoted to such observations. Below are summaries of available information on the geometry of single joints and faults.
Geometry of Single Joints
The geometry of a joint depends on how it propagates and terminates. As a result, joint geometry is controlled by such factors as the geometry of the fractured rock mass, loading conditions, and interactions with neighboring fractures. For example, joints in layered rocks are commonly formed perpendicular to the layers. A joint is initiated at a flaw and propagates away from the flaw if sufficient energy is provided by the loading system. The joint in Figure 2.3a was initiated at a sedimentary irregularity on the bottom of a layer, whereupon the fracture propagates with a nearly semicircular front. Once the propagation front reaches the top boundary of the layer, the front propagates laterally and becomes nearly perpendicular to bedding. This manner of propagation is common in sedimentary rocks (Bahat and Engelder, 1984; Engelder, 1987). Using joint surface features, Engelder and Lacazette (1990) described the growth of joints in siltstone-sandstone beds, which they interpreted in terms of a natural hydraulic fracturing mechanism. A long joint in a single thin layer can be depicted as rectangular, with a lateral dimension much larger than the vertical dimension. The lateral dimension of an individual joint is typically a few tens of meters to a few hundreds of meters. Laubach (1992), for example, presents data from the Frontier Formation in Wyoming that shows maximum joint lengths of about 40 m.
In layered rock masses, joint segments in adjacent layers commonly join to form a composite joint (Helgeson and Aydin, 1991) that presumably still has a roughly rectangular geometry (Figure 2.13). The existence of thin shale laminae between the layers may cause offsets and discontinuities in the composite joints, as illustrated in the figure. Thick shale units usually impede jointing, thereby causing the strata-bound joints, that is, joints contained in certain stratigraphic units.
In volcanic rocks, thermally driven joints form perpendicular to cooling surfaces. Individual joints are also composites of joint segments (Figure 2.14) formed by cycles of incremental growth. Their longest dimension (vertical in the figure) is also perpendicular to the cooling surface. For rocks emplaced at or near the earth's surface, the cooling surface is usually the upper and lower surfaces of the unit, so the longest dimension is usually vertical. For more
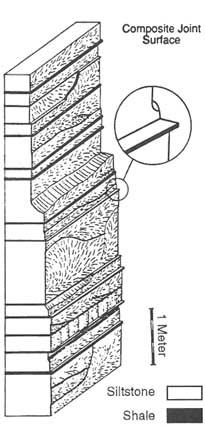
FIGURE 2.13 A composite joint surface in siltstone multilayers separated by thin shale laminae. From Helgeson and Aydin (1991).
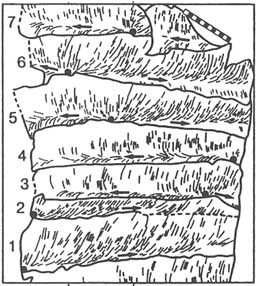
FIGURE 2.14 Addition of segments representing incremental growth of a cooling joint from a composite joint surface in a basaltic lava flow. From DeGraff and Aydin (1987).
information about the relationships among lava flow thickness, cooling rate, incremental growth, and joint dimensions, see DeGraff and Aydin (1993).
The geometries of single joints in massive rocks or very thick sedimentary layers have not been studied in a comprehensive manner but clearly can be complex. The patterns of surface markings on many joints in massive rocks resemble the pattern of Figure 2.3a, suggesting that the joints are initially circular or elliptical. As they grow, however, portions of the joints may twist out of plane, giving them an appearance vaguely similar to a multibladed screw propeller. Further growth of the joints occurs either by the propagation of a few of these segments or by new ''blades" twisting off the older ones. This twisting tends to develop most spectacularly in massive rocks, but it also occurs on a small scale in thinly layered rocks, with a fringe of fractures twisting out of plane along joint margins near bedding interfaces.
Interpreting the trace geometries of joints (i.e., the pattern of intersections between joints and the earth's surface) is somewhat problematic given that the three-dimensional geometry of joints in massive rocks is rarely known. Nonetheless, data on joint trace lengths commonly are collected to describe joint geometries because these data are accessible. Segall and Pollard (1983a) mapped a joint system (shown in Figure 2.15a) in the granitic rocks of the Sierra Nevada, California. The joint trace-length frequency distribution is of the form
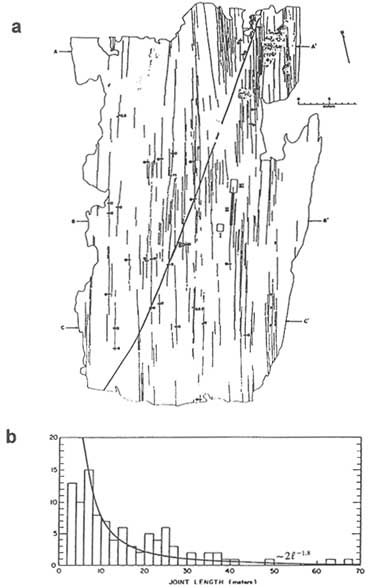
f(l) ~ (2l)-1.8, with the longest joint trace length being about 70 m. A distribution function obtained from another location has the form f (l) ~ (2l)-1.3 and apparently indicates a less developed state of fracturing.
Detailed studies of three-dimensional outcrops are necessary for deciphering the geometry of individual joints in both layered and massive rock bodies such as sandstone and granite. Experimental and theoretical models simulating three-dimensional joint growth under various environmental and loading conditions can be helpful in developing a conceptual framework for predicting joint geometry in the subsurface.
Geometry of Single Small Faults
The geometries of single small faults in certain ways resemble those of joints (Aydin, 1978; Segall and Pollard, 1980; Martel et al., 1988). The maximum in-plane dimensions of small faults are several tens of meters, and, like joints, the trace geometries of individual small faults are discontinuous. In other aspects the geometries differ. Small faults tend to be somewhat thicker than joints, which commonly are of hairline thickness. The trace geometry of a small fault is fairly straight when traversed along the direction of slip, but a wavy geometry is common in the direction perpendicular to slip (e.g., Aydin and Johnson, 1978; Power et al., 1987). New fractures of all modes can develop at the margin of a fault, and fault growth effects commonly complicate the geometry of a small fault. As a result, identification of fault ends and measurement of fault length become problematic. Thus, even though field observations on the outcrop scale of small individual faults (Aydin, 1978; Segall and Pollard, 1983a,b) suggest that they are usually short (i.e., several tens of meters), fault zones (discussed later) with large displacements can be much longer.
FRACTURE SETS
Fracture sets comprise a number of approximately parallel fractures of the same type and age. Fracture sets can be described by the areal and vertical extent, the spacing or density of individual fractures, and the orientation distribution. This information can be used to assess the physical connections between individual fractures, which influences fluid flow. Determination of fracture aperture, which, as noted previously, is the size of the opening measured normal to the fracture walls, is problematic because the original fracture opening is rarely preserved. For the purpose of present-day fluid flow, present fracture aperture distribution is important and is addressed in the next chapter.
Among the physical characteristics of fracture sets, the spacing of individual fractures (particularly for joints) has attracted the most attention. Many workers (Lachenbruch, 1962; Price, 1966; Hobbs, 1967; Ladiera and Price, 1981; Verbeek and Grout, 1984; Narr and Suppe, 1991) contend that the spacing of joints is
proportional to the thickness of the fractured layer as displayed by the field data in Figure 2.16. Also, it has been suggested that joint spacing depends on the elastic properties of rocks (Price, 1966; Hobbs, 1967). For example, the joint spacing of coal cleats is smaller than that of less stiff rock of comparable thickness.
Although joint-spacing laws of various forms have been proposed, recent experimental and numerical studies (Wu and Pollard, 1991; Rives et al., 1992) suggest that joint spacing evolves with time, strain magnitude, strain rate, and loading cycle (Figure 2.17). These studies suggest that joint spacing decreases with increasing total strain, increasing number of loading cycles and decreasing strain rate. It has also been suggested that in some cases joint spacing may evolve spatially by selective growth of some joints (Geyer and Nemat-Nasser, 1982; Dershowitz and Einstein, 1988; Pollard and Aydin, 1988; DeGraff and Aydin, 1993). The process of selective growth is influenced by the initial distribution of flaws and the propagation and interaction of joints. Even though joint spacing evolves with increasing joint development, present experimental results suggest the existence of final limiting values for well-developed joint systems (Wu and Pollard, 1991). Joint spacing is one of the most crucial parameters for fracture flow. The evolution of joint spacing distribution in terms of the mechanical factors referred to above needs to be further studied by field, experimental, and theoretical means.
Fault Sets
Faults commonly form sets that have different geometric properties than joints. The reason for this fact is that the length and spacing of faults may be related to the magnitude of slip across the faults, and faults have much greater variation in the magnitude of slip than joints have variation in the magnitude
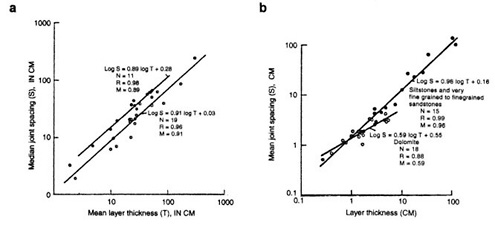
FIGURE 2.16 (a) Joint spacing-layer thickness relationship. (b) Joint spacing in different rock types. From Verbeek and Grout (1984).
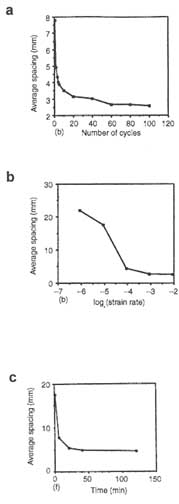
FIGURE 2.17 Variations of joint spacing as a function of (a) cyclic loading, (b) strain rate, and (c) time. From Wu and Pollard (1991).
of dilation. Recently, attempts have been made to characterize statistically the relationships between fault length and maximum slip (Walsh and Watterson, 1988; Marrett and Almendinger, 1991; Cowie and Scholz, 1992) and between fault length and frequency distribution (see, for example, Heffer and Bevan, 1990). Both relationships appear to be characterized by a power law across a broad range of scales. The development of faults is a complex process, and they may form by several mechanisms. So it only makes sense to compare fault lengths and spacings for faults that have formed in a similar manner.
Figure 2.18 shows the development of a fault set in granitic rock of the Sierra Nevada. Here, faults actually originated from joints (Segall and Pollard, 1983a). The initial spacing of the faults was controlled by the spacing of the joint set. Once developed, simple and compound fault zones (Figure 2.18) have their own particular slip, length, and spacing relationships.
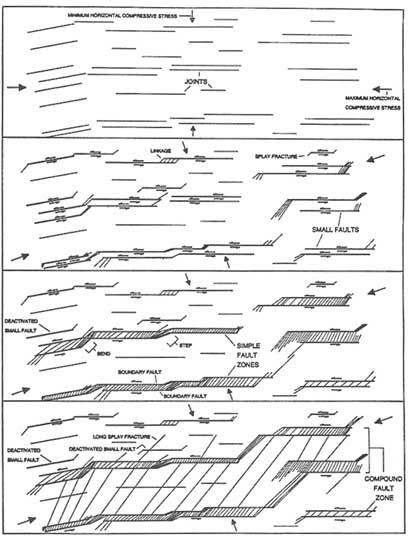
FIGURE 2.18 Schematic illustration of the development of strike-slip faults and strike-slip fault zones in granitic rocks of the Sierra Nevada, California. From Martel (1990).
INTERACTION AND LINKAGE OF JOINTS
Interaction between joints influences how they are spaced and clustered, their effective lengths, and hence their connectivities. For example, the horizontal dimensions of individual joints rarely exceed several tens of meters, as explained earlier. However, individual joints and other opening-mode fractures may be connected to form long linear arrays. Adjacent fractures may overlap slightly and link with a hook geometry over a broad range of scales (Figure 2.19). The geometry of overlap, and the existence of connecting fractures, is strongly influenced by, among other things, the state of stress (Olson and Pollard, 1991). If the differential regional stress is small (i.e., there is a nearly hydrostatic state of stress), the tendency of nearby fractures to interact and connect is strong (Figure 2.20). For a large differential stress the tendency for linkage is weak, so joint traces are straight and linear and overlap for long distances without being connected. The joints in such a system would be poorly connected, and the hydraulic communication between the joints would be low, even though individual joints are long and straight.
INTERACTION AND LINKAGE OF FAULTS
Faults commonly occur in en-echelon geometry at a broad range of scales (Segall and Pollard, 1980; Horii and Nemat-Nasser, 1985; Martel et al., 1988; Aydin and Schultz, 1990; Martel, 1990; Reyes and Einstein, 1991). Understanding the interaction and linkage between en-echelon faults is even more important for fluid flow than it is for en-echelon joints. The stepover zones along faults are broadly and pervasively fractured (Segall and Pollard, 1980). For example, the extensional stepover regions may form efficient conduits for fluids (Sibson, 1981; Aydin and Nur, 1982) in a direction perpendicular to shearing (Martel and Peterson, 1991). Large crustal-scale stepovers, however, may provide rather heterogeneous fluid flow pathways because of uneven internal fracture distribution.
There has been significant progress in understanding the mechanics of fault interactions in the past 15 years. The first papers on this topic were based on mechanical models that provided the stress fields associated with interacting faults (Rodgers, 1980; Segall and Pollard, 1980; Horii and Nemat-Nasser, 1985; Reyes and Einstein, 1991). These models have been used to interpret the observed deformation caused by fault interaction. For example, Figure 2.21 shows theoretical modeling results for the stress field around two en-echelon mode II fractures and field observations of secondary features at a real fault step. Note the increasing stress magnitudes at the overlap region and the orientations of the principal stresses. The secondary features observed in the field are located where the stresses are concentrated and are oriented consistent with the principal stresses
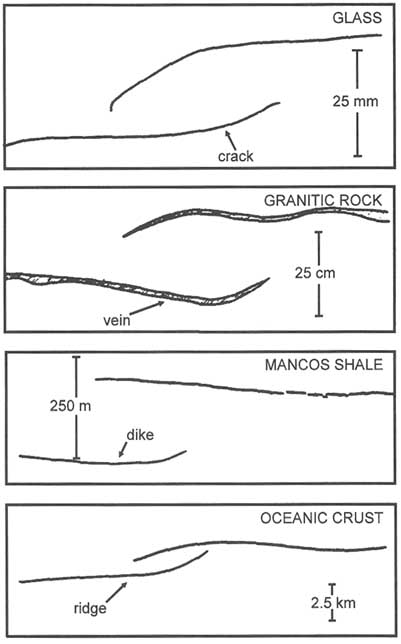
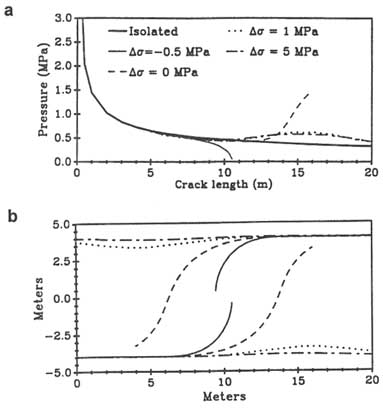
FIGURE 2.20 (a) Influence of the state of stress on the overlap and the linkage geometry of en-echelon fractures. (b) Various fracture paths for corresponding loading systems shown in a. From Olson and Pollard (1989).
(e.g., the calcite-filled cavities are parallel to and the cleavages (pressure solution surfaces) are perpendicular to the tick marks of Figure 2.21b).
It has been shown by field observation and field experiments that interaction zones can, in fact, contribute significantly to fluid flow (Sibson, 1981; Aydin et al., 1990; Martel and Peterson, 1991; see Chapter 8). The overlapping parts of en-echelon faults such as those illustrated in Figures 2.18 or 2.21c are regions of extension. Extensional regions tend to form extensional fractures (mode I), which are good conduits for flow because they are open. These open fractures tend to be oriented parallel to the intermediate stress direction responsible for faulting. Thus, permeability will be enhanced in that direction unless these features are completely filled with precipitates such as calcite or quartz. It is common to observe rhomboidal-shaped veins in fault steps; they are a record of old flow regimes in these extensional regions.
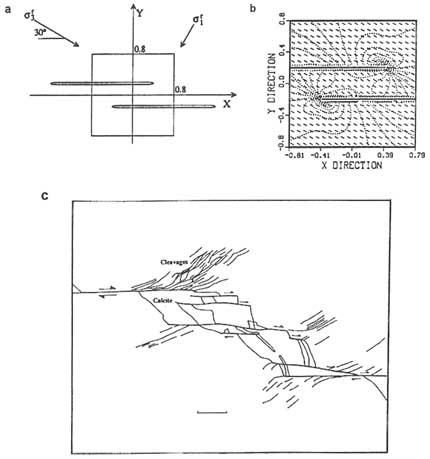
FIGURE 2.21 (a) Loading configuration. (b) Stress distribution around two en-echelon mode II fractures in an elastic plate subjected to biaxial compressive principal stresses. Contours (dotted) indicate the relative magnitude and tick marks the orientation of the principal compressive stress. (c) An array of en-echelon faults and the associated secondary structures. The calcite fillings at the extensional steps and pressure solution cleavages in the contractional quadrants are consistent with the stress field shown in b. Friction on the faults is assumed to be 0.6. The scale indicator at bottom center in (c) represents 0.5 mm. From Ohlmacher (1991).
A reversal in the direction of movement of the faults in Figures 2.18 or 2.21c would change the extensional regions to compressional regions. The permeability of compressional regions is not well understood, but compression may cause extensional fractures and thus increase permeability locally. Although it is known that extensional fractures tend to form in complex faults, it is not known
how they intersect and connect in three dimensions to form networks for fluid flow. A general rule is that the overlapping parts of the en-echelon faults and the area between them under extension may provide fluid pathways and that the direction of high permeability tends to be that of the intermediate principal stress unless these features are completely filled by mineral precipitates.
FRACTURE ZONES
Joints and faults commonly occur in sets localized into narrow tabular bands. In fact, many topographic lineaments mentioned in the literature with horizontal lengths of several tens of kilometers (Wise, 1976; Nur, 1982) are actually fracture zones. These zones are important for fluid flow because of their great extent, connectivity, and conductivity and will be described in detail in this section.
Joint Zones
Joint zones occur in all rock types. Figures 2.22 to 2.25 illustrate many examples from clastic rocks of the Colorado Plateau. Joint zones in the sandstones of the Colorado Plateau have been described by many investigators, each using a slightly different terminology (joint zones by Hodgson, 1961, and Engelder, 1987; zoned joints by Dyer, 1983; joint swarms by Laubach, 1991; and joint zones or fracture swarms by Cruikshank and Aydin, 1994). Some of the structures appear to be different both geometrically and perhaps genetically. For example, Hodgson's joint zones, based on his schematic diagrams (e.g., his Figure 12), contain few joints with short overlaps and appear to be related to either breakdown of parent joints (segmentation of an initially continuous joint) or progressive formation of an array of en-echelon joints. Dyer's zoned joints include a few parallel or highly overlapped joints (Figure 2.23). Laubach's joint swarms represent a cluster of many joints, some of which have strikingly different orientations (Figure 2.24). Hodgson's and Dyer's joint zones are systematic with regular spacing that is weakly related to the thickness of the fractured units; Laubach's swarms are not as systematic and appear to have highly variable widths. The joint zones described by Cruikshank and Aydin are localized and limited in extent with respect to other joints in the network. The geometry of this type of joint zone depends on structure, geology, and deformation history (slip along preexisting joints and bedding planes).
Many mechanisms may be responsible for the zonal character of joints. One of them, breakdown or segmentation of a parent joint (Pollard et al., 1982), is well known. Dyer (1983) proposed that the crack-tip stress field ahead of a propagating joint and some lithologic factors were responsible for the clustering he observed. On the basis of numerical modeling, Olson (1990) suggested that the propagation velocity of fractures may cause joint localization. Specifically, the more sensitive the fracture propagation velocity is to the degree of the stress
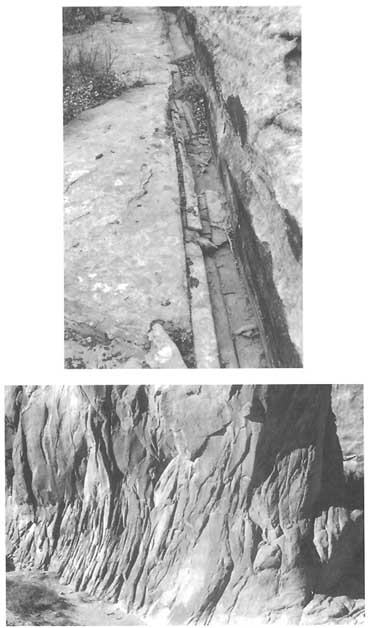
FIGURE 2.23 Zoned joints in sandstone. Note two zones each with about two parallel joint traces. From Dyer (1983).
concentration at the fracture tip, the more common the fracture clustering. This notion was later exploited by Renshaw and Pollard (1994), who numerically produced systematic joint zones (Figure 2.25) controlled primarily by the sensitivity of the propagation velocity of the model fractures to the magnitude of the stress concentration.
It is difficult to test the dependence of zonal formation of joints on the fracture propagation velocity in natural conditions. However, data on the effects of fracturing rate on fracture localization are available from cooling joints. DeGraff and Aydin (1987) proposed that fan-shaped cooling fractures (Figure 2.26a, b) with much smaller spacings (compared to existing fractures) form when surface water infiltrates into growing fractures; the infiltration of water accelerates the rate of cooling, thermal stressing, and, consequently, fracturing.
Available knowledge of the geometry of, and mechanisms for, joint zones is inadequate. Because the contribution of fracture zones to the fluid flow in fractured rocks may be substantial. A better understanding of this subject is needed.
Fault Zones
Fault zones are invariably heterogeneous. Although commonly depicted as planar, most fault zones contain series of segments that are not coplanar (Scholz, 1990). Thus, the overall shape of a fault zone is somewhat irregular, and its thickness is variable. Both opening-mode and shearing-mode fractures are common in fault zones, and the orientation and distribution of these fractures are typically nonuniform. The composition of fault zones also can be heterogeneous, with blocks of sparsely fractured rock juxtaposed against lenses of gouge (mechanically and/or chemically altered fine-grained material). A variety of precipitated minerals is common in fractures and cavities along fault zones. The heterogeneous structure and composition of fault zones result in heterogeneous hydraulic properties (Caine et al., 1993; Forster et al., 1994).
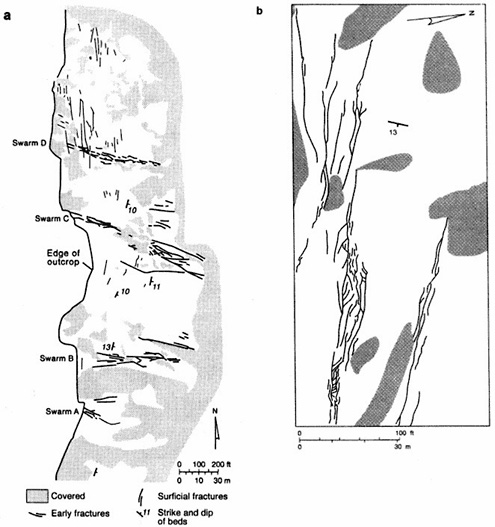
FIGURE 2.24 (a) Map showing patterns of joint swarms in sandstone. From Laubach (1991). (b) Details of swarm D in the map. From Laubach (1992).
We understand at a general level some causes of the heterogeneous structure of fault zones. Variations in the overall shape of a fault zone contribute to markedly heterogeneous stress fields along a fault zone (e.g., Segall and Pollard, 1980; Bilham and King, 1989), and this heterogeneity leads to a nonuniform fracture distribution. In addition, as stress fields change through time, fault zones can be reactivated and as a result develop increasingly intricate and varied distributions of fractures. The positions, orientations, and spacings of major slip surfaces in many fault zones are dictated largely by preexisting macroscopic flaws. Fault zones in sedimentary rocks commonly initiate and form along bedding planes (e.g., Boyer and Elliot, 1982). Fault zones in granites and metamorphic
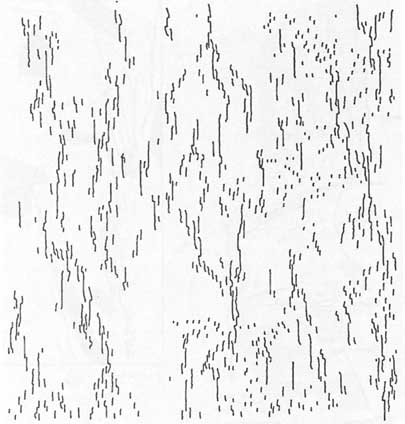
FIGURE 2.25 Numerically produced joint zone network. From Renshaw and Pollard (1994).
rocks commonly form along preexisting planes of weakness such as compositional layering (Brown et al., 1989), metamorphic foliations (e.g., Choukrone and Gapais, 1983), joints (Segall and Pollard, 1983a,b; Martel et al., 1988), and dikes (Lisle, 1989; Martel and Peterson, 1991). Faults in the volcanic rocks of Yucca Mountain in Nevada appear to form along preexisting cooling joints (U.S. Geological Survey, 1984). Because macroscopic planes of weakness are inherent in most rock masses, they strongly influence how fault zones develop.
Fracturing along fault zones tends to evolve differently in different rock types. For example, fault zones in some sandstones develop by the sequential formation of closely spaced small faults (Figure 2.27a,b). The resulting fault zone can contain many small faults that collectively form a thick mass of crushed, low-permeability material (Aydin and Johnson, 1978; Antonellini and Aydin,
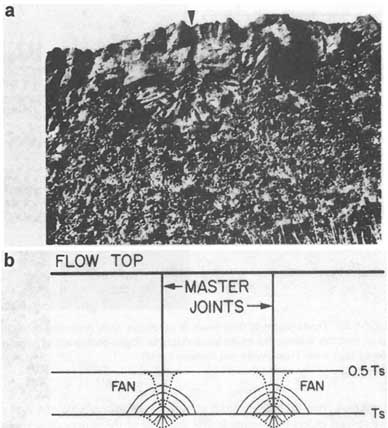
FIGURE 2.26 (a) Photograph of fan-shaped cooling joints in basaltic lava flow. (b) Schematic diagram showing joint formation by accelerated cooling, perhaps caused by additional surface water. From DeGraff and Aydin (1987).
1994). A different style of fracturing has been documented (Martel et al., 1988) in some massive granitic rocks where fault zones formed as preexisting non-coplanar faults were linked by oblique fractures (Figure 2.28). A third style of fracturing has been documented in clay cakes deformed in the laboratory (Figure 2.29). The clay cake faults develop as a series of fractures form and then coalesce (Riedel, 1929; Wilcox et al., 1973); the resulting pattern resembles the fracture pattern observed along many natural faults (Skempton, 1966; Tchalenko, 1970; Wilcox et al., 1973). These findings collectively suggest that the grain-scale structure and lithology of rocks influences fault zone formation.
The hydraulic properties of fault zones tend to vary with rock type, consistent with differences in the inherent macroscopic flaws and grain-scale fabrics in
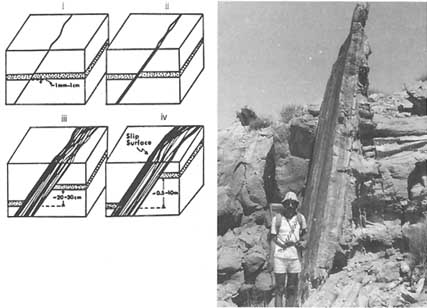
FIGURE 2.27 Development of fault zones in sandstone. Left, sequential development of a fault structure is illustrated by the block diagrams. Right, photograph of a fairly well-developed fault zone. From Aydin and Johnson (1978).
different rock types. In highly porous sandstones the permeability of a fault zone can be several orders of magnitude less than that of the surrounding sandstone (Antonellini and Aydin, 1994). Nonconductive faults, also referred to as sealing faults, are widely recognized by the oil and gas industry to cause pronounced flow heterogeneities in porous clastic rocks. In contrast, in low porosity rocks the permeability of a fault zone tends to exceed the permeability of the host rock. For example, large-scale field tests (e.g., Black et al., 1990) demonstrate that the average hydraulic conductivity of fault zones in granitic rocks is three or four orders of magnitude higher than that in unfaulted granite and can approach the hydraulic conductivity of fine-grained sandstone. These conductivity contrasts can dominate the subsurface hydrology.
The hydraulic properties of an individual fault zone can vary significantly as a function of position along the zone. The distribution of fractures and fracture-filling materials are prime factors affecting hydraulic heterogeneity. Field measurements (e.g., Power et al., 1987) and laboratory tests (Tsang and Witherspoon, 1981) indicate that the conductivity of an individual slip surface will vary depending on the detailed shape of the surface and the magnitude of the local compressive stress acting across it.
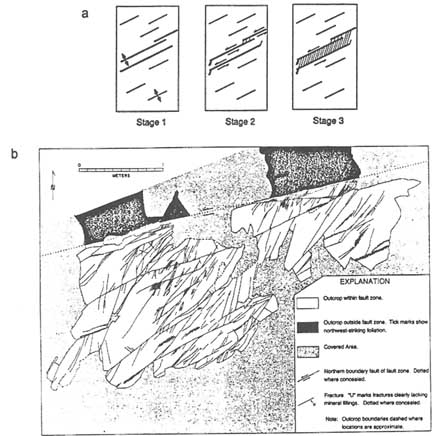
FIGURE 2.28 Development of fault zones in granitic rocks. (a) The structures and their sequential development in three stages. From Martel et al. (1988). (b) A well-developed fault zone and its internal fractures. From Martel (1990).
MULTIPLE SETS OF FRACTURES
The formation of one fracture set promotes and controls the initiation of additional sets by providing new stress concentrators and barriers for the deforming system in a changing stress regime. It is, therefore, not surprising that the occurrence of multiple sets of fractures is the rule rather than the exception. Patterns of multiple joint sets are markedly different from those of faults.
Multiple-Joint Patterns
The simplest multiple-joint patterns comprise two sets. Possible geometries for this case are shown schematically in Figure 2.30a-f. Where shorter and
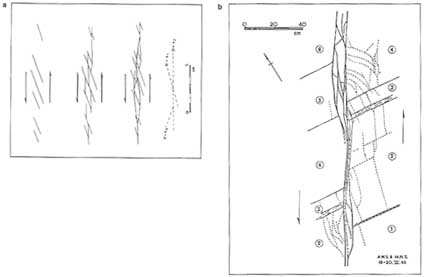
FIGURE 2.29 Development of fault zones in pelitic rocks. (a) Sequential development of structures in a clay cake. (b) A natural fault zone mapped in the field. From Skempton (1966).
discontinuous fractures about longer and more continuous fractures, the sequence of fracturing is generally easy to interpret; the shorter set formed after the longer set. In isotropic rocks, if the intersection angle is nonorthogonal, the second set formed under a different stress system, because joints form along a principal plane and, by definition, the principal planes are orthogonal for a given loading system. The two orthogonal sets may be formed simultaneously, however, because both orientations could lie in the principal planes. A situation in which one joint set crosses the other without any deflection or stepping is not possible if the older set was open at the time the younger set formed. However, such cross-cutting may occur in two cases: (1) when the first set is under a large normal compression, which results in a high resistance to slip in the plane of these fractures (Renshaw and Pollard, 1994), and (2) when the older fractures are filled with minerals during the younger propagation event and thus do not constitute void spaces. Two orthogonal joint sets are frequently observed in nature, but this pattern is but one of the many possible patterns.
Joint patterns comprising more than two sets also can exist. Perhaps the simplest of these is a polygonal pattern produced by shrinkage during cooling or drying processes (Figure 2.30i–j). These joints form sequentially in cooling lavas. They are initially four sided but evolve to yield a hexagonal pattern in the interior of a flow, where the thermal stress field is approximately homogeneous
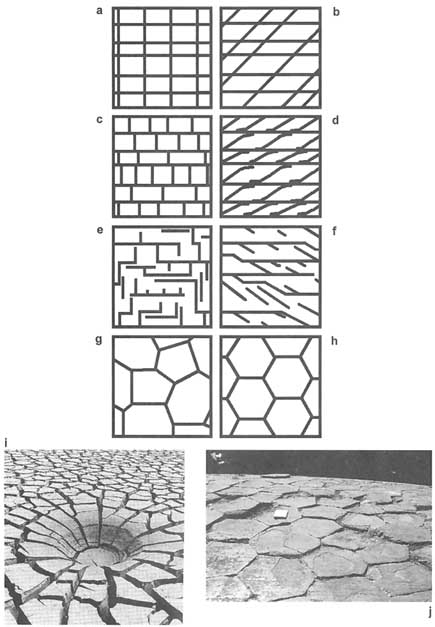
FIGURE 2.30 (a–h) Schematic illustration of major multiple-joint patterns. From Pollard and Aydin (1988). (a–f) Two joint sets with different intersection angles. (g–h) Polygonal joint patterns. (i–j) Polygonal fracture patterns in mud (from Birkeland and Larsen, 1989) and lava (from Aydin and DeGraff, 1988).
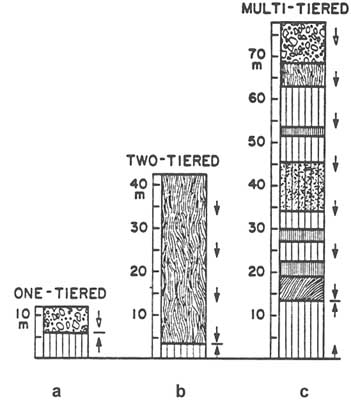
FIGURE 2.31 Fracture patterns in lava flows. From DeGraff (1987). (a) Thin flow with one-tiered columnar joints. (b) Two-tiered flow. (c) Multitiered flows. Arrows indicate vertical fracture propagation direction.
(Aydin and DeGraff, 1988). The size of hexagons and the spacing of joints are determined primarily by the rate of temperature change (DeGraff and Aydin, 1993). Because the top and bottom of a flow cool simultaneously but at different rates, joint spacing is different in the fractures formed by propagation from the top surface downward than in those formed by propagation from the bottom surface upward. These two ''tiers" are commonly distinguishable. For flows with a thickness of less than several meters, one tier dominates the joint pattern (Figure 2.31a). Flows with moderate thickness (up to 40 m) have two tiers (Figure 2.31b); the upper tier or entablature has smaller and less regular spacing, with an implication of a greater hydraulic conductivity of the fracture system, whereas the lower tier or colonnade has wider and consistently regular spacing. Spacing evolves from narrower to wider as the fracture systems grow from the top and bottom surfaces (DeGraff and Aydin, 1993). Because fracture conductance is
roughly proportional to the aperture cubed, a single fracture of aperture 2b is much more permeable than two fractures of aperture b. This, if the total fracture porosity is constant from the top to the bottom of a flow, the total hydraulic conductivity of the fracture system should increase from the top to the bottom. Other factors also affect the permeability of lava flows. The upper parts of many flows contain numerous vesicules formed by gas expansion during emplacement. These vesicules, if connected, will increase the hydraulic conductivity of the fracture system in the upper part of the flow (Wood and Fernandez, 1988) and possibly in the thin zone where the two tiers interact and meet. The intersection zone of the two-fracture system is schematically shown as a line in Figure 2.31b; however, in reality, this zone includes horizontal intersecting fractures. Some flows, especially those with greater thicknesses, are multitiered (Figure 2.31c). For multitiered flows the previous statements regarding joint spacing and the inferred relative conductivities of the uppermost and lowermost parts of the flow apply. However, the tiers in the inner parts of the flows may have variable joint spacings. Joint spacings in the inner parts of the flows are usually controlled by local environmental conditions, such as the availability of water cooling (Long and Wood, 1986; DeGraff et al., 1989). For multitiered flows the assessment of relative conductivities requires greater care.
Perhaps the most common environment for multiple-joint sets with more than two sets are terranes or plutons that have experienced multiple episodes of deformation (Spencer, 1959; Wise, 1964). It is difficult to identify a particular geometry for these occurrences, even though several have been suggested in the literature. Modeling fracture evolution in terranes with multiple deformation histories is hampered by the difficulty of determining proper boundary conditions and accounting for the possible effects of preexisting inhomogeneities.
Multiple-joint patterns may persist for several kilometers in the horizontal direction. In most cases, however, the orientations and angular relationships between joint sets change from one area to another, producing various domains with spatially distinctive patterns (Figure 2.32a) presumably related to the spatial and temporal inhomogeneities in the stress field during the development of fracture systems. In Figure 2.32b, which shows a fracture network in the Arches National Park, intersecting relationships suggest a progression of fracturing from the bottom right side to the top left side of the photograph. Based on the rule that opening fractures form perpendicular to the least principal stress, it can be inferred that the orientation of the least principal stress has changed, as shown schematically by the arrows in Figure 2.32c. The existence of several distinct joint domains on the flanks of a salt anticline in Arches National Park, Utah, indicates that such changes have occurred frequently there (Cruikshank and Aydin, 1995). It has been suggested that the diagenetic history of jointed rock also plays a role in sequential fracturing (Lorenz and Laubach, 1994).
There is evidence that joint orientation also changes vertically from one rock unit to another (Helgeson and Aydin, 1991; Figure 2.33). This makes it difficult
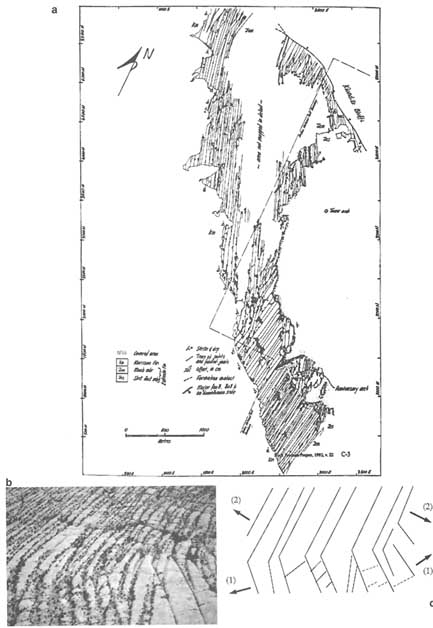
FIGURE 2.32 (a) Joint domains on the flanks of a salt anticline in the Arches National Park, Utah. From Cruikshank and Aydin (1995). (b) Photograph of two adjacent joint domains in the upper left part of the map. Photo by A. Aydin. (c) Two stress orientations (1 and 2) thought to be responsible for the systematic joint sets defining the two domains.
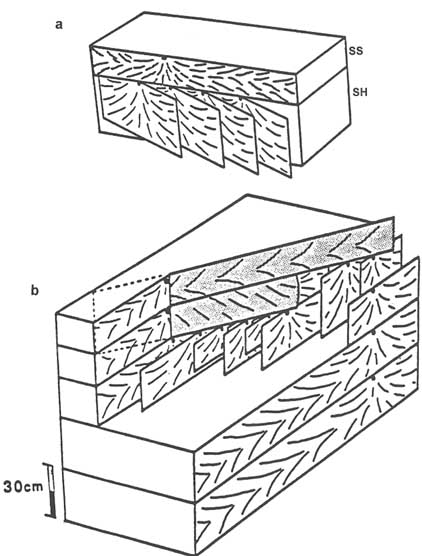
FIGURE 2.33 Block diagrams showing vertically changing joint orientation. From Helgeson and Aydin (1991). (a) Relatively simple system showing a new set of joints forming at the lower front of a previous joint. (b) A more complicated fracture evolution in which new joints initiate at the lower lateral fronts of the previous joints.
to project the orientation of a joint set at the surface to underlying units. It also reduces the vertical conductivity of joints because of the limited contact area among joints in different orientations.
One of the crucial tasks remaining for better understanding of multiple-joint patterns is the possible causes for changes in the orientation of joint sets to produce distinctive joint domains. A survey of fracture patterns in various sandstone formations of the Colorado Plateau and experimental simulation of the formation and geometric characteristics of fracture domains indicate that fracture domain boundaries provide the best fracture connectivity. Primary fracture sets with different orientations can be well connected there. Furthermore, secondary fracture sets usually are more closely spaced in the domain boundaries. Consequently, domain boundaries can be areas of enhanced hydraulic conductivity.
Multiple Fault Patterns
Faults show the most diversity of all the fracture patterns; consequently, they are poorly understood. The overview here describes a few of the most commonly observed fault patterns and the associated fracturing.
Normal Faults
In map view, normal faults appear either as parallel traces or as pairs of parallel traces with zigzag geometries (Figure 2.34a, b) corresponding to either plane strain or three-dimensional strain, respectively (Aydin and Reches, 1982; Reches, 1983). Figure 2.34c depicts fracture pattern in the Austin Chalk in Texas that appears to suggest plane-strain deformation because of the existence of two sets of normal faults. This concept of plane-strain deformation is probably applicable also to conjugate fault patterns of other major fault types.
Sand box and clay cake experiments are commonly used to simulate faulting (Riedel, 1929; Cloos, 1955; Naylor et al., 1986; McClay and Ellis, 1987). These experiments have been successful in reproducing patterns observed in nature (e.g., Figure 2.35a). They are also useful for visual demonstration of particular faulting styles and for testing the validity of certain boundary conditions and fault geometries. Numerical models also have been used to simulate normal fault geometries. Figure 2.35b illustrates a distinct element model developed by Saltzer (1992) and Saltzer and Pollard (1992) that accounts for the inhomogeneous and blocky nature of deforming rock. This model has promise for generating realistic normal fault patterns and for testing the role of boundary conditions in experimentally produced fault systems.
Listric faults (Figure 2.36) are intricate networks of normal faults that cut deep into the crust and decrease in dip with depth (Proffett and Dilles, 1984). The deep subhorizontal portion of a listric fault is commonly referred to as a detachment fault. Above the detachment fault is a series of steeply dipping faults
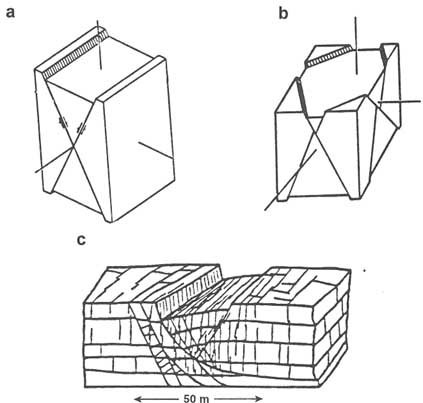
FIGURE 2.34 (a) Two sets of normal faults for plane-strain deformation. (b) Four sets of normal faults accommodating three-dimensional strain. (c) Fracture pattern that includes two sets of faults and one set of joints bisecting the fault sets in the Austin Chalk. Parts a and b from Reches (1983); (c) from Friedman and Wiltschko (1992).
that define a series of wedge-shaped blocks (Xiao et al., 1991). The sizes of these blocks seem to be controlled by material properties and the forces driving the faulting. New sets of high-angle normal faults may be added to the system if the old ones rotate enough and become inactive (McKenzie and Jackson, 1986; Nur et al., 1986). Paleomagnetic techniques (Nur et al., 1986) have been used successfully to determine the amount of rotation in many regions. The magnitude of the rotation is controlled primarily by the amount of slip across the faults.
The spacing of normal faults is more complex than that of joints. However, the thickness of the faulted unit is still an important factor; that is, larger spacing is expected for normal faults in thicker units (Mandl, 1988). Normal faults are commonly segmented like other fracture types and have complicated interaction features (Schwartz and Coppersmith, 1984; Wu and Bruhn, 1992; Antonellini,
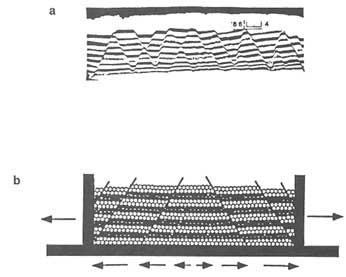
FIGURE 2.35 (a) A normal fault pattern produced experimentally in a sand box. From McClay and Ellis (1987). (b) A normal fault pattern produced by the distinct element model simulating the boundary conditions in the sand box experiment above. From Saltzer (1992).
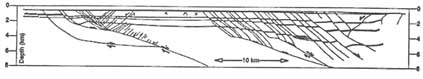
FIGURE 2.36 Normal fault patterns in cross section (seismic profile from Xiao et al., 1991).
1992). The nature of these geometries and the underlying mechanics of normal fault interaction are poorly known.
Normal faults accommodate extension in the earth's crust. As a result, intuition suggests that there may be openings along normal fault systems that are greater than those of other fracture systems and that might be especially conductive, but these relationships have not been demonstrated. However, it has been suggested (Sibson, 1981; Moore and Vrolijk, 1992) that it is easier to have hydrofracturing in environments conducive to normal faulting.
Thrust Faults
The geometry of thrust faults also tends to be complex, especially as viewed in cross section perpendicular to a fault strike. Many thrust fault systems contain
a series of imbricate faults that merge into a subhorizontal fault at depth. The location of this deep subhorizontal detachment fault is usually controlled stratigraphically (Figure 2.37a). A thrust system commonly contains other stratigraphically controlled subhorizonal faults that are linked by more steeply inclined imbricate faults (e.g., lower-right portion of Figure 2.37a). This geometry has been detected in ancient as well as tectonically active environments (Figure 2.37b). The dip angle and perhaps the spacing of the major thrust faults are influenced by several parameters, including the friction coefficient and fluid pressure along the detachment faults and the fluid pressure in thrust sheets (Suppe, 1985).
The transport of fluids along the low-angle detachment zone, or decollement, and related imbricate faults has been demonstrated in submarine accretionary environments (see Moore and Vrolijk, 1992, for a review). It has been estimated that the velocity of channelized fluid flow along thrust faults in accretionary environments is three to four orders of magnitude faster than the flow through the matrix sediments. The hydrology of accretionary wedges has been modeled
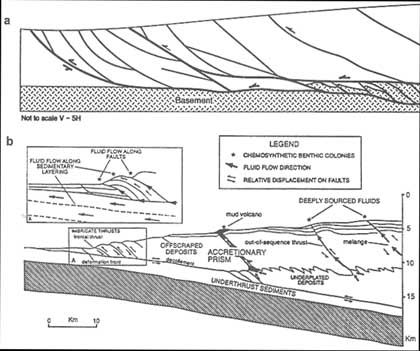
FIGURE 2.37 (a) An idealized pattern of thrust faults. From Boyer and Elliot (1982). (b) Idealized pattern of faults in an accretionary wedge and the pattern of fluid migration. From Moore and Vrolijk (1992).
numerically (Henry and Le Pichon, 1991; Henry and Wang, 1991). However, the details of fluid flow are poorly understood because fluid transport appears to be episodic and because the architecture of the fault zones and the fracture conductance distributions are not well known. Moore et al. (1988) suggested that fractures in the fault zones dilate episodically under high fluid pressure, producing an interconnected network responsible for fluid transport. Fluid transport can then cause the faults to seal, which allows the fluid pressure to build up and dilate the fault.
The geometry of the fractures in the wedges between the faults must be determined to understand the fracture distribution of a reservoir or aquifer in a thrust setting (Figures 2.36 and 2.37). At this scale, as pointed out by Price (1988), an ensemble of small-scale structures of various types, including deformed bedding planes, have complex geometric and temporal relationships. One example is a thrust sheet in the Appalachian Mountains where shearing and dilating fractures were mapped (Ohlmacher and Aydin, 1995; Figure 2.38). Small shearing fractures commonly occur subparallel to bedding interfaces, producing openings at the stepover areas known as pull-aparts (see Figure 2.21c). These openings are filled by minerals. Recurrent shear motions along the fractures reopen the fractures, and a new layer of mineralization is precipitated, which may be inferred as evidence of an episodic flow system. A network of veins or filled dilating fractures perpendicular to the shearing fractures (Figures 2.38a–d) also is common.
A similar structural assemblage is observed with intermediate-sized thrust faults that cut across bedding (Figures 2.38b, e) where offsets are several tens of meters. Normal and strike-slip faults may form at an oblique angle to low-angle thrust faults in larger-scale fault systems (Figure 2.38c, f). Different fracture networks develop for certain structural assemblages at different scales during deformation. An understanding of this hierarchy of the networks would be useful for efforts to understand larger fractures in thrust belts. Identifying other commonly occurring outcrop-scale patterns should improve the ability to visualize internal structures of aquifers, reservoirs, and waste disposal sites and to interpret the geophysical data discussed in Chapter 4 of this report.
Strike-Slip Faults
Strike-slip faults have some geometric similarities to joints. They are both usually vertical and form a series of parallel or subparallel traces with en-echelon geometry in map view. The spacing of the faults is not well understood, but crustal-scale examples suggest that it is somewhat related to the thickness of the faulted unit as it is for other fractures. Complexities in the geometries of strike-slip faults occur at bends along fault traces and at discontinuities between the fault segments. Complex faulting also occurs in the areas between parallel strike-slip faults.
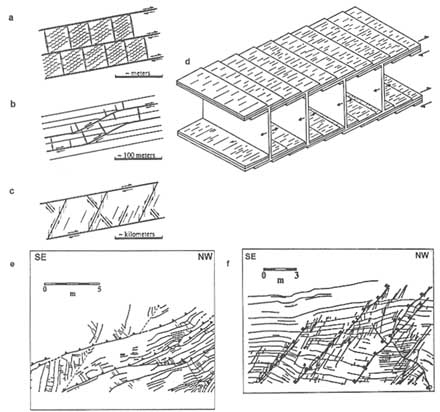
FIGURE 2.38 Fracture networks at different scales in a fold and thrust belts. From Ohlmacher and Aydin (1995). (a) Bedding interface faults and the connecting veins. (b) Intermediate-sized faults with offsets on the order of several meters cutting across bedding interfaces locally. (c) Large thrust faults with offsets larger than a few hundred meters forming a sheet deformed by a series of faults. (d) Array of en-echelon thrust faults at a low angle to the interfaces and veins perpendicular to the array; distance between parallel faults ranges from a few centimeters to several meters. (e) Map showing a thrust fault offsetting bedding and the axis of a syncline (dashed lines in the figure). (f) Map showing normal faults situated in a thrust sheet bounded by two thrust faults.
Interactions between en-echelon strike-slip faults produce a broad range of structures. These faults can be classified into two groups: those accommodating extension in extensional steps (Figure 2.39a) and those accommodating contraction in contractional steps (Figure 2.39b, c). Other examples with different modes of connecting fractures are provided in Figure 2.39c–e. The extensional steps and major overlapping faults are fluid pathways, as evidenced by the localization of veins, springs, and mud and magma volcanoes (Sibson, 1981; Aydin and Nur, 1982; Aydin et al., 1990).
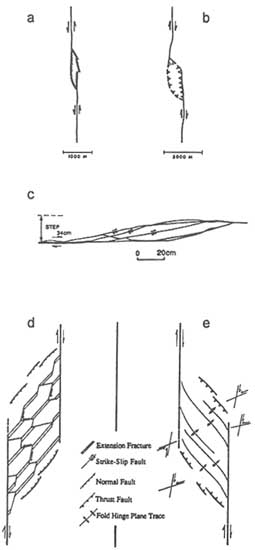
FIGURE 2.39 Examples of fault-interaction features in strike-slip faults. (a) Extensional step with connecting normal faults. From Aydin and Nur (1982). (b) Contractional step with connecting thrust faults. From Aydin and Nur (1982). (c) Contractional step with cross faults with the same kinematics as major en-echelon faults, right lateral strike-slip. From Cruikshank et al. (1991). (d) Extensional step. From Brown and Sibson (1989). (e) Contractional step. From Brown and Sibson (1989). Note the complex system of fractures proposed for the extensional step and a series of echelon folds observed in the contractional step.
Interactions between parallel strike-slip faults produce domains with characteristic fractures and faults. Figure 2.40a–c illustrates some outcrop-scale examples. Some additional examples are provided in Figure 2.41, where crustal-scale strike-slip faults occur in a variety of rock types. The map is a compilation showing fault patterns in the Greater San Francisco Bay Area. Some of the patterns attributed to fault interaction can be identified in this map. For example, the area between the Calaveras (CFZ) and the Hayward/Roger Creek (HFZ) faults is marked by an uplift, and the contractional structures are either subparallel or at an angle to the major strike-slip faults. Structures between parallel faults such as the San Andreas (SAFZ) and the San Gregorio-Hosgri (SG-HFZ) faults (Figure 2.41) are more complicated, but they can be considered a counterpart of the extensional structures between the parallel faults illustrated in Figure 2.40.
The mechanics of interaction and formation of structures associated with strike-slip stepovers have been studied by using two-dimensional models (e.g., Segall and Pollard, 1980). However, three-dimensional models will prove to be useful in addressing the change of the stress system and in predicting structures in the vertical dimension. This is particularly important because extensional steps may have significant fluid conductivity in the vertical direction. Together with field-based models, these numerical techniques are ripe for application.
SCALING UP FRACTURE PROPERTIES
As the foregoing discussion makes clear, fractures exist over a broad range of scales, from the scale of rock grains to the scale of tectonic plates. Intriguingly, fracture patterns at one scale are in many cases at least qualitatively similar to patterns at an entirely different scale (see, e.g., Figures 2.18, 2.20, 2.38, 2.39). The hierarchical similarities provide a rationale for extrapolating fracture pattern data from one scale, such as the scale of a borehole or outcrop, to another, such as that of a hydrocarbon reservoir. Fracture data generally are scaled up: details of fracture patterns are best resolved in small rock masses, yet the behavior of large rock masses is usually of greater interest.
Many investigators have examined how to quantitatively scale fracture data (e.g., LaPointe and Hudson, 1985; Turcotte, 1992; Cox and Wang, 1993; Gillespie et al., 1993; and references therein). Various fracture characteristics have been treated, such as trace length, orientation, spacing, clustering, surface roughness, and aperture. In addition to well-established geostatistical techniques based on semivariogram analysis (e.g., LaPointe and Hudson, 1985), the relatively new techniques of fractal analysis (Mandelbrot, 1982; Barton and Hsieh, 1989; Turcotte, 1992) have attracted considerable attention. In addition to quantitatively describing features that appear similar at different scales, fractal analyses are well suited to features that are in some way discontinuous; both factors make fractal analyses attractive in examining fractures. Fractal-like concepts have also been applied to the modeling of fluid flow in fractures (Barker, 1988).
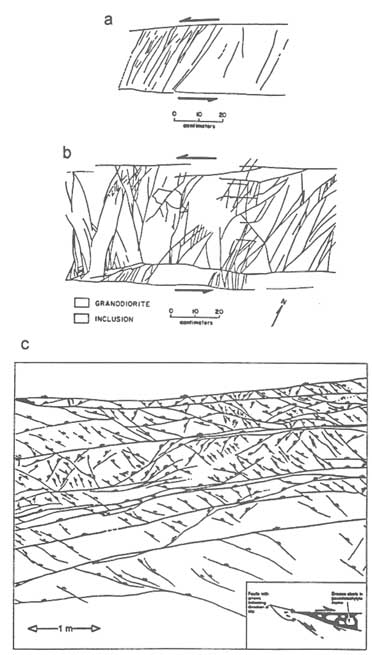
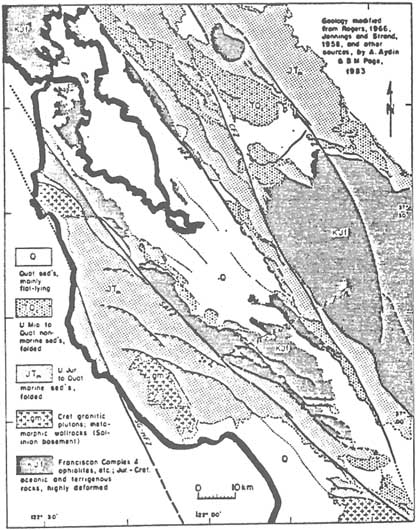
FIGURE 2.41 Geological map of the Greater San Francisco Bay Area (compiled by Aydin and Page, 1984) showing major strike-slip faults and their associated structures.
Fracture patterns typically have been described by using fractals in terms of the fractal dimension D, which quantifies the degree to which curves or surfaces fill space over a range of scales. Straight lines have a fractal dimension of 1, and planes have a fractal dimension of 2, but noninteger fractals are possible, too. Of the numerous applications of fractal analysis to fractures in rock (e.g., Scholz and Aviles, 1986; Power et al., 1987; Turcotte, 1992; Odling, 1992; Cox
and Wang, 1993; Gillespie et al., 1993), one of the most widely used is the box-counting method for determining the fractal dimension of fracture traces on a map (e.g., Barton and Hsieh, 1989). In this application a square mesh containing boxes of side length r is placed on a map of fracture traces, and the number of boxes Nr containing at least one fracture is tallied. This process is repeated for different mesh sizes, and log Nr is plotted against log (1/r). The spatial distribution of fracture traces is considered to have a unique fractal dimension D if the resulting plot is described well by a straight line of slope D (Figure 2.42). Not only can fracture trace lengths distributed according to a power law (e.g., Figure 2.15) be described with a constant fractal dimension (Gillespie et al., 1993), but fracture trace data collected at a variety of scales (Figure 2.42) have been fit by
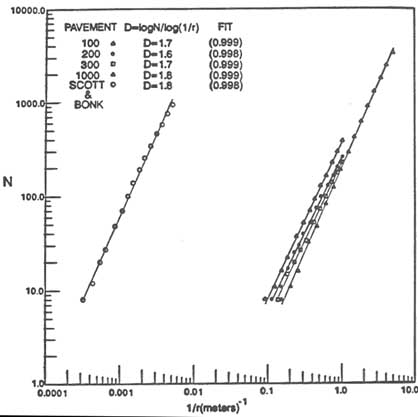
FIGURE 2.42 Fractal plots for fracture trace networks on pavements at Yucca Mountain, Nevada, mapped by Scott and Bonk (1984). The term N is the number of cells containing portions of at least one fracture trace, r is the length of a cell side in a given grid mesh, and D is the slope of the line on the plot of log N versus log (1/r). From Barton and Hsieh (1989).
a single fractal dimension (Barton and Hsieh, 1989). These findings suggest that fractal methods could be potent scaling tools.
Despite their potential power, however, the use of existing fractal methods to describe fracture patterns is still controversial for several reasons. For example, different fractal techniques generally give somewhat different fractal dimensions for a given data set (Cox and Wang, 1993). Even a single technique can yield different fractal dimensions. Box counting, for example, yields a fractal dimension that is sensitive to the orientation of the grid (Barton and Hsieh, 1989) and can change significantly with scale (Gillespie et al., 1993; Walsh and Watterson, 1993). There is also some debate as to the benefits of reducing to a single number the varied data on size distribution, orientation, linkage, spatial density, and roughness of natural fracture patterns (Gillespie et al., 1993). Perhaps one of the most problematic aspects of the technique is the difficulty in testing it rigorously. Cataloging all fractures of all scales in a large region is not feasible, and the individual fracture data sets used to calculate fractal dimensions usually span a scale range of no more than two orders of magnitude or so (e.g., Figure 2.42). Although individual data sets collected at different scales may appear to share a common fractal dimension, the collective data may not (Figure 2.43). For reasons such as these, many researchers still regard fractal analyses as experimental.
Proper scaling of the geometry and hydraulic properties of fractures remains a critical task. Current fractal methods may be useful for scaling certain fracture characteristics, but their use as rigorous quantitative tools is still controversial. Stochastic methods that blend aspects of deterministic mechanical methods and fractal scaling methods (Martel et al., 1991; see also Chapter 6) appear to be a promising avenue of research. Tests of fractal analyses on three-dimensional fracture data also will be enlightening.
IMPLICATIONS FOR FRACTURE NETWORK MODELS
All of the essential information about fractures should eventually be conceptualized in a model such as those discussed in Chapter 6 (Figures 6.11–6.14). This conceptualization should include the important variations for natural fractures. For example, since various fracture types have different flow properties, care should be taken in representing fracture types in models. Natural fractures have inhomogeneous distributions of densities and apertures, even along a single fracture. Fractures with the same fluid flow properties along their entire lengths, or large blocks of unfractured matrix between broadly spaced faults, probably do not exist (Nelson, 1987). Not all the natural fractures in a network are identical. Localized fracture zones are important and in some cases may provide almost all the yield, as illustrated in other chapters of this report. The behavior of the matrix at a fracture surface may be different from one fracture type to another and, for the same fracture type, from one rock type to another. Finally, the effects
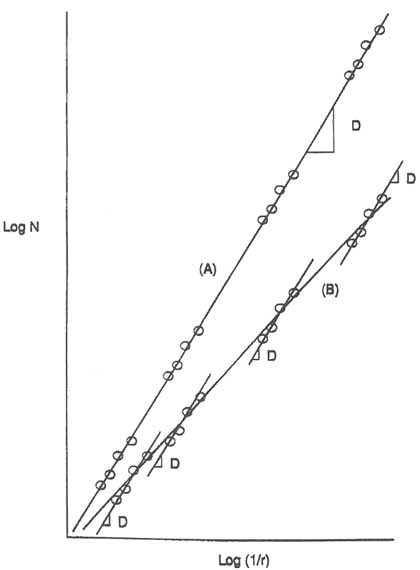
FIGURE 2.43 Hypothetical fractal dimension plots showing four sets of data collected at different scales. The slopes of the plotted curves give the fractal dimension D. (A) The fractal dimension is constant at all scales; all four data sets plot along a common line. (B) The fractal dimension changes as the scale changes; the four data sets plot along a gentle curve. In (B) each individual data set could be described well by a single common fractal dimension, yet the fractal dimension of the entire data collection is not constant. Courtesy of S. J. Martel.
of the present-day stress field on the opening of fracture sets should be taken into account.
It is quite clear that there is no single model that can represent all natural fracture network patterns and their flow properties. It is also clear that a better conceptual understanding of the geology, physics, and hydraulics of major fracture types is essential for a meaningful representation of fracture networks.
The spatial and temporal variations of fracture geometry in terms of the state of stress, fracture type, rock type, and scale pose many problems that need to be addressed in order to build useful models for simulating fluid flow in fractured media (see Chapter 6 for further discussion of this issue). Incorporating the most fundamental characteristics of fractures summarized in this chapter into conceptual models for fracture networks is an important first step.
APPENDIX 2.ADIAGENETIC ENHANCEMENT OF NATURAL FRACTURE PERMEABILITY
The conventional rock mechanics model of natural fracture permeability is based on open channels between the asperities and mismatches between rough surfaces that create small voids through which fluid can flow (Figure 2.A1). However, in many rock masses, particularly hydrocarbon reservoirs, natural fractures do not possess the clean unaltered surfaces assumed in this conventional representation of fracture permeability; rather, they possess surfaces on which mineralization and dissolution have occurred. This alteration can range from growth of single crystals on fracture walls to total infilling of the fracture by mineral cements (Figure 2.A2) or, in soluble rocks such as carbonates, localized dissolution of the fracture walls.
The extent of any permeability enhancement resulting from diagenetic alteration of the fracture faces depends predominantly on the degree of alteration. Sporadic single crystals may not substantially influence the behavior of the fracture from that predicted by the surface roughness model, whereas localized clusters of mineralization can create crystalline bridges propping the fracture open (Figure 2.A1d and 2.A2b). In this way, highly conductive fluid pathways are created, with apertures of several millimeters even under high in situ stress
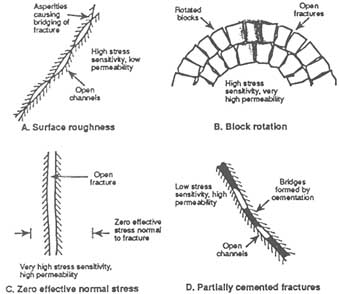
FIGURE 2.A1 Mechanisms promoting natural fracture permeability at depth. From Dyke (1996).
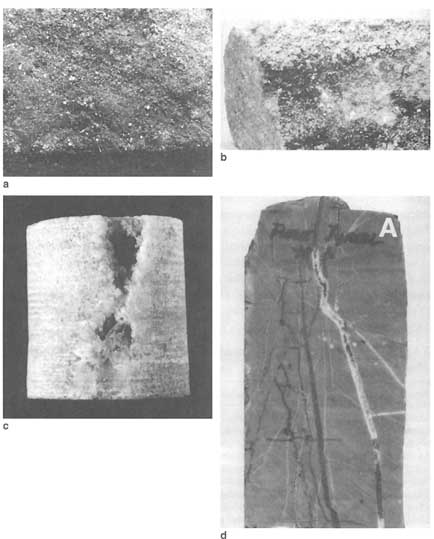
FIGURE 2.A2 Diagenetically modified natural fractures. (a) Sparsely distributed crystals of pyrite and calcite propping open a fracture in sandstone. (b) Euhedral and subhedral calcite crystals in a fracture in sandstone. The fracture face is stained by oil, which in turn is partly overlain by drilling mud. The euhedral crystals and mud invasion indicate substantial in situ apertures along discrete flow channels. (c) Calcite-lined flow channel in sandstone. Mud losses during drilling and high production indicate that this represents fracture permeability, not just unconnected porosity. Sample diameter is 1 in. (d) Partially and totally cemented fractures in dolomite. The dark staining in the open fracture is oil.
conditions. However, if mineralization proceeds to completion and the fracture is infilled, permeability can be destroyed rather than enhanced (Figure 2.A2d).
Fracture Characteristics
Recognizing the existence of mineral cements and their influence on natural fracture permeability is not as easy as it might initially appear. Mineralization may be so subtle that fracture surfaces need to be examined with a microscope for it to be recognized (Kulander et al., 1990). In many cases a fracture is identified by way of the minerals decorating it, so incomplete mineralization causes some natural fractures in drill cores to go undetected. In addition, distinguishing between connected and unconnected void spaces in a heavily mineralized fracture in a drill core can be impossible because only a small portion of a fracture will be intersected by a drill core. Hence, core description can be regarded only as an indicator of fracture porosity rather than of fracture permeability.
Diagenesis enhances natural fracture permeability in a wide range of rocks (e.g., carbonate, clastic, metamorphic) and involves a wide range of mineral cements, including calcite, dolomite, ankerite, pyrite, iron hydroxide, and quartz (Table 2.A1). Well-formed (or euhedral) crystals generally grow in open fractures
TABLE 2.A1 Examples of Hydrocarbon Reservoirs Containing Partially Mineralized Fractures
|
Reservoir |
Lithology |
Fracture Description |
|
Ekofisk, North Sea |
Chalk |
Partially mineralized tectonic and stylolitic fractures |
|
Lisburne, Alaska |
Limestone |
Partial infill of calcite |
|
W. Edmond, Oklahoma |
Limestone |
Occasional fractures partly sealed by recrystallization |
|
La Paz, Venezuela |
Limestone |
Euhedral calcite covers walls of open fractures |
|
Ain Zalah, Iraq |
Limestone |
Partially infilled fractures up to 0.75 in. (1.9 cm) wide |
|
Beaver River, Canada |
Dolomite |
Fractures partially infilled with calcite |
|
Ellenburger, Texas |
Dolomite |
Incomplete filling of interfragment pores by cement |
|
Clear Fork, Texas |
Dolomite |
Partially filled fractures |
|
Little Knife, N. Dakota |
Carbonate |
Small amounts of mineralization on fracture surfaces |
|
Dnieper-Donets, Russia |
Carbonate |
Partially infilled with calcite, pyrite, and dolomite |
|
Dagestan, Russia |
Carbonate |
Partially cemented with calcite and iron hydroxide |
|
Oriskany, Pennsylvania |
Sandstone |
Open joint planes partly sealed by projecting crystals |
|
Altamont-Bluebell, Utah |
Sandstone |
Quartz and calcite lining walls of open fractures |
|
North Appleby, Texas |
Sandstone |
Delicate fracture lining and bridging material show that fracture was open in subsurface |
|
Multiwell, Colorado |
Sandstone |
Crystal growth from the fracture wall is only partial |
|
Pembina, Canada |
Sandstone |
Euhedral quartz lines opposing walls in open fractures |
|
Big Sandy, Kentucky |
Shale |
Fracture planes often coated with crystalline dolomite, which may act as a proppant |
|
Santa Maria, California |
Chert/shale |
Partially healed by secondary quartz |
|
Lytton Springs, Texas |
Serpentine |
Intermittently locked together by cement |
|
SOURCE: Dyke (1996). |
||
(Figure 2.A2b), whereas subhedral and anhedral crystals develop as fractures become more completely sealed. Poorly formed crystals thus suggest lower permeability in a fracture (Figure 2.A2d). Additional examples of the effectiveness of mineral cements in ''locking open" natural fractures and their range of morphological diversity are presented by Nelson (1985) and Laubach (1988).
Influence of Diagenesis on Fracture Behavior
Diagenetic modifications of natural fractures influence the way a fracture system will respond to changing fluid flow conditions. A small proportion of the fractures may dominate flow and be locked open at large apertures by stiff mineral cement bridges. These range in size from microscopic single crystals to polycrystalline bridges of large contact area. The magnitude of the influence of the diagenetic modification is related to the nature of these cement bridges.
Influence of Large Drawdowns on Fracture Permeability
Natural fracture permeability is usually considered to be highly sensitive to an increase in the effective stress acting normal to the fracture. Many hydrocarbon reservoirs are subjected to massive decreases in pore pressure yet display no decrease in permeability during long-term production histories. Diagenetic modification may be one of several mechanisms that allow natural fractures to be relatively insensitive to changes in effective stress. Indeed, Morrow et al. (1990), in testing fractures partially infilled with calcite from the Multiwell Experiment, measured pressure sensitivities for fracture permeability that were in close agreement with the pressure sensitivity of the stiff matrix permeability.
APPENDIX 2.BFRACTURE PATTERNS IN FRONTIER FORMATION SANDSTONES, SOUTHWESTERN WYOMING
It is known that fracture pattern controls fluid flow in fractured rocks. However, it is not usually possible to see the fracture pattern at depth. One approach to making inferences about the nature of fluid flow in rocks that cannot be seen is to be able to gain information about the fracture pattern from understanding how the fractures formed. Studies of fracture formation in areas where the fracture pattern is exposed can help in this regard. An example of such a study was carried out in the Frontier Formation sandstones of Western Wyoming.
The Upper Cretaceous Frontier Formation comprises alternating sandstone and shale that accumulated in the western part of the Cretaceous Western Interior Seaway, a foreland basin flanked to the west and southwest by the Cordilleran thrust belt. The Frontier Formation in southwestern Wyoming lies in the western part of the Green River Basin and is exposed in the limbs of an open, angular-hinged syncline above a thrust fault. The syncline, a north-trending, fault-bend fold produced during eastward transport of the thrust sheet, contains rocks that were displaced about 8 to 16 km east of their site of deposition.
Most fractures in these exposures are joints or veins oriented normal to bedding. Two prominent fracture sets are evident: north-striking fractures, which formed first, and east-striking fractures, which formed later, as evidenced by abutting and crossing relationships. Beneath veneers of vein-filling calcite, plume axes on fracture faces are parallel to bedding (paleohorizontal), consistent with fracture growth in flat-lying rocks. In many beds only north-striking fractures are present, whereas in other beds only east-striking fractures occur. Consequently, adjacent beds may contain only one or the other fracture set.
The Frontier Formation outcrops are along the leading eastern edge of the thrust belt. East-striking fractures formed after north-striking fractures, when compression related to mountain building was dominant in the foreland, but primarily before local folding and faulting. The convex salient in the foreland basin at this latitude may have accentuated the tendency to form fractures with generally eastward strikes.
Stretching during basin subsidence accounts for north-striking fractures, which parallel the depositional axis of the Cretaceous foredeep. As the basin subsided, strata were stretched east-west owing to lengthening parallel to bedding as the original nearly flat depositional surface adjusted to conform to the asymmetric basin profile. Petrogenetic evidence suggests that vein-filling minerals are contemporaneous with early Frontier Formation cements.
Attributes of the two fracture sets differ. Fractures formed during slow burial (north-striking fractures) are uniformly distributed and have a narrow range of trace lengths in beds of a given thickness and composition. Figure 2.B1 illustrates typical distributions and length patterns. Regionally, north-striking fractures have
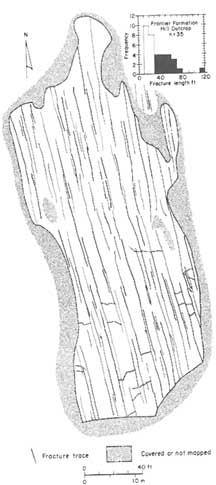
FIGURE 2.B1 Fractures formed during basin subsidence, illustrating evenly distributed, poorly interconnected fractures. Map of fracture traces on bedding plane, Little Coal Creek (Hill) outcrop, Wyoming (Sec. 31 T24N R115W). Fractures strike north-northwest, spacing is about 3 m, and variable line weight indicates relative fracture width. Disregarding fractures that do not have both ends of their traces exposed, fractures are 10 to 20 m long. Inset shows histogram of length distribution; fractures that end outside the outcrop have not been included, and that part of the distribution having numerous subsidiary fractures is shown with no pattern. From Laubach (1991).
spacings ranging from centimeters to several meters, but within an outcrop spacing generally varies by less than 30 percent of the average for that outcrop. Spacing is generally closer in thin beds and beds having extensive early cements. Contrasts in rock composition (including cement composition) and mechanically significant bed thickness can result in abrupt shifts in fracture intensity, but otherwise fractures typically are not clustered in swarms. These fractures also have a narrow range of lengths (Figure 2.B1). The distribution is even narrower if one excludes fractures less than 10 m long that are traces of hackles connected to larger fractures below the mapped surface. Here truncation effects arising from a lower cutoff in the size of mapped fracture are slight because there are few fractures mapped shorter than the measurement cutoff length of 1 m.
In contrast, the fracture set that formed during regional thrusting (east-striking fractures) is clustered into swarms containing fractures ranging widely in length (Figure 2.B2). Swarms of closely spaced fractures are typically elongated lenticular zones having widths that range from centimeters to more than 50 m. Across the margin of a swarm, fracture spacing may change abruptly from meters to centimeters. Some swarms are separated by rocks having no fractures. Other swarms are separated by areas of less closely spaced or less interconnected fractures; the swarms are not obviously periodic. Variable lengths of tectonic fractures are evident in Figure 2.B2. Exclusion of short fractures from this map introduces a significant bias; many small fractures both within and between swarms cannot be shown at this scale. Local measurements and large-scale fracture trace maps show that, locally, small fractures (centimeters to millimeters long) are abundant, and for this set the fracture length population may have a lognormal distribution.
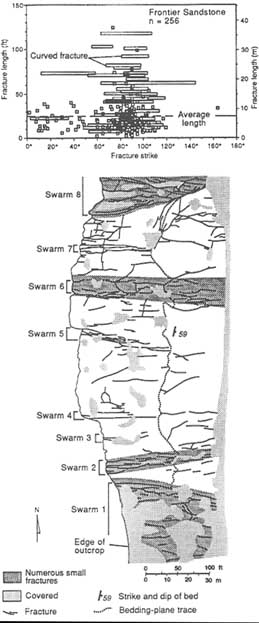
APPENDIX 2.CROLE OF PORE FLUIDS IN THE SAN ANDREAS FAULT
Fundamental questions exist about the mechanics of deformation and slip in the San Andreas fault (SAF), such as: Why is the fault segmented at all scales into creeping and locked sections? What factors control the localization of deformation and the nucleation and recurrence of earthquakes? Why is the SAF weak both absolutely and in a relative sense compared with the adjacent plate interiors, as evidenced by heat flow measurements (Brune et al., 1969; Henyey and Wasserburg, 1971; Lachenbruch and Sass, 1973, 1980, 1992) and by apparent principal stress orientations in the adjacent plates (Mount and Suppe, 1987; Zoback et al., 1987; Oppenheimer et al., 1988; Wong, 1990)? The effective large-scale permeability of the fault zone and its adjacent country rock are key issues in the debate on the seismic behavior of the SAF.
Discovering the causes of the weakness of the SAF zone will perhaps be key to understanding the fundamental behavior of the system. Existing data (e.g., Healy and Zoback, 1988; Zoback and Healy, 1992) indicate that the frictional strength of the crust is generally consistent with the Mohr-Coulomb faulting theory, with friction coefficients in the range of 0.6 to 0.9 (from Byerlee's law). In contrast, the apparent low strength of the SAF would require a coefficient of friction of 0.1, yet the friction coefficient of even the weakest material envisioned to exist in the fault zone, montmorillonite gouge, is found to be no less than about 0.4 (Wang and Mao, 1979; Morrow et al., 1982, 1992). Furthermore, temperatures at seismogenic depths may too high to preserve this mineral. One favored alternative cause of the apparent low strength of the SAF is a very low effective stress in the fault zone caused by high fluid pore pressure.
Byerlee (1990) and Rice (1992) proposed models in which permanently high fluid pore pressure in the SAF zone can coexist with near-hydrostatic pressure in the adjacent country rock without causing hydrofracturing of the fault wall rocks. The models are identical mechanically but rely on different mechanisms to maintain the high pressure differential between the fault zone and the country rock. In Rice's model flow is allowed from the fault zone to the country rock, but the in-plane permeability of the fault zone is much higher than fault-perpendicular permeability, and the high pore pressure in the fault zone is maintained by fluid recharge from the lower crust at the root of the fault. In Byerlee's model the fault zone is sealed (i.e., there is zero effective cross-fault permeability). Fault zone fluids originally derived from the country rock are maintained at high pore pressure by compaction of fault zone materials during shearing.
Fournier (1990), Blanpied et al. (1992), Sibson (1992), Sleep and Blanpied (1992), Byerlee (1993), and Chester et al. (1993) have proposed mechanisms whereby intermittent high pore pressures are developed during the earthquake cycle by the formation of impermeable barriers through pressure-induced sealing and healing processes. Dynamic weakening mechanisms that act only during
rapid fault slip also have been proposed. These include transient high fluid pressure caused by shear heating during slip (Lachenbruch, 1980; Mase and Smith, 1987), reduction of normal stress accompanying the propagation of dilational waves along the fault (Brune, 1993), and acoustic fluidization of fault zone materials (Melosh, 1979). The latter two mechanisms do not require high fluid pressures. The critical factor in discriminating between Rice's fault-weakening model, Byerlee's (1990) model, and cyclic high pore pressure models is the origin of fault zone fluids and the hydrogeological connectivity between the fault zone and the country rock. Rice's model requires a deep crustal or upper-mantle source, whereas in the other models fluids are derived from the country rock.
REFERENCES
Antonellini, M. 1992. Geometry and distribution of deformation bands in porous sandstones, Delicate Arch area, Arches National Park, Utah. Pp. A1-A7 in the Rock Fracture Project, D. D. Pollard and A. Aydin, eds. Vol. 3. Stanford University, Stanford, Calif.
Antonellini, M., and A. Aydin. 1994. Effect of faulting on fluid flow in porous sandstones. Petrophysical Properties, American Association of Petroleum Geologists Bulletin , 78:355–377.
Antonellini, M. A., A. Aydin, and D. D. Pollard. 1994. Microstructure of deformation bands in porous sandstones at Arches National Park, Utah. Journal of Structural Geology, 16:941–959.
Aydin, A. 1978. Small faults formed as deformation bands in sandstone. Pure and Applied Geophysics, 116:913–930.
Aydin, A., and J. M. DeGraff. 1988. Evolution of polygonal fracture patterns in lava flows. Science, 239:471–476.
Aydin, A., and A. M. Johnson. 1978. Development of faults as zones of deformation bands and as slip surfaces in sandstone. Pure and Applied Geophysics, 116:931–942.
Aydin, A., and A. Nur. 1982. Evolution of pull-apart basins and their scale independence. Tectonics, 1:91–105.
Aydin, A., and B. Page. 1984. Diverse Pliocene-Quaternary tectonics in a transform environment, San Francisco Bay Region, California. Geological Society of America Bulletin, 95(11):1303–1317.
Aydin, A., and Z. Reches. 1982. Number and orientation of fault sets in the field and in experiments. Geology, 10:107–112.
Aydin, A., and R. A. Schultz. 1990. Effect of mechanical interaction on the development of strike-slip faults with echelon patterns. Journal of Structural Geology, 12:123–129.
Aydin, A., R. A. Schultz, and D. Campagna. 1990. Fault-normal dilation in pull-apart basins: implications for the relationship between strike-slip faults and volcanic activity. Annales Tectonicae, IV:45–52.
Bahat, D. 1988. Fractographic determination of joint length distribution in chalk. Rock Mechanics and Rock Engineering, 21:79–94.
Bahat, D., and T. Engelder. 1984. Surface morphology on cross-fold joints of the Appalachian Plateau, New York and Pennsylvania. Tectonophysics, 104:299–313.
Barker, J. 1988. A generalized radial flow model for pumping tests in fractured rock. Water Resources Research, 24:1796–1804.
Barton, C. C. 1983. Systematic jointing in the Cardium Sandstone along the Bow River, Alberta, Canada. Ph.D. thesis, Yale University, 301 pp.
Barton, C. C., and P. A. Hsieh. 1989. Physical and Hydrologic-Flow Properties of Fractures. 28th International Geological Congress Field Trip Guidebook T385. P. 36. Washington, D.C.: American Geophysical Union.
Bates, R. L., and J. A. Jackson, eds. 1980. Glossary of Geology, 2d ed. Falls Church, Va.: American Geological Institute.
Bilham, R., and G. King. 1989. The morphology of strike-slip faults: examples from the San Andreas fault, California. Journal of Geophysical Research, 94:10,204–10,216.
Birkeland, P. W., and E. E. Larson. 1989. Putman's Geology, 5th ed. New York: Oxford University Press.
Black, J., O. Olsson, J. Gale, and D. Holmes. 1990. Site Characterization and Validation, Stage 4, Preliminary Assessment and Detail Predictions. Stripa Project Technical Report 91-08, Swedish Nuclear Fuel and Waste Management Company, Stockholm, p. 248.
Blanpied, M. L., D. A. Lockner, and J. D. Byerlee. 1992. An earthquake mechanism based on rapid sealing of faults. Nature, 358:574–576.
Borg, I. Y., and J. C. Maxwell. 1956. Interpretation of fabrics of experimentally deformed sands. American Journal of Science, 254:71–81.
Boyer, S. E., and D. Elliott. 1982. Thrust systems. American Association of Petroleum Geologists Bulletin, 66:1196–1230.
Brown, N. N., and R. H. Sibson. 1989. Structural geology of the Octillo Badlands antidilational fault jog, southern California. Pp. 94–109 in Fault Segmentation and Controls of Rupture Initiation and Termination. USGS Open-File Report 89-315, U.S. Geological Survey, Menlo Park, Calif.
Brown, A., N. M. Soonawala, R. A. Everitt, and D. C. Kamineni. 1989. Geology and geophysics of the Underground Research Laboratory site, Lac du Bonnet Batholith, Manitoba. Canadian Journal of Earth Sciences, 26:404–425.
Brune, J. N. 1993. Rupture mechanism and interface separation in foam rubber models of earthquakes: A possible solution to the heat flow paradox and the paradox of large overthrusts. Tectonophysics, 218(1–3):59–67.
Brune, J. N., T. L. Henyey, and R. F. Roy. 1969. Heat flow, stress, and the rate of slip along the San Andreas fault, California. Journal of Geophysical Research, 74:3821–3827.
Byerlee, J. 1990. Friction, overpressure and fault normal compression. Geophysics Research Letter, 17:2109-2112.
Byerlee, J. 1993. Model for episodic flow of high pressure water in fault zones before earthquakes. Geology, 21:303–306.
Caine, J. S., C. B. Forster, and J. P. Evans. 1993. A classification scheme for permeability structures in fault zones. Transactions of the American Geophysical Union, 74:677.
Chester, F. M., J. P. Evans, and R. L. Beigel. 1993. Internal structure and weakening mechanisms of the San Andreas fault. Journal of Geophysical Research, 98:771–786.
Choukrone, P., and D. Gapais. 1983. Strain pattern in the Aar granite (central Alps): orthogenesis developed by bulk flattening. Journal of Structural Geology, 5:411–418.
Cloos, E. 1955. Experimental analysis of fracture patterns. Geological Society of America Bulletin, 66:241–256.
Cox, B. L., and J. S. Y. Wang. 1993. Fractal surfaces: measurement and application in the earth sciences. Fractals, 1:87–115.
Cowie, P. A., and C. H. Scholz. 1992. Displacement-length relationship for faults: data analysis and discussion. Journal of Structural Geology, 14:1149–1156.
Cruikshank, K. M., and A. Aydin. 1994. Role of fracture localization in arch formation, Arches National Park, Utah. Geological Society of America Bulletin, 106:879–891.
Cruikshank, K. M., and A. Aydin. 1995. Unweaving the joints in Entrada Sandstone, southwest limb of the Salt Valley anticline, Arches National Park, Utah. Journal of Structural Geology, 17:409–421.
Cruikshank, K. M., G. Zhao, and A. M. Johnson. 1991. Duplex structures connecting fault segments in Entrada sandstone. Journal of Structural Geology, 13:1185–1196.
DeGraff, J. M. 1987. Mechanics of columnar joint formation in igneous rock. Ph.D. thesis, Purdue University, West Lafayette, Ind., p. 221.
DeGraff, J., and A. Aydin. 1987. Surface morphology of columnar joints and its significance to mechanics and direction of joint growth. Geological Society of America Bulletin, 99:605–617.
DeGraff, J. M., and A. Aydin. 1993. Effect of thermal regime on growth increments and spacing of contraction joints in basaltic lava. Journal of Geophysical Research, 98:6411–6430.
DeGraff, J. M., P. E. Long, and A. Aydin. 1989. Use of joint-growth directions and rock textures to infer thermal regimes during solidification of basaltic lava flows. Journal of Volcanology and Geothermal Research, 38:309–324.
Delaney, P. T., D. D. Pollard, J. I. Ziony, and E. H. McKee. 1986. Field relations between dikes and joints: emplacement processes and paleostress analysis. Journal of Geophysical Research, 91:4920–4938.
Dershowitz, W. S., and H. H. Einstein. 1988. Characterizing rock joint geometry with joint system models. Rock Mechanical Rock Engineering, 21(1):21–52.
Du, Y., and A. Aydin. 1991. Interaction of multiple cracks and formation of echelon crack arrays, International Journal of Numerical and Analytical Methods in Geomechanics, 15(3):205–218.
Dyer, J. R. 1983. Jointing in sandstones, Arches National Park, Utah. Ph.D. dissertation, Stanford University, Stanford, Calif., 202 pp.
Dyke, C.G. 1996. How sensitive is natural fracture permeability at depth to variation in effective stress? In Fractured and Jointed Rock Masses, Proceedings of the International ISRM Symposium on Fractured and Jointed Rock Masses. Rotterdam: A. A. Balkema.
Einstein, H. H., and W. S. Dershowitz. 1990. Tensile and shear fracturing in predominantly compressive stress fields—a review. Engineering Geology, 29:149–172.
Engelder, T. 1974. Cataclasis and the generation of fault gouge. Geological Society of America Bulletin, 85:1515–1522.
Engelder, T. 1987. Joints and shear fractures in rock. Pp. 27–69 in Fracture Mechanics of Rock, B. K. Atkinson, ed. New York: Academic Press.
Engelder, T., and P. Geiser. 1980. On the use of regional joint sets as trajectories of paleostress fields during the development of the Appalachian Plateau, New York. Journal of Geophysical Research, 85:6319–6341.
Engelder, T., and A. Lacazette. 1990. Natural hydraulic fracturing. Pp. 35-44 in Rock Joints, N. Barton and O. Stephansson, eds. Rotterdam: A. A. Balkema.
Fletcher, R. C., and D. D. Pollard. 1981. Anticrack model for pressure solution surface . Geology, 9:419–424.
Forster, C. B., J. V. Goddard, and J. P. Evans. 1994. Permeability structure of a thrust fault. Pp. 216–223 in The Mechanical Involvement of Fluids in Faulting, S. Hickman, R. L. Bruhn, and R. Sibson, eds. USGS Open File Report 94-228, U.S. Geological Survey, Menlo Park, Calif.
Fournier, R. L. 1990. A San Andreas Fault model in which maximum principal stress nearly normal to the fault is advantageous. EOS, Transactions of the American Geophysical Union, 71:1635.
Friedman, M., and D. M. Wiltschko. 1992. An approach to exploration for naturally fractured reservoirs—a generic approach with examples from the Austin Chalk. Pp. 143–153 in Geological Studies Relevant to Horizontal Drilling: Examples from Western North America, J. W. Schmoker, E. B. Coalson, and C. A. Brown, eds. Rocky Mountain Association of Geology, Denver, Colo.
Gallagher, J. J., M. Friedman, J. Handin, and G. M. Sowers. 1974. Experimental studies relating to microfracture in sandstone. Tectonophysics, 21:203–247.
Geyer, J. F., and S. Nemat-Nasser. 1982. Experimental investigation of thermally induced interacting cracks in brittle solids . International Journal of Solids and Structures, 18:344–356.
Gillespie, P. A., C. B. Howard, J. J. Walsh, and J. Watterson. 1993. Measurement and characterization of spatial distributions of fractures. Tectonophysics, 226:113–141.
Griffith, A. A. 1921. The phenomena of rupture and flow in solids. Royal Society of London Transactions, 221:163–198.
Healy, J. H., and M. D. Zoback. 1988. Hydraulic fracturing in situ stress measurements to 2.1 km depth at Cajon Pass, California. Geophysics Research Letter, 15:1005–1008.
Heffer, K. J., and T. G. Bevan. 1990. Scaling relationships in natural fracture: data, theory, and application. Society of Petroleum Engineers, Richardson, Tex.
Helgeson, D. E. 1990. Characteristics of joint propagation in layered sedimentary rocks. The Rock Fracture Project Workshop, 1:F1–F5. Stanford University, Stanford, Calif.
Helgeson, D. E., and A. Aydin. 1991. Characteristics of joint propagation across layer interfaces in sedimentary rocks. Journal of Structural Geology, 13:897–911.
Henry, P., and X. Le Pichon. 1991. Fluid flow along a decollement layer: a model applied to the 16 N section of the Barbados accretionary wedge. Journal of Geophysical Research, 96:6507–6528.
Henry, P., and C. Y. Wang. 1991. Modeling of fluid flow and pore pressure at the toe of Oregon and Barbados accretionary wedge. Journal of Geophysical Research, 96(20):109–120, 130.
Henyey, T. L., and G. J. Wasserburg. 1971. Water flow near major strike-slip faults in California. Journal of Geophysical Research, 76:7924–7946.
Hobbs, D. W. 1967. The formation of tension joints in sedimentary rocks: an explanation. Geological Magazine, 104:550–556.
Hodgson, R.A. 1961. Classification of structures on joint surfaces. American Journal of Science, 259:493–502.
Horii, H., and S. Nemat-Nasser. 1985. Compression-induced microcrack growth in brittle solids: axial splitting and shear failure, Journal of Geophysical Research, 90:3105–3125.
Hubbert, M. K. 1972. Natural and induced fracture orientation. American Association of Petroleum Geologists Memorandum , 18:235–238.
Inglis, C. E. 1913. Stresses in a plate due to the presence of cracks and sharp comers. Royal Institute of Naval Architects Transactions, 55:219–230.
Jamison, W. R., and D. W. Stearns. 1982. Tectonic deformation of Wingate Sandstone, Colorado National Monument. American Association of Petroleum Geologists Bulletin, 66:2584-2608.
Kulander, B. R., C. C. Barton, and S. L. Dean. 1979. The application of fractography to core and outcrop fracture investigations. METC/SP-79/3. Morgantown Energy Technology Center, Morgantown, W. Va., 174 pp.
Kulander, B. R., S. L. Dean, and B. J. Ward. 1990. Fractured core analysis: interpretation, logging, and use of natural and induced fractures in core. AAPG Methods in Exploration, No. 8, p. 88. American Association of Petroleum Geologists, Tulsa, Okla.
Lachenbruch, A. H. 1962. Mechanics of thermal contraction cracks and ice-wedge polygons in permafrost. Special Paper 70, Geological Society of America, Denver, Colo. 69 pp.
Lachenbruch, A. H. 1980. Frictional heating, fluid pressure, and resistance to fault motion. Journal of Geophysical Research, 85:6097-6112.
Lachenbruch, A. H., and J. H. Sass. 1973. Thermomechanical aspects of the San Andreas fault system. Pp. 192–205 in Proceedings of the Conference on Tectonic Problems of the San Andreas Fault System, R.L. Kovach and A. Nur, eds. Stanford University Publications in the Geological Sciences, vol. 13. Stanford University, Stanford, Calif.
Lachenbruch, A. H., and J. H. Sass. 1980. Heat flow and energetics of the San Andreas fault zone. Journal of Geophysical Research, 85:6185-6223.
Lachenbruch, A. H., and J. H. Sass. 1992. Heat flow from Cajon Pass, fault strength, and tectonic implications. Journal of Geophysical Research, 97:4995-5015.
Ladeira, F. L., and N. J. Price. 1981. Relationship between fracture spacing and bed thickness. Journal of Structural Geology, 3:179–183.
LaPointe, P. R., and J. A. Hudson. 1985. Characterization and interpretation of rock mass joint patterns. Special Paper 199, Geological Society of America, Denver, Colo., p. 37.
Laubach, S. E. 1988. Subsurface fractures and their relationship to stress history in East Texas basin sandstone. Tectonophysics, 156:37–49.
Laubach, S. E. 1991. Fracture patterns in low-permeability-sandstone gas reservoir rocks in the Rocky Mountain region. Pp. 501–510 in Proceedings, Joint Society of Petroleum Engineers Rocky Mountain Regional Meeting/Low-Permeability Reservoir Symposium. SPE Paper 21853, Society of Petroleum Engineers, Richardson, Tex.
Laubach, S. E. 1992. Fracture networks in selected Cretaceous sandstones of the Green River and San Juan basins, Wyoming, New Mexico, and Colorado. Pp. 61–73 in Geological Studies Relevant to Horizontal Drilling: Examples from Western North America, E. B. Coalson and C. A. Brown, eds. Rocky Mountain Association of Petroleum Geologists, Denver, Colo.
Lawn, B. R., and T. R. Wilshaw. 1975. Fracture of Brittle Solids. Cambridge: Cambridge University Press, 204 pp.
Lisle, R. J. 1989. Paleostress analysis from sheared dike sets. Geological Society of America Bulletin, 101:968–972.
Lockner, D. D., J. Byerlee, V. Kuksenko, A. Ponomarev, and A. Sidorin. 1992. Observations of quasistatic fault growth from acoustic emissions. Pp. 3–31 in Fault Mechanics and Transport Properties of Rocks, B. Evans and T. F. Wong, eds. New York: Academic Press.
Logan, J. M. 1992. The influence of fluid flow on the mechanical behavior of faults. Pp. 141–149 in Proceedings of the 33rd U. S. Symposium on Rock Mechanics, J. R. Tillerson and W. R. Wawersik, eds. Rotterdam: A. A. Balkema.
Long, P. E., and B. J. Wood. 1986. Structures, textures, and cooling histories of Columbia River basalt flows. Geological Society of America Bulletin, 97:1144–1155.
Lorenz, J. C., and S. E. Laubach. 1994. Description and interpretation of natural fracture patterns in sandstones of the Frontier Formation along the Hogsback, Southwestern Wyoming. Topical report to Gas Research Institute, GRI-94/0020, p. 89.
Mandelbrot, B. 1982. The Fractal Geometry of Nature. San Francisco: Freeman, 460 pp.
Mandl, G. 1988. Mechanics of Tectonic Faulting. New York: Elsevier, 408 pp.
Marrett, R., and R. W. Almendinger. 1991. Estimates of strain due to brittle faulting: Sampling of fault populations. Journal of Structural Geology, 31:735–738.
Martel, S. J. 1990. Formation of compound strike-slip fault zones, Mount Abbot quadrangle, California. Journal of Structural Geology, 12:869–882.
Martel, S. J., and J. E. Peterson, Jr. 1991. Interdisciplinary characterization of fracture systems at the US/BK site, Grimsel Laboratory, Switzerland. International Journal of Rock Mechanics and Mining Science and Geomechanical Abstracts, 28:259–323.
Martel, S. J., D. D. Pollard, and P. Segall. 1988. Development of simple strike-slip fault zones in granitic rock, Mount Abbot quadrangle, Sierra Nevada, California. Geological Society of America Bulletin, 99:1451–1465.
Martel, S. J., K. Hestir, and J. C. S. Long. 1991. Generation of fracture patterns using self-similar iterated function system concepts. 1990 Annual Report, Earth Sciences Division, Lawrence Berkeley Laboratory, Berkeley, Calif., pp. 52–56.
Mase, C. W., and L. Smith. 1987. Effects of frictional heating on the thermal, hydrologic, and mechanical response of a fault. Journal of Geophysical Research, 92:6249–6272.
McClay, K. R., and P. G. Ellis. 1987. Geometries of extensional fault systems developed in model experiments. Geology, 15:341–344.
McKenzie, D., and J. A. Jackson. 1986. A block model of distributed deformation by faulting. Journal of the Geological Society of London, 143:349–353.
Melosh, H. J. 1979. Acoustic fluidization: a new geological process? Journal of Geophysical Research, 84:7513–7520.
Moore, J. C., and P. Vrolijk. 1992. Fluids in accretionary prisms. Reviews of Geophysics, 30:113–135.
Moore, J. C., and others. 1988. Tectonics and hydrogeology of the northern Barbados Ridge: Results from Ocean Drilling Program leg 110. Geological Society of America Bulletin, 100:1578–1593.
Morrow, C. A., L. Q. Shi, and J. Byerlee. 1982. Strain hardening and strength of clay-rich fault gouges. Journal of Geophysical Research, 87:6771–6780.
Morrow, C. A., B. Radney, and J. Byerlee. 1992. Frictional strength and the effective pressure law of montmorillonite and illite clays. Pp. 69–88 in Earthquake Mechanics and the Transport Properties of Rocks, B. Evans and T.F. Wong, eds. London: Academic Press.
Morrow, N. R., K. R. Brower, S. Ma, and J. S. Buckley. 1990. Fluid flow in healed tectonic fractures. Journal of Petroleum Technology, 1310–1318.
Mount, V. S., and J. Suppe. 1987. State of stress near the San Andreas fault: Implications for wrench tectonics. Geology, 15:1143–1146.
Narr, W., and J. Suppe. 1991. Joint spacing in sedimentary rocks. Journal of Structural Geology, 13:1037–1048.
Naylor, M. A., G. Mandl, and C. H. K. Sijpesteijn. 1986. Fault geometries in basement-induced wrench faulting under different initial stress states. Journal of Structural Geology, 8:737–752.
Nelson R. A. 1985. Geologic Analysis of Naturally Fractured Reservoirs. Houston, Tex.: Gulf Publishing, 320 pp.
Nelson, R. A. 1987. Fractured reservoirs: turning knowledge into practice. Journal of Petroleum Technology, 39:407–414.
Nickelsen, R. P., and V. N. D. Hough. 1967. Jointing in the Appalachian Plateau of Pennsylvania. Geological Society of America Bulletin, 78:609–629.
Nur, A. 1982. The origin of tensile fracture lineaments. Journal of Structural Geology, 4:31–40.
Nur, A., H. Ron, and O. Scotti. 1986. Fault mechanics and kinematics of block rotation. Geology, 14:746–749.
Odling, N. E. 1992. Network properties of a two-dimensional nature fracture pattern. Pure and Applied Geophysics, 138:95–114.
Ohlmacher, G. C. 1991. Mechanics of vein, fault, and solution surface formation in Bays Mountain, southern Appalachians. Ph.D. thesis, Purdue University, West Lafayette, Ind., 210 pp.
Ohlmacher, G., and A. Aydin. 1995. Progressive deformation in the Bays Mountain Syncline, Kingsport, TN. American Journal of Science, 295:943–987.
Olson, J. 1990. Fracture mechanics analysis of joints and veins. Ph.D. dissertation, Stanford University, Stanford, Calif., 174 pp.
Olson, J., and D. D. Pollard. 1989. Inferring paleostress from natural fracture patterns: a new method. Geology, 17:345–348.
Olson, J. E., and D. D. Pollard. 1991. The initiation and growth of en-echelon veins. Journal of Structural Geology, 13:595–608.
Oppenheimer, D. H., P. A. Reasenberg, and R. W. Simpson. 1988. Fault plane solutions for the 1984 Morgan Hill, California earthquake sequence: Evidence for the state of stress on the Calaveras fault. Journal of Geophysical Research, 93:9007–9026.
Patterson, M. S. 1958. Experimental deformation and faulting in Wombeyan marble. Geological Society of America Bulletin, 69:465–476.
Peng, S., and A. M. Johnson. 1972. Crack growth and faulting in cylindrical specimens of Chelmsford granite. International Journal of Rock Mechanics and Mining Science, 9:37–86.
Pittman, E. D. 1981. Effect of fault-granulation on porosity and permeability of quartz sandstones, Simpson Group (Ordovician), Oklahoma. Bulletin of the American Association of Petroleum Geology, 65:2381–2387.
Pollard, D. D., and A. Aydin. 1984. Propagation and linkage of oceanic ridge segments. Journal of Geophysical Research, 89:10,017–10,028.
Pollard, D. D., and A. Aydin. 1988. Progress in understanding jointing over the past century. Geological Society of America Bulletin, 100:1181–1204.
Pollard, D. D., and P. Segall. 1987. Theoretical displacements and stresses near fractures in rock: with applications of faults, joints, veins, dikes, and solution surfaces. Pp. 277–349 in Fracture Mechanics of Rock, B. K. Atkinson, ed. London: Academic Press.
Pollard, D. D., P. Segall, and P. T. Delaney. 1982. Formation and interpretation of dilatant echelon cracks. Geological Society of America Bulletin, 93:1291–1303.
Power, W. L., T. E. Tullis, S. R. Brown, G. N. Boitnott, and C. H. Scholz. 1987. Roughness of natural fault surfaces. Geophysical Research Letters, 14:29–32.
Price, N. 1966. Fault and Joint Development in Brittle and Semi-brittle Rock. Oxford: Pergamon Press, 176 pp.
Price, N. 1974. The development of stress systems and fracture patterns in undeformed sediments. Proceedings of the International Society of Rock Mechanics, IA:487–496.
Price, R. A. 1988. Mechanical paradox of large scale overthrusts. Geological Society of America Bulletin, 100:1898–1908.
Proffett, J. M., and J. H. Dilles. 1984. Geologic map of the Yerington District, Nevada. in Map, Nevada Bureau of Mines and Geology, vol. 77. Reno.
Reches, A. 1983. Faulting of rocks in three-dimensional strain fields. II. Theoretical analysis. Tectonophysics, 95:133–156.
Reches, Z., and D. A. Lockner. 1994. Nucleation and growth of faults in brittle rock. Journal of Geophysical Research, 99:18,159–18,173.
Renshaw, C. E., and D. D. Pollard. 1994. Numerical simulation of fracture set formation: a fracture mechanics model consistent with experimental observations. Journal of Geophysical Research, 99:9359–9372.
Reyes, O., and H. H. Einstein. 1991. Failure mechanisms of fractured rock—a fracture coalescence model. Pp. 333–340 in Proceedings of the 7th International Congress of the International Society of Rock Mechanics, vol. 1.
Rice, J. R. 1968. Mathematical analysis in the mechanics of fracture. Pp. 192–311 in Fracture, vol. 2, H. Liebowitz, ed. New York: Academic Press.
Rice, J. R. 1992. Fault stress states, pore pressure distributions, and the weakness of the San Andreas fault. Pp. 475-503 in Earthquake Mechanics and the Transport Properties of Rocks, B. Evans and T.F. Wong, eds. London: Academic Press.
Rice, J. R. 1993. Spatio-temporal complexity of slip on a fault. Journal of Geophysical Research, 98:9885–9907.
Riedel, W. 1929. Zur Mechanik geologischer Brucherscheinungen. Zentralbl. Mineral., Abt. B, 354–368.
Rispoli, R. 1981. Stress fields about strike-slip faults inferred from stylolites and tension gashes. Tectonophysics, 75(34):T29–T36.
Rives, T., M. Razack, J. P. Petit, and K. Rawnsley. 1992. Joint spacing: analogue and numerical modeling. Journal of Structural Geology, 14:925–937.
Rodgers, D. A. 1980. Analysis of pull-apart basin development produced by en-echelon strike-slip faults. Pp. 27–41 in Sedimentation in Oblique-Slip Mobile Zones, P. F. Ballance and H. G. Reading, eds. Special Publication, International Association for Sedimentology.
Ryan, M. P., and C. G. Sammis. 1978. Cylic fracture mechanisms in cooling basalt. Geological Society of America Bulletin, 89:1295–1308.
Saltzer, S. D. 1992. Numerical modeling of crustal scale faulting using the distinct and boundary element methods. Ph.D. thesis, Stanford University, Stanford, Calif., 203 pp.
Saltzer, S. D., and D. D. Pollard. 1992. Distinct element modeling of structures formed in sedimentary overburden by extensional reactivation of basement normal faults. Tectonics, 11:165–174.
Scholz, C. H. 1990. The Mechanics of Earthquakes and Faulting. Cambridge: Cambridge University Press, 439 pp.
Scholz, C. H., and C. Aviles. 1986. The fractal geometry of faults faulting. Pp. 147–155 in Earthquake Source Mechanics, S. Das, J. Boatwright, and C. H. Scholz, eds., Monograph Series, vol. 37. Washington, D.C.: American Geophysical Union.
Schwartz, D. P., and K. J. Coppersmith. 1984. Fault behavior and characteristic earthquakes; examples from the Wasatch and San Andreas fault zones. Journal of Geophysical Research, 89:5681–5698.
Scott, R. B., and J. Bonk. 1984. Preliminary geologic map of Yucca Mountain, Nye County, Nevada, with geologic sections. USGS Open-File Report 84-494, scale 1:12,000. U.S. Geological Survey, Denver, Colo.
Secor, D. T. 1965. Role of fluid pressure in jointing. American Journal of Science, 263:633–646.
Secor, D. T. 1968. Mechanics of natural extension fracturing at depth in the earth's crust. Pp. 3–47 in Proceedings of a Conference on Research in Tectonics. Paper 68-52, Geology Survey of Canada, Ottawa.
Seeburger, D., A. Aydin, J. L. Warner, and R. E. White. 1991. Structure of fault zones in sandstone and its effect on permeability. American Association of Petroleum Geologists Bulletin, 75(3):669.
Segall, P., and D. D. Pollard. 1980. Mechanics of discontinuous faults. Journal of Geophysical Research, 85:4337-4350.
Segall, P., and D. D. Pollard. 1983a. Joint formation in granitic rock of the Sierra Nevada. Geological Society of America Bulletin, 94:563–575.
Segall, P., and D. D. Pollard. 1983b. Nucleation and growth of strike-slip faults in granite. Journal of Geophysical Research, 88:555–568.
Segall, P., E. H. McKee, S. J. Martel, and B. D. Turrin. 1990. Late Cretaceous age of fractures in the Sierra Nevada batholith, California. Geology, 18:1248–1251.
Sibson, R. H. 1981. Fluid flow accompanying faulting: field evidence and models. Pp 593–603 in Earthquake Prediction: An International Review, Maurice Ewing Series, vol. 4, D. W. Simpson, and P. G. Richards, eds. Washington, D.C.: American Geophysical Union.
Sibson, R. H. 1992. Implications of fault-wave behavior for rupture nucleation and recurrence. Tectonophysics, 211:283–293.
Sibson, R. H. 1994. Crustal stress, faulting, and fluid flow. Pp. 69–84 in Geofluids: Origin, Migration and Evolution of Fluids in Sedimentary Basins, J. Parnell, ed. Special Publication 78, Geological Society of London.
Skempton, A. W. 1966. Some observations on tectonic shear zones. Pp. 329–335 in Proceedings of the 1st International Congress of the International Society of Rock Mechanics, Lisbon, vol 1.
Sleep, N. H., and M. L. Blanpied. 1992. Creep, compaction and the weak rheology of major faults. Nature, 359:687–692.
Spencer, E. W. 1959. Geologic evolution of the Beartooth Mountains, Montana and Wyoming, Part 2: Fracture Patterns. Geological Society of America Bulletin, 70:379–382.
Stearns, W., and M. Friedman. 1972. Reservoirs in fractured rocks. Pp. 82–106 in Stratigraphic Oil and Gas Fields; Classification, Exploration Methods, and Case Histories. American Association of Petroleum Geologists, Memorandum, No. 16 .
Suppe, J. 1985. Principals of Structural Geology. Englewood Cliffs, N.J.: Prentice-Hall, p. 537.
Tchalenko, J.S. 1970. Similarities between shear zones of different magnitudes. Geology Society of America Bulletin, 81:1625–1640.
Tsang, Y. W., and P. A. Witherspoon. 1981. Hydromechanical behavior of a deformable rock fracture subject to a normal stress. Journal of Geophysical Research, 86:9287–9298.
Turcotte, D. L. 1992. Fractals and Chaos in Geology and Geophysics. Cambridge: Cambridge University Press, 221 pp.
U.S. Geological Survey. 1984. A Summary of Geologic Studies Through January 1, 1983, of a Potential High-Level Radioactive Waste Repository Site at Yucca Mountain, Southern Nye County, Nevada. USGS Open-File Report 84-792, U.S. Geological Survey, Denver, Colo., p. 103.
Van Hise, C. R. 1896. Principles of North American Pre-Cambrian Geology: U.S. Geological Survey 16th Annual Report. U.S. Geological Survey, Reston, Va., pp. 581–874.
Verbeek, E. R., and M. A. Grout. 1984. Fracture Studies in Cretaceous and Paleocene Strata in and Around the Piceance Basin, Colorado: Preliminary Results and Their Bearing on a Fracture-Controlled Natural-Gas Reservoir at the MWX Site. USGS Open-File Report 84-156, U.S. Geological Survey, Denver, Colo.
Walsh, J. J., and J. Watterson. 1988. Analysis of relationship between displacements and dimension of faults. Journal of Structural Geology, 10:239–247.
Walsh, J. J., and J. Watterson. 1993. Fractal analysis of fracture patterns using the standard box-counting technique: valid and invalid methodologies. Journal of Structural Geology, 15:1509–1512.
Wang, C. Y., and N. H. Mao. 1979. Shearing of saturated clays in rock joints at high confining pressures. Geophysics Research Letter, 6:825–828.
Wilcox, R. E., T. P. Hardin, and D. R. Seely. 1973. Basic wrench tectonics. American Association of Petroleum Geologists Bulletin, 57:74–96.
Wise, D. U. 1964. Microjointing in basement, middle Rocky Mountains of Montana and Wyoming: Geological Society of America Bulletin, 75:287–306.
Wise, D. U. 1976. Linesmanship, guidelines for a thriving geologic artform. Pp. 635–636 in Proceedings of the 1st International Conference on New Basement Tectonics. Utah Geological Association, Salt Lake City.
Wong, I. 1990. Seismotectonics of the coast ranges in the vicinity of Lake Berryessa, Northern California. Bulletin of Seismology Society of America, 80:935–950.
Wood, W. W., and L. A. Fernandez. 1988. Volcanic rocks. Pp. 353–365 in Hydrogeology, W. Back, J. S. Rossensbein, and P. R. Seaber, eds. Boulder, Colo.: Geological Society of America.
Wu, D., and R. Bruhn. 1992. Geometry of normal fault surfaces in controlling crustal deformation and rupture segmentation. Geological Society of America Abstracts with Programs, 24(6):69.
Wu, H., and D. D. Pollard. 1991. Fracture spacing, density, and distribution in layered rock mass: results from a new experimental technique. Pp. 1175–1184 in Rock Mechanics as a Multidisciplinary Science, Proceedings of the 32nd United States Symposium on Rock Mechanics. Rotterdam: A. A. Balkema.
Xiao, H. B., F. A. Dahlen, and J. Suppe. 1991. Mechanics of extensional wedges. Journal of Geophyical Research, 96:10,301–10,318.
Zhao, G., and A. M. Johnson. 1992. Sequence of deformations recorded in joints and faults, Arches National Park, Utah. Journal of Structural Geology, 14:225–236.
Zoback, M. D., and J. H. Healy. 1992. In situ stress measurements to 3.5 km depth in the Cajon Pass scientific research borehole: implications for the mechanics of crustal faulting. Journal of Geophysical Research, 97:5039-5057.
Zoback, M. D., M. L. Zoback, V. S. Mount, J. Suppe, J. P. Eaton, J. H. Healy, D. Oppenheimer, P. Reasenberg, L. Jones, C. B. Raleigh, I. G. Wong, O. Scotti, and C. Wentworth. 1987. New evidence on the state of stress of the San Andreas fault system. Science, 238:1105–1111.


