
Part III:
The Cost/Performance Trade-off Model
As stated in the overview of this report, the JPM Project and the related cost/performance trade-off model grew out of the misnorming of the ASVAB, the congressional interest in the relationship between job performance and recruit quality, and the lack of a clear, coherent framework for establishing recruit quality goals. Throughout the 1980s, the continuing question was: How much quality is enough? With the current level of high quality, the downsizing of the force, and the supply of high-quality recruits exceeding demand, the question now becomes: What level of quality is most cost-effective? The cost/performance trade-off model has been developed as a tool to aid analysts and policy decision makers in answering questions about recruit quality needs and in justifying the costs associated with selected quality mixes. Here we provide a context for the personnel planning process.
Personnel planners in the Services attempt to staff the force structure—divisions, air wings and battle groups, and the supporting infrastructure—with the numbers and types of people necessary to maintain desired readiness levels As part of this process, the Services must annually recruit numbers of new entrants to the enlisted force to replace those who leave or retire and to reflect planned growth or shrinkage in the overall size of the force. In today's All-Volunteer Force, the military services annually recruit about 200,000 young men and women to become soldiers, sailors, airmen, and marines. These young people receive basic military training and specialized skill training in more than 900 different military occupations. For
the military services and the taxpayer, this represents the beginning stages of a significant investment in recruiting resources, training resources, and compensation.
Not all applicants are equally capable of completing basic training or the skill training necessary in the technically demanding jobs constituting an increasing proportion of the modern armed forces. The success achieved by the Services in recruiting the right kinds of young men and women will determine not only how large this investment will be, but also, in part, how effectively the armed forces will meet the challenge of defending the nation's interests. For these reasons, the Services have an incentive to be selective in recruiting only those who are likely to succeed.
For individuals in the youth population, the opportunity to serve one's country is an important part of citizenship. It should not be limited or denied without compelling reasons. Moreover, for many of the nation's youth, service in the armed forces offers the chance to obtain valuable experience and training that could be a major determinant of the potential recruit's future economic well-being. Policies that determine how selective the Services will be in choosing applicants, therefore, are important, and entail a complex array of trade-offs. More selective recruiting policies tend to reduce the effective size of the youth labor market from which the Services may recruit, raising recruiting costs. Presumably, the investment in higher recruiting costs resulting from a more selective policy yields a return in the form of a more capable recruit—one who is more likely to complete training successfully and to perform well on the job. But, because these more selective policies result not only in higher initial recruiting costs, but also deny service opportunities to some willing applicants, the case for more selective recruiting policy should be well grounded in logic. Moreover, the empirical links between higher selectivity, performance, and cost should be well-established.
The Services set their recruit selection policies in terms of applicants' scores on the Armed Forces Qualification Test (AFQT) and an applicant's level of education. The AFQT consists of 4 of the 10 subtests of the Armed Services Vocational Aptitude Battery (ASVAB), the enlistment screening and classification test administered to all applicants. The primary educational criterion is whether the applicant possesses a high school diploma. Those high school graduates scoring in the top half of the distribution on the AFQT (Categories I–IIIA) are considered high-quality applicants.
Recruiting goals are set in terms of the proportion of high-quality recruits desired. A more selective recruiting policy typically means attempting to recruit a larger portion of high-quality applicants. The applicant's score on the AFQT, as well as education status, determines whether the applicant is qualified for the Service. In addition, the Services use various combinations of the ASVAB subtests to form composite scores that are
relevant to particular jobs or occupational categories. The applicant's score on the relevant composite must exceed the minimum score established by the Service for that occupation in order to be accepted for training in that particular occupation. Hence, the composite scores determine which jobs or occupational groups the applicant is qualified for. In practice, an individual's AFQT score is highly correlated with most other composite scores, so that the higher-quality applicant, as measured by AFQT, also meets the minimum qualifications for more jobs.
A large number of studies have demonstrated that high-quality recruits—those with above average scores on the AFQT and a high school diploma—perform better in the military, whether performance is measured by training outcomes, job performance tests, speed of promotion, or first-term attrition. But high-quality individuals also cost more to recruit in the volunteer force environment, in which the military must compete with other employers for the services of talented individuals. Therefore, the Services attempt to set recruit quality goals that balance the higher performance and lower attrition costs of high-quality individuals with their increased recruiting costs.
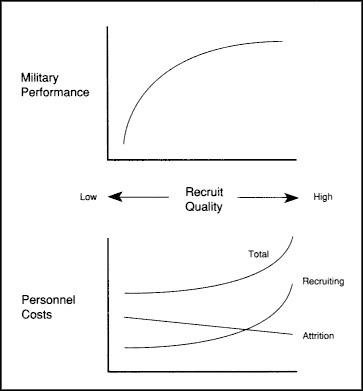
Figure 1 depicts the trade-off between costs and performance that the Department of Defense faces in setting recruit quality goals. As the level of recruit quality increases, both expected military performance and recruiting costs rise. Higher recruiting costs are offset by decreases in attrition-related costs. This figure also illustrates the two empirical linkages that must be established to provide the quantitative measures of the trade-off that are necessary for policy decisions. First, we must know how different levels of recruit quality affect military performance—the top half of the figure. And second, we must understand how changes in average recruit quality affect the components of personnel costs shown in the bottom half.
Understanding these linkages is important for two reasons. First, there should be a solid rationale, grounded in performance and cost differences, for choosing among applicants for military service. To deny a citizen the opportunity to serve his or her country is a serious matter that must be justified with compelling reasons. Second, Congress, as the agent of the taxpayer, has insisted that DoD be able to justify, in terms of increased military performance, the costs of a higher-quality enlisted force. Understanding these linkages is necessary to achieve the maximum return from a declining defense personnel budget.
The first paper in this section, prepared by D. Alton Smith and Paul F. Hogan, provides an overview of the cost/performance trade-off model. The second paper, by Paul F. Hogan and Dickie A. Harris, presents a discussion of the policy and management applications of the model.
The Accession Quality Cost/Performance Trade-off Model
D. Alton Smith and Paul F. Hogan
INTRODUCTION
This paper describes a model that defines the quantitative linkages between recruit quality, military performance, and personnel costs and uses that information to determine the cost/performance trade-off options available to the Department of Defense (DoD). The model was jointly developed by the Systems Research and Applications (SRA) Corporation and the Human Resources Research Organization (HumRRO) for the Office of the Assistant Secretary of Defense (Personnel and Readiness). It builds directly on the results from the Joint-Service Job Performance Measurement/Enlistment Standards (JPM) Project, which developed and implemented handson job performance tests for enlisted personnel.
The Accession Quality Cost/Performance Trade-off Model has many potential applications in accession planning. In particular, it can assist policy makers in:
-
Building an accession program, which is the target number of accessions by quality category and occupation group and the associated recruiting resource requirements.
-
Evaluating the performance and cost implications of changes in the accession program caused by variation in manpower requirements, recruiting market conditions, or budgets for Service recruiting efforts.
-
Efficiently setting job classification standards, the cutoff scores con-
-
structed from the Armed Forces Vocational Aptitude Battery (ASVAB) used to screen entrants into particular occupations.
-
Assessing the savings potential associated with new processes and tools for selecting and classifying military recruits.
Other papers in this volume describe these applications in more detail and provide examples of the results generated by the model.
This paper is organized as follows. The first section describes the components of the model and identifies some of the strengths and weaknesses of the analytical approach. This is necessarily a summary. More details on the structure of the model and the underlying research can be found in McCloy et al. (1992).
To facilitate its use in policy analysis, we have implemented the analytical model for all four Services in a microcomputer software program, which is described in Human Resources Research Organization et al. (1993). The second section uses the model in two different types of validation tests: comparing model results against actual accession cohorts and varying individual elements in the scenario defining an optimization run. The final section provides a summary of the paper.
DESCRIPTION OF THE MODEL
The structure of the model is shown in Figure 1. It selects, for a set of occupation groups, the number of accessions by recruit quality category that minimizes the sum of recruiting, training, and compensation costs while meeting first-term performance and personnel strength goals. Because the quality-performance and quality-cost relationships vary significantly across the Services, a separate version of the model has been developed for each Service.1
It is important to emphasize that the model does not choose the best overall recruit quality level, only the cost-minimizing level for a given amount of performance. Selecting the best overall level requires information on the dollar value of performance so that performance gains can be weighed directly against increased costs. In a market setting, in which profit-maximizing firms compete for the services of employees, one can argue that the compensation paid to workers represents the value of their performance. It is much more difficult to make the same claim for public-
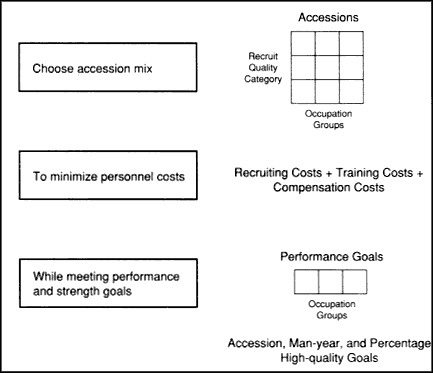
Figure 1 Structure of the model.
sector organizations that do not compete. Without using what must be arbitrary performance valuations, the model can be used to define the efficient cost and performance combinations, an improvement in the information currently available to policy makers.2
In mathematical terms, the model is a constrained minimization problem with the three elements: accessions by recruit quality category and occupation, which are the variables for which we solve; performance and personnel strength goals, which define the constraints on the problem; and personnel costs, which comprise the objective function. We describe the model in terms of these three elements. An explicit mathematical statement of the model is found in the technical appendix at the end of this paper.
Variables: Accessions by Recruit Category and Occupation Group
The model solves for 360 variables for each Service—accessions in 10 recruit quality categories for each of 36 occupation groups.
Recruit Categories
Although there are many ways to categorize recruit quality, our choice should be driven by the policy applications of the model. Therefore, we use the Armed Forces Qualification Test (AFQT) score and high school graduation status, the two characteristics used to establish recruiting goals and measure recruiting performance for DoD. In particular, 10 recruit quality categories are defined by the interaction of 5 standard AFQT score groups (called Category I, II, IIIA, IIIB, and IV) and 2 high school graduation groups (those with high school diplomas and those without).3
Additional categories are often used in managing the recruiting process. For example, all Services track enlistments separately by gender because some occupations, by regulation or statute, cannot be filled by women. Although the model would be more useful to accession planners if its recruit categories were also defined by gender, there is little research measuring the linkage between female accession quality and recruiting costs. Without information on both the quality-performance and quality-cost relationships, we cannot add more recruit categories to the model.
Occupation Groups
Both the quality-performance and quality-cost linkages vary with military occupation, which means that the minimum-cost level of recruit quality will also vary by occupation. As an example, consider two occupations with different training costs but the same overall performance goal. The least-cost solution for staffing these occupations will have fewer recruits, of a higher average quality, in the occupation with high training costs. Because of their lower turnover, fewer high-quality recruits have to be trained to generate the same amount of performance, conserving training resources. Given these differences, it is important to understand how high-quality recruits should be allocated across occupations.
Ideally, the aggregate quality requirement for a Service would be determined as the sum of the levels of quality needed in each enlisted occupation
in that Service. This would yield not only aggregate recruit quality goals but also targets for the process of classifying recruits into occupations. We use grouped, rather than individual, occupations in the model for two practical reasons. First, as described by McCloy in this volume, the performance data used in our model cannot support distinct estimates of the relationship between performance and entry characteristics for every enlisted occupation in DoD. And second, increasing the number of occupations also increases the number of variables in the model. With up to 350 occupations in each Service, finding a solution to the constrained optimization problem becomes time-consuming enough to detract from the model's usefulness as a policy analysis tool.
There are 36 occupation groups in the model, which are defined hierarchically. At the top, occupations are divided into nine groups based on one-digit DoD occupation codes.4 These codes provide a common classification of occupations across Services, facilitating the definition of performance and strength goals. Each of these nine groups is further divided into four subgroups on the basis of training costs and an index of occupation characteristics.5 These subgroups were chosen to increase the within-group homogeneity of the occupation groups on variables that are central to the cost-minimization problem, such as training costs. The more homogeneous the groups, the less error is introduced into the recruit quality solution by the aggregation of individual occupations.
Constraints: Performance Goals by Occupation
This is one of the more complex parts of the model. We look first at the definition of performance used in the model, then describe how performance is measured by occupation group and recruit quality category, and finally discuss the setting of performance goals.
Definition of Performance
In the model, performance for an occupation group is the sum of expected hands-on performance test scores over the first term of service for
recruits assigned to that group. Specifically, Pi, the performance value for occupation group i, is defined as
where
-
Aij is the number of accessions from recruit category j into occupation group i. The size of an accession cohort for a Service is equal to the sum of all A's, which, in fiscal 1990, ranged from 90,000 for the Army to 34,000 for the Marine Corps.
-
is the survival rate to year of service (YOS) t for a category j recruit in occupation group i. Survival rates are the proportion of accessions still in the military at time t; they range from 0 to 1 and decrease with time in service. The model uses a four-year initial term of service to calculate performance values.
-
is the predicted hands-on performance test score at YOS t for a recruit from category j entering occupation group i. The test scores are the percentage of tested task steps completed correctly and can be roughly interpreted as the percentage of the job done correctly. Therefore, the scores can potentially range from 0 to 100. We discuss the approach used to predict these scores below.
The performance value for an occupation group is the result of two calculations. The term in parentheses is the survival-weighted sum of predicted performance test scores over the first term for individuals from a particular recruit category enlisting in that occupation group. As a simple example, assume that AFQT Category I high school graduates enlisting in the Communications and Intelligence group typically stay for four years, making the survival rates all 1, and score 75 on the performance test each year. The expected first-term performance value for these individuals would equal 300.6 In the second part, occupation group performance is calculated as the weighted sum across recruit categories of these expected scores, with weights equal to the number of accessions from each category.
Occupation group performance is a function of the number and quality distribution of recruits into that group, with quality affecting performance both through the hands-on performance test score and the probability of
attrition. Although the use of hands-on tests represents an improvement over performance metrics based on training outcomes or job knowledge tests, this measure of occupation performance has four limitations:
-
First, it reflects only the ability to perform selected tasks for each job at the entry level. It ignores other dimensions of military job performance, such as leadership potential.
-
Second, the same amount of performance for an occupation can be obtained with different combinations of the size and average quality of an accession cohort. As a practical matter, staffing requirements restrict the flexibility to trade off between the number of recruits and their average quality. For example, each tank requires a crew of four to operate efficiently, regardless of the ability of individual crew members.
-
Third, equation (1) assumes that the first and last high-quality individual added to an occupation yield the same gain in performance. In fact, the benefit to group performance of that first high-quality recruit is probably greater than the marginal benefit of those that follow.7
-
Fourth, military performance is, in most cases, a function of both personnel and equipment performance. When force structure (i.e., the number and type of military units) can be varied, the appropriate level of recruit quality will likely be different than that estimated for a fixed force structure.8
Fortunately, we can work around some of these limitations by using strength constraints in the model, as described below.
Measuring Performance
Constructing performance values in the model would be straightforward if observations on hands-on performance test scores were available for all occupations, by recruit category and time in service. However, the cost of developing and administering hands-on performance tests limited the data available from the JPM Project. Counting all four Services, we could use results from just 24 occupations to estimate the relationship between recruit
quality and job performance for the model.9 To generalize from this sample to a set of performance scores for the occupation groups in equation (1), we estimated a multilevel model linking performance scores with characteristics of the test taker and characteristics of the job, as described in this volume by McCloy.10 For the purposes of the cost/performance trade-off model, the essential advantage of this specification is that the hands-on performance test scores required for equation (1) can be predicted for any occupation (or group of occupations) if we know the relevant characteristics of the occupation.
The parameters of the linkage equation were estimated using a sample of approximately 8,400 test scores obtained for the 24 JPM occupations. While there are many ways to evaluate the estimation results, we will focus on two general findings about the AFQT-performance relationship, which is central to the functioning of the model. First, on average, there is a positive, statistically significant correlation between AFQT and job performance. More important, the size of the correlation is roughly consistent with that estimated in other studies using different performance metrics.11
Second, our ability to measure the differences in the AFQT-performance relationship across occupations is probably restricted by the small sample of occupations. Although occupations were selected to span the major types of occupations, they turned out not to span the total range of variation in factor scores. As a result, the coefficients that capture the differences in the AFQT-performance relationship across occupations are often not statistically significant and vary with small changes in the functional form of the statistical model. In a later section, we discuss the implications of this finding for the results of the model.
In contrast to the hands-on performance test scores, obtaining survival rates for the performance equation is relatively simple. Longitudinal personnel records, sorted by occupation group and recruit category, can be used to estimate the probability of survival to various time in service points.
Setting Performance Goals
To complete the performance constraints, the model requires the user to specify performance goals for each of the occupation groups. The process of setting these goals raises three issues.
First, in contrast to determining the number of enlisted personnel required in each occupation, there are no existing procedures within DoD for estimating personnel performance requirements, using this or any other performance metric. As a result, performance goals for the model have to be set by some sort of expert judgment. In the guidebook developed to assist users of the model, we recommend starting with the calculated performance of a cohort that is generally viewed as having achieved satisfactory performance levels and then making adjustments based on anticipated changes in force structure and performance requirements by occupation group.
Second, as currently structured, the model requires goals for the performance of individual accession cohorts over the first term of their military service. For policy-making purposes, it would be preferable to set a series of annual performance goals, which include the contribution of all Service members in the occupation, and have the model derive the series of cohort performance values required to meet the annual goals.
Two problems make this model more difficult to implement than the one outlined here. The job performance test data available from the JPM Project include only tests of first-term personnel within a limited range of years of service. These data are not sufficient to develop the quality-performance relationships that would be required for members of the career force.12 In addition, we have shown elsewhere that the accession programs generated by this type of model can depend arbitrarily on the number of fiscal years modeled, which is obviously not a desirable characteristic. This problem occurs because, as fiscal years are added to the model, the career lengths used to evaluate accession cohort performance and costs change, leading in most cases to different solutions.13
Third, the implementation of the performance constraints does not currently recognize that, because it is generated by a statistical model, the performance for an occupation is really the expected value for an underlying distribution of possible performance values. Strictly speaking, this means that the model chooses the accession mix that meets or exceeds the performance goal 50 percent of the time, which may not be sufficient. It also
means that the value of improved entry tests, which would reduce the unexplained variance in performance outcomes, cannot be measured in the model. Using performance constraints that recognize the variation in the predicted performance test scores would address both of these issues.14
Constraints: Strength Goals
As noted above, we need strength constraints in the model primarily to adjust for the limitations of the performance metric. Three types of strength constraints are included.
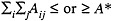
First, a total accession constraint ensures that the number of recruits selected by the model fills the number of enlisted vacancies anticipated by a Service. Thus, the model can be prevented from generating solutions that are inconsistent with manning requirements as determined by strength planning models.
Second, a goal can be set for the number of first-term man-years generated by a cohort over the first term of military service. This constraint forces the model to choose an accession cohort that will, in the long run, not alter the desired mix between first-term and career enlisted personnel. Thus, it helps deal with the suboptimization problem that could arise because of the first-term focus of the model.
Third, minimum high-quality percentage constraints (with high quality specifically defined as AFQT I to IliA, high school diploma graduates) can be placed on the solution by occupation. One adds these constraints to force a solution that recognizes the need for some high-quality recruits in every occupation, based either on their potential as future managers in the occupation or their role in increasing group performance.
Objective Function: Recruiting, Training, and Compensation Costs
The model minimizes the sum of costs required to recruit, train, and pay an accession cohort over the first term of service. Although the smallest of the three cost categories, recruiting costs have the biggest impact on the structure of the model. In particular, because of the nature of recruiting costs, one must jointly solve for the cost-minimizing level of recruit quality in all occupation groups; a group-by-group approach will not work. The requirement to find a simultaneous solution to recruit quality goals increases
the number of variables in the cost-minimization problem and makes it necessary to estimate the quality-performance linkage across all occupations, a problem already discussed.
Recruiting Costs
Recruiting is characterized by average costs that increase with the total number of high-quality individuals recruited. To attract more high-quality individuals into military service, either the monetary incentives for enlisting or the ''sales" effort must increase, causing total costs to rise faster than the number of recruits. With increasing average costs, the cost/performance trade-off in occupation A depends not only on the number of high-quality individuals recruited for that occupation, but also on the number recruited for the other occupations. For example, an increase in the number of high-quality individuals recruited for occupation B increases the cost of quality to occupation A, reducing the attractiveness of high-quality individuals in that occupation relative to other quality categories. The increase in quality for occupation B, therefore, leads to a reduction in the cost-effective quality level for occupation A.15
In the model, the costs to recruit a particular mix of individuals by quality level are predicted by a cost function. In economics, a cost function describes the minimum costs of producing a particular quantity of output. It is derived from a production function, which shows the relationship between the level of inputs and the output produced, and the prices of those inputs. For recruiting, our production function is based on estimates in the literature of the effect of recruiting resources, such as advertising, and the effect of recruiting market characteristics, such as unemployment, on the number of high-quality enlistments. The depth of the literature supporting the specification of these production functions varies by Service, with the greatest number of studies available for the Army and the least for the Air Force. In the model, we start with what we believe are the best parameter estimates but allow the analyst to modify the parameters of the production function in the software model. The prices of recruiting resources are
calculated from recruiting budgets in a base year. The technical appendix describes the details of the recruiting cost function.
The advantages of determining recruiting costs from the underlying production function are threefold. First, the cost function estimates minimum recruiting costs for a particular mix of enlistments costs, a necessary input in determining the minimum personnel costs for a given set of performance goals.16 Second, the cost function correctly captures the increasing average cost nature of recruiting costs.17 This is particularly important given today's recruiting policy issues. Assuming constant average costs would overstate the costs of recruit quality for the smaller enlistment cohorts anticipated in the near future, resulting in recruit quality goals that are too low. Third, cost function estimates of recruiting costs vary with changes in the recruiting market, such as the level of unemployment. This provides the analytical link needed to estimate recruit quality goals for different recruiting environments.
Although the parameters of the underlying production function are selected judgmentally from existing research, the recruiting cost function has been applied to all four Services with reasonable results. For example, the cost function predicts levels of recruiting resource usage and total costs that are within 5 percent of the actual resource usage and costs for a base year. Also, in response to price changes, the cost function adjusts the resource mix as expected to achieve the minimum recruiting costs. For example, when the price of a recruiter increases by 10 percent, total recruiting costs increase by less than 10 percent of the costs associated with recruiters, as more of other recruiting resources are substituted for the relatively more expensive recruiters.
The recruiting cost function in the model is limited, however, by the underlying enlistment supply research in two ways. First, enlistment supply research for most Services has focused primarily on the high-quality group. As a result, it is not possible to implement a recruiting cost function with the 10 quality categories defined above. Instead, we base our cost function on three groups of recruit quality categories, using additional constraints to ensure that the proportion of AFQT I graduates in the high-quality group, for instance, is consistent with historical accession patterns.
Second, our recruiting cost function assumes that the marginal cost of accessing an individual from one of the quality groups does not vary across occupations. This is clearly wrong, because enlistment incentives are usu-
ally targeted on hard-to-fill occupations. Unfortunately, we don't have estimates of the enlistment supply parameters required to efficiently set enlistment bonuses by occupation, as well as relative to other recruiting resources.
Training and Compensation Costs
The derivation of training and compensation costs in the model is much simpler. The average cost of training an individual from a particular recruit category in a given occupation group is determined from two factors. First, we calculate the average cost per graduate of basic and initial skill training in the occupation group using Service-supplied estimates of course costs. The initial skill training cost for an occupation group is an accession-weighted average of the initial skill training costs for all occupations in the group. Then, these costs are adjusted by training survival rates for the recruit category to obtain the per accession cost of training. Thus, the average training costs within an occupation group are lower for high-quality individuals, who have greater survival rates.
Expected compensation costs over the first term of service are calculated from survival rates and average compensation (basic pay, allowances, and retirement accrual as reported in DoD compensation tables) by year of service.
VALIDATION OF THE MODEL
To facilitate its use in policy evaluation, the model described in the previous section has been implemented in a microcomputer program. 18Figure 2 summarizes the elements that define a scenario and the results generated by each optimization run.
In this section, we will use the model in two types of validation tests. Setting performance goals equal to the performance expected from the cohorts entering each Service in fiscal 1990, we compare the accession cohorts selected by the model to meet these goals at minimum cost with the actual cohorts accessed. In the second set of tests, we will vary individual elements of the run scenarios and compare the effects of those changes on personnel strength and costs with what would be predicted from theory.
|
Scenario Elements |
|
• Performance goals, by one-digit occupation group • Total accessions or man-year constraint • Minimum high-quality percentages, by one-digit occupation group • Parameters of the recruit production function • Inflation factors for recruiting resources, training costs, and military compensation |
|
Optimization Results |
|
• Number of accessions, by quality category and one-digit occupation group • Number of enlistment contracts, by quality category • Total performance and average performance per man-year, by one-digit occupation group • Man-years, by occupation and fiscal year • Recruiting, training, and compensation costs • Minimum-cost mix of recruiting resources • Assumptions and parameters used in the scenario |
Figure 2 Model scenario and results.
Model Selections Versus Actual Accession Cohorts
Table 1 compares personnel strengths, percent high-quality accessions, and personnel costs for the actual fiscal 1990 accession cohorts and those selected by the model. To provide a common framework for comparison, "actual" man-years and personnel costs are calculated by applying the survival rates and cost functions in the model to the actual distribution of accessions by quality category and occupation group in fiscal 1990. To generate the model's selected cohort for each Service, we set performance goals for each occupation group equal to the performance expected from the actual fiscal 1990 accession cohort, constrained total man-years to equal the man-years generated by the fiscal 1990 cohort, and established minimums of 40 percent high quality for each occupation group. Thus, the model cohorts are chosen to provide the same performance and man-years as the actual fiscal 1990 cohorts, and we ensure a minimum level of high-quality individuals in each occupation group. Although the overall level of quality selected by the model is always less than the average quality of the actual fiscal 1990 accession cohorts, the differences are not large. Reasonable
TABLE 1 Fiscal 1990 Actuals Versus Model Results
|
|
Army |
Navy |
Marine Corps |
Air Force |
||||
|
Results |
Actual |
Model |
Actual |
Model |
Actual |
Model |
Actual |
Model |
|
Personnel strength (Thousands) |
|
|
|
|
|
|
|
|
|
Accessions |
84.4 |
84.0 |
71.2 |
70.4 |
32.1 |
32.4 |
34.6 |
34.4 |
|
First-term man-years |
243.2 |
243.2 |
218.2 |
218.2 |
96.0 |
96.0 |
110.6 |
110.6 |
|
Percentage high-quality accessions |
|
|
|
|
|
|
|
|
|
Infantry, gun crews, seamanship |
57 |
66 |
45 |
40 |
50 |
55 |
82 |
99 |
|
Electronic equipment repair |
82 |
100 |
78 |
63 |
91 |
45 |
97 |
100 |
|
Communications, intelligence |
73 |
79 |
64 |
55 |
63 |
58 |
93 |
94 |
|
Health care |
79 |
40 |
59 |
91 |
NA |
NA |
91 |
99 |
|
Other technical specialists |
61 |
77 |
77 |
40 |
87 |
40 |
89 |
97 |
|
Support and administration |
64 |
40 |
60 |
57 |
77 |
43 |
87 |
73 |
|
Mechanical equipment repair |
57 |
40 |
54 |
57 |
69 |
63 |
79 |
92 |
|
Craftsmen |
53 |
40 |
40 |
56 |
69 |
43 |
75 |
91 |
|
Service and supply handlers |
53 |
52 |
23 |
44 |
50 |
70 |
79 |
58 |
|
All occupations |
62 |
59 |
54 |
52 |
61 |
55 |
85 |
80 |
|
Personnel costs (millions) |
|
|
|
|
|
|
|
|
|
Recruiting |
632 |
549 |
340 |
313 |
125 |
121 |
167 |
162 |
|
Training |
1,539 |
1,527 |
1,292 |
1,255 |
490 |
482 |
376 |
374 |
|
Compensation |
4,525 |
4,530 |
4,172 |
4,180 |
1,837 |
1,837 |
2,126 |
2,127 |
|
Total |
6,696 |
6,606 |
5,803 |
5,748 |
2,452 |
2,439 |
2,669 |
2,663 |
variation in the parameters of the model, such as the enlistment production function, will generate quality levels that exceed the actual levels for each Service. In most models, predicting results close to actual results is an unambiguous validation test. In this model, however, these results are comforting only to the extent that one believes that the current DoD process for setting quality goals, like the model, attempts to find the cost-effective solution.
The table also shows that the models were less successful in replicating the actual quality levels by occupation group. Only 13 out of 35 occupation groups had model results within 10 percentage points of the actual values.19 There are two potential explanations for the mismatches. First, inaccuracies in measuring either the quality-performance relationship or recruiting costs at the occupation group level, both potential problems in the model, would cause the model to select the wrong quality content. Second, the Services' processes for setting quality goals by occupation, which are not driven solely by performance and cost considerations, may not be producing the cost-effective solution either.
The personnel costs associated with the four cohorts selected by the model are $161 million less than the costs estimated for the actual cohorts. Total recruiting costs are lower because the overall quality of accessions is lower than in the actual cohorts, but training costs also fall because the model allocates high-quality individuals across the occupation groups differently. These savings, while large in absolute value, represent less than 1 percent of the estimated costs of recruiting, training, and paying the actual fiscal 1990 cohorts.
Variation in Model Scenarios
A less ambiguous test of the model is whether the quality levels and associated personnel costs respond as expected to changes in individual elements of the run scenario, such as performance goals. Table 2 shows the results of four variations in the definition of the run scenario for the Navy.20 In all cases, we will be comparing results with the base case, which shows the Navy cohort selected to minimize personnel costs while meeting fiscal 1990 performance levels.21
|
19 |
The differences would be more striking if we had not imposed a minimum percentage of high-quality accessions by occupation group. |
|
20 |
Qualitatively similar results are obtained for the other Services. |
|
21 |
The results here differ from Table 1 because we have not imposed the man-year and minimum high-quality constraints on the solution. It is easier to interpret the results of changing scenario elements when there is only one set of constraints applied. |
TABLE 2 Results of Varying Elements of the Model Scenario
|
Results |
Base Case |
Performance Reduced 10% (1) |
Unemployment Increased (2) |
Training Costs Increased 25% (3) |
Performance Equals Retention (4) |
|
Personnel strength (Thousands) |
|
|
|
|
|
|
Accessions |
70.7 |
63.4 |
70.3 |
70.5 |
71.0 |
|
First-term man-years |
218.7 |
196.1 |
218.0 |
218.3 |
217.8 |
|
Percentage high-quality accessions |
|
|
|
|
|
|
All occupations |
46.4 |
50.9 |
50.8 |
48.0 |
24.1 |
|
Personnel costs (millions) |
|
|
|
|
|
|
Recruiting |
292.2 |
266.6 |
291.3 |
297.6 |
242.8 |
|
Training |
1,252.9 |
1,123.8 |
1,248.6 |
1,563.7 |
1,252.3 |
|
Compensation |
4,188.4 |
3,758.6 |
4,177.7 |
4,185.0 |
4,173.6 |
|
Total |
5,733.5 |
5,149.0 |
5,717.6 |
6,046.4 |
5,668.7 |
Scenario 1: Lower Performance Goals
A timely question for recruiting policy is how quality goals should change as the size of military forces decline. For scenario 1, we decrease the performance goals for all occupations by 10 percent from fiscal 1990 levels. As would be expected, fewer accessions are required to meet the new performance goals. Note, however, that the selected cohort is more than 10 percent smaller, while the average quality and therefore the average performance per accession has increased. With smaller accession cohorts, the marginal cost of recruiting high-quality individuals decreases. On a performance-to-cost basis, high-quality individuals are now more attractive, and the model selects a higher average quality level for the accession cohort. Mirroring this result, relatively more resources are allocated to recruiting with the lower performance goals, as recruiting budgets decrease by less than the reduction in performance goals.
Scenario 2: A Higher Unemployment Rate
An increase in unemployment reduces the costs of recruiting high-quality individuals. If performance goals remain unchanged, the optimal percentage of high-quality enlistments should increase because these individuals are again more attractive on a performance-to-cost basis. As expected, the cost-minimizing percentage of high-quality enlistments for the Navy increases from 46.4 percent to 50.8 percent when the unemployment rate is increased from the fiscal 1990 level of 5.3 percent to 7.0 percent.22 To recruit the additional quality, recruiting budgets should remain about the same, even though recruiting is easier with higher unemployment. In other words, the model suggests that the Services should take advantage of the recruiting cost savings available in a slack labor market by recruiting more high-quality individuals.
Scenario 3: Increase in Training Costs
As the costs of training courses increase, it makes sense to select a higher-quality accession cohort because the lower attrition of that cohort conserves training costs. In scenario 3, we increase all training course costs by 25 percent; the remainder of the scenario elements are the same as in the base case. As expected, average quality increases from the base case. Total training costs increase by less than 25 percent because of the increased quality of the selected accession cohort.
Scenario 4: No Effect of Quality on Performances Scores
Suppose that performance scores were not available, so that performance could be measured only by the expected man-years contributed by individuals in different recruit quality categories. Under this definition, the additional performance obtained by recruiting a high-quality individual is less than that when performance includes variation in test scores. As a result, the cost-effective level of quality should fall. To test the contribution of the performance test scores to the determination of recruit quality goals, we ran the model with all performance test scores, the &!;'s in equation (1), set equal to 1. For the Navy example, we found that the cost-minimizing level of quality falls by half, to 24.1 percent. Clearly, being able to measure the additional job performance generated by high-quality individuals is important in establishing the correct recruit quality goals.
SUMMARY
Selecting accession quality goals is an important task in defense personnel planning. The chosen level of quality not only affects the average performance that can be expected during the first term of service from cohort members, but it also has a large effect on the future capability of the noncommissioned officer corps, as the military "grows" them from junior enlisted personnel. At the same time, accessing more quality increases the resources that must be devoted to recruiting.
The Accession Quality Cost/Performance Trade-off Model quantifies the linkages between recruit quality, first-term performance, and personnel costs and solves for the level of accession quality by occupation that minimizes the costs of achieving specified levels of performance. Building on the results from previous research into military job performance measurement and enlistment supply, performance equations and recruiting cost functions were estimated and incorporated, along with other information on attrition and training/compensation costs, into a nonlinear optimization model for each of the Services.
Initial tests of the model are promising. It provides quality goals and cost estimates that are generally reasonable, both in terms of historical experience and theoretical expectations. While not without flaws, the model, by quantifying the potential trade-off between performance and cost, should be a useful adjunct to the current processes for determining accession quality goals.
TECHNICAL APPENDIX
This appendix describes the optimization problem underlying the Accession Quality Cost/Performance Trade-off Model and outlines the derivation of the recruiting cost function.
The Optimization Problem
Objective Function
We choose the number of accessions, Aij, by occupation group i and recruit category j to minimize the sum of first-term recruiting, training, and compensation costs, given by

where
-
The first line shows the recruiting cost function, R. Its arguments include the number of high (H), medium (M), and low (L) quality contracts; the prices of recruiting resources, Rp; and recruiting market factors, RF. High-quality contracts are the sum of accessions in the AFQT I–IIIA diploma graduate categories, inflated by Delayed Entry Program (DEP) loss rates for each category, dj Medium-quality contracts are calculated from accessions in the AFQT I–IIIA nongraduate categories and the corresponding DEP loss rates. Low-quality contracts are computed from accessions and DEP loss rates for the remaining quality categories.
-
The second line shows the training cost calculations. TB and TI are the per-graduate variable costs associated with basic and initial skill training (which varies by occupation), respectively. The number of graduates equals the number of accessions times Sij, the survival rate from accession to the completion of basic training (superscript B) and from accession to completion of initial skill training (superscript I).
-
The third line shows compensation costs. Expected first-term com
-
pensation for an accession into occupation i from recruit category j is the sum of Ct, the discounted present value of compensation costs in YOS t and the survival rates to each YOS, Sij. Compensation includes basic pay (estimated using average promotion times), allowances, and the retirement accrual charge.
Constraints
These costs are minimized subject to the following set of constraints:
-
Minimum performance values by occupation group, specified as

where
 is the expected year t performance of a recruit from category j in occupation i and
  is the performance goal for occupation i.
 -
Recruit category distribution constraints, which allocate the number of high-, medium-, and low-quality accessions to the 10 underlying recruit categories in proportion to the accession population. These constraints are required because recruiting costs cannot be specified at the detailed recruit category level.
-
Total strength constraints, specified as
Accessions:
First-term man-years:
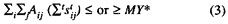
Accessions and man-years can be constrained to be greater than or less than the goals, A* and MY*.
-
High-quality accession constraints, which require a minimum proportion of these accessions in each occupation group.
Only the first two sets of constraints are always active. The strength constraints may be applied at the option of the user.
Optimization Approach
We approximate the recruiting cost function (see the next section) by a quadratic function in high-, medium-, and low-quality accessions. The parameters of the quadratic are estimated by ordinary least-squares regression on a data set generated by the ''true" recruiting cost function.
Because recruiting costs are quadratic, we can use quadratic program-
ming techniques to find the cost-minimizing number of accessions by quality categories and occupation group. If, during the optimization process, the trial solution varies significantly from the data used to approximate the recruiting cost function, a new approximation is calculated and the optimization is restarted.
Recruiting Cost Function
The recruiting cost function estimates the minimum costs of recruiting a specified number of individuals in each of the three recruit quality groups defined above. For the recruiting production function, we use results from the enlistment supply literature that describe how recruiting resources, such as recruiters, and market factors, such as unemployment, affect the number of enlistments.
We assume that the number of high-quality contracts signed annually can be described by an enlistment supply function of the form
where CH is the number of net high-quality contracts signed in a given year; RH is the number of recruiters "allocated" to the production of high-quality recruits; AD is the amount of advertising; B is the average enlistment bonus paid to high-quality recruits; ν is a price index; E is the average cost of education benefits paid to high-quality recruits in recruiting-year dollars; and F represents factors that affect the recruiting market, such as the civilian unemployment rate. The α's are the elasticities of high-quality enlistments with respect to recruiting resources, incentives, and market factors. ![]() is the constant for the enlistment supply function. (In this equation the superscripts are used as identifiers and not as exponents.)
is the constant for the enlistment supply function. (In this equation the superscripts are used as identifiers and not as exponents.)
We assume that the production of medium- and low-cost recruits is limited only by the recruiter effort devoted to testing these individuals and processing them into the military. This implies production functions of the form
where CM and CL are the number of medium-cost and low-quality contracts, respectively. RM and RL are the number of recruiters assigned to the medium- and low-cost missions.
The minimum costs associated with recruiting a given number of high-, medium-, and low-quality contracts—![]() —is given by the answer to the constrained minimization problem
—is given by the answer to the constrained minimization problem

The first term in brackets represents the recruiting budget; it has five components: the cost of maintaining the production recruiters, the cost of advertising, the expenditures on recruiting incentives, the costs of testing potential recruits, and the fixed costs of recruiting. The fixed costs do not affect the optimal mix of resources but are included in the cost function to provide recognizable budget amounts. The remaining terms in brackets ensure that costs are minimized subject to the constraints of meeting the desired mission.
The first-order conditions for equation (6) describe the solution to the cost minimization problem—the levels of recruiting resources and incentives required to recruit the specified mission at minimum cost. Substituting the first-order conditions into the recruiting budget formula, the first line in equation (6), yields the recruiting cost function
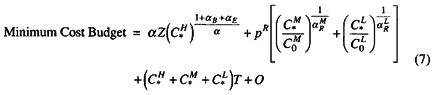
where
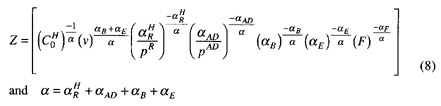
Note that the minimum cost budget is a function of four sets of factors: the high-, medium-, and low-contract mission; the parameters of the enlistment supply functions; the prices of recruiting resources; and conditions in the recruiting market.
REFERENCES
Armor, David J., Fernandez, Richard L., Bers, Kathy, and Schwarzbach, Donna 1982 Recruit Aptitudes and Army Job Performance. R-2874-MRAL. Santa Monica, Calif.: The Rand Corporation.
Black, Matthew 1988 Job performance and military enlistment standards. Pp. 171–198 in Bert F. Green, Jr., Hilda Wing, and Alexandra K. Wigdor, eds., Linking Military Enlistment Standards to Job Performance. Committee on the Performance of Military Personnel. Washington, D.C.: National Academy Press.
Daula, T., and Smith, D.A. 1992 Are high quality personnel cost-effective? The role of equipment costs. Social Science Quarterly June: 266–275.
Daula, T., Nord, R., and Smith, D.A. 1990 Inequality in the military: Fact or fiction? American Sociological Review October: 714–718.
Fernandez, Richard L., and Garfinkle, Jeffrey B. 1985 Setting Enlistment Standards and Matching Recruits to Jobs Using Job Performance Criteria . R-3067-MIL. Santa Monica: The Rand Corporation.
Hogan, Paul F., Harris, Dickie A., Smith, D. Alton, and Clifton, David 1990 Entry Standards for Military Service: A Cost/Performance Trade-off Model. Working paper presented at the Operations Research Society of America meeting, October 24, 1990.
Human Resources Research Organization, Systems Research and Applications Corporation, and Lewin/VHI, Inc. 1993 Accession Quality Cost-Performance Tradeoff Model (CPTM) Guidebook. Prepared for the Office of Accession Policy, Assistant Secretary of Defense, Force Management and Personnel.
McCloy, R.A., Harris, D.A., Barnes, J.D., Hogan, P.F., Smith, D.A., Clifton, D., and Sola, M. 1992 Accession Quality, Job Performance, and Cost: A Cost/Performance Trade-off Model (FR-PRD-92-11). Alexandria, Va.: Human Resources Research Organization.
Nord, Roy D., and Kearl, Cyril E. 1990 Estimating Cost-Effective Recruiting Missions: A Profit Maximizing Approach. Alexandria, Va.: U.S. Army Research Institute.
Steadman, Eugene 1981 Relationship of Enlistment Standards to Job Performance. Office of the Secretary of Defense working paper.
Policy and Management Applications of the Accession Quality Cost/Performance Trade-off Model
Paul F. Hogan and Dickie A. Harris
INTRODUCTION
The ultimate question in setting enlistment standards and recruiting goals, and in programming for recruiting budgets that can achieve those goals, is, "How much quality is enough?" Two other questions, however, must logically precede the answer to this question: "How much does additional recruit quality cost?," and ''How much additional performance is generated by higher recruit quality?" The Accession Quality Cost/Performance Trade-off Model attempts to bring together the answers to these two questions, providing policy makers with the information and insights necessary to address the initial question.
In its primary formulation, the model solves for a recruit quality mix that is able to meet desired first-term performance goals, by occupational category, at the lowest cost. It does so by trading the additional recruiting costs for the higher expected performance levels and lower expected attrition costs associated with higher-quality recruits. The model contains three key empirical linkages:
-
It links recruit quality categories, as defined by AFQT scores, to an empirical measure of actual, "hands-on" performance.
-
It links not only recruiting costs, but also training costs and compensation costs, to the recruit quality mix chosen.
-
It links personnel costs, including recruiting, training, and compensation costs, to the costs of generating performance.
Within this framework, a clear, formal definition of an "optimal" recruit quality mix is provided—something that has been absent from much of the debate on enlistment standards and recruit quality. The model solves for a stylized optimal recruit quality mix—one that minimizes the personnel costs of meeting first-term performance goals. From this optimization, recruit quality goals and implied enlistment standards emerge. The recruit quality goals become the best goals in the narrow sense that, within the costs captured in the model, higher- or lower-quality goals would result in greater costs.
In the model, performance is measured as "expected staff-years of performance." This is a combination of expected hands-on performance by occupation and expected retention rate by occupation. A potential recruit's expected performance is defined as the proportion of tasks a first-term enlisted member will have mastered in a given occupational group, as a function of the prospective recruit's characteristics. The relationship between the recruit's characteristics and expected future performance is determined statistically using data from the Joint-Service Job Performance Measurement/Enlistment Standards (JPM) Project (see McCloy, in this volume). Attrition rates, which determine expected staff-years, are also a function of recruit characteristics—most importantly education—and occupation.1
Different recruit quality categories, such as high school graduates scoring in Category I on the Armed Forces Qualification Test (AFQT), have different levels of expected performance in the model. Moreover, expected performance can vary across occupational categories. The model chooses recruits from different quality categories to meet occupation-specific performance goals at the lowest possible cost. Hence, there is substitution among recruit quality categories, based on differences between expected performance and cost, and substitution between numbers of recruits and quality of recruits. However, the model assumes that force structure—numbers of divisions, air wings, battle groups, and the equipment, such as tanks, planes and ships—is fixed. There is no substitution, for example, between numbers of tanks and the quality of personnel operating and maintaining tanks. Presumably, such substitution possibilities should be considered when making acquisition decisions. However, once made, the force
structure and its weapons system are fixed, for the purposes of determining recruit quality goals.2
The purpose of this paper is to illustrate potential applications of the model in areas of policy, management, and research. By illustrating potential applications, we hope that others in the defense personnel community will be encouraged to use the model and perhaps recommend improvements if it is found useful. An exposition of the model itself can be found in Smith and Hogan (in this volume) and in McCloy et al. (1992).
CONGRESSIONAL DIALOGUE ON RECRUIT QUALITY STANDARDS
Importance of Linkages
The Services request from Congress and expend recruiting resources to find and enlist "high-quality" recruits who might otherwise not enlist in the Armed Forces. At the same time, the Services choose not to offer enlistment contracts to other "lower-quality" applicants who want to enlist and for which fewer recruiting resources are required. Applicants are screened and divided into the categories based largely on two characteristics—possession of a high school diploma and scores on the Armed Services Vocational Aptitude Battery (ASVAB).
Recruiting goals are set in terms of the proportion of high-quality recruits desired. In general, the higher the proportion of high-quality recruits, the greater the recruiting resources required to achieve the goals, and the larger the numbers of applicants who want to enlist but who are denied. Congress, as an agent of the taxpayers and of the citizens who are applicants for military service, must, in its oversight role, be convinced that enlistment qualification standards and quality goals are fair to the taxpayer and to the applicant. On one hand, to deny a citizen the opportunity to
serve and defend his or her country because he or she is not "qualified," at the same time allocating more of taxpayers' dollars to achieve the more stringent recruiting goals, is acceptable only if there is a compelling rationale for the quality standards and goals. On the other hand, if quality goals are set too low, the nation and the taxpayer may bear a greater national security risk than they otherwise might, or the taxpayer may be forced to offset the risk through more costly ways of increasing the readiness and capability of the armed forces.
For these reasons, Congress is interested in understanding the method by which qualification standards and recruit quality goals are established. Some assurance is sought that goals and standards strike the right balance among first-term personnel performance, costs, and the interests of the applicant. In particular, Congress has insisted that qualification standards and recruit quality goals be directly linked to the performance or readiness of the first-term force. Over the years, it has been clear that the failure to present to Congress a rigorous method for determining recruit quality goals, based on empirical linkages between enlistment qualification criteria and subsequent job performance, has, during periods of stringent budgets, made recruiting resources and the recruit quality those resources represent a target for reductions. Without a vision of exactly what is sacrificed when recruit quality declines, the case for preserving recruiting budgets is weakened.
The relationship between possession of a high school diploma and the ability of a recruit to persevere and remain in service over the first term is one of the better-established empirical findings in military personnel research. This relationship was established early in the All-Volunteer Force era and was used successfully to screen potential recruits.3 However, the empirical relationship between ASVAB scores—in particular the subset of the ASVAB constituting the AFQT—and hands-on performance was not well established. Instead, the Services relied largely on the statistical relationship between training success and test scores. Although establishing qualification standards and recruiting goals based on such a relationship is not unreasonable, it is less compelling than a relationship based on actual job performance. In particular, there has been a concern that (a) the relationship between test scores and training success, although important, may arise because the cognitive skills leading to high test scores may be the same cognitive skills that determine success in training, and test scores may be less highly related to actual job performance and (b) spending additional
recruiting resources to obtain recruiting goals that are directly linked to first-term performance and readiness is more compelling than goals related to training success.
Role of the Model
The Accession Quality Cost/Performance Trade-off Model can potentially assist in this congressional dialogue regarding quality standards and recruiting goals, how they are formed, the factors affecting them, and the implications of reduction in recruiting budgets in three ways. First, the model provides a logical framework for discussing the determination of recruit quality goals. In the model, quality goals are determined by trade-offs between the greater performance contribution made by higher-quality recruits, the reduced training costs that result, and the higher recruiting costs associated with higher-quality recruits. In general, the model will prescribe higher-quality goals:
-
the greater the performance differences between high-quality recruits and other recruits;
-
the higher the costs of training; and
-
the lower the recruiting costs of high-quality recruits compared with other recruits, at the margin.
The model provides systematic predictions, consistent with this framework, for how recruiting quality goals and recruiting resources should change when total demand for accessions change, the unemployment rate increases, or there is a shift in the proportion of jobs for which higher-quality recruits have a significant performance advantage or for which training costs are high. These consistent relationships provide a logical foundation for articulating to Congress why the Services' recruit quality goals are changing and why additional recruiting resources may be justified.
Second, recruit quality is linked empirically to a measure of hands-on job performance. When reductions in recruiting budgets are proposed, the ensuing discussion of potential effects may proceed beyond the discussion of input quality—AFQT scores and education—to more output-related measures such as a decline in an index of the proportion of job tasks that the lower-quality recruit cohort is likely to master. Moreover, the quality standards and recruit quality goals are potentially linked to a measure closer to predicted job performance. Presumably, this serves to provide a more compelling rationale in terms of personnel readiness, one that is easier for Congress and its constituents to accept.
Third, the formulation links not only recruiting resources, but also training resources and compensation costs, to the determination of recruit quality
goals. This linkage should shift congressional interest from a narrow focus on the recruiting budget to the broader implications of recruit quality for training costs and other personnel costs. Saving an additional $5 million in the recruiting budget by lowering recruit quality standards will be more difficult to justify if it results in an additional $7 million in training costs.
We present below several examples of how the model may be useful in discussions with Congress concerning the recruiting budget.
Hypothetical Accession Program
Potentially the most important role that the model can fulfill is that of providing a rational framework for discussing recruit quality and recruiting budget issues with Congress. If used in this role, the model will provide a basis for asserting (a) why a particular recruit quality distribution is best, (b) why the recruiting budget is needed to buy that particular recruit quality mix, and (c) the consequences, for the performance and readiness of the first-term enlisted force, of failing to obtain the recruiting budget necessary to purchase the desired level of recruit quality.
Consider the following hypothetical example of the presentation of an Army recruiting program to the relevant subcommittees in Congress, for fiscal 199X (Table 1).
The hypothetical Army fiscal 199X recruiting program (represented by the Proposed Program row in the table) represents approximately a 20-percent reduction in accessions relative to the fiscal 1990 program. The detailed output from the model (not shown) indicates an exception for the military occupational specialties (MOS) in the electronics equipment repairers occupational category.4 Accessions for these occupations remain at about the fiscal 1990 level, reflecting a shift toward a somewhat more technologically intensive force. The proposed program calls for an accession plan of 65.6 percent high-quality recruits (AFQT Category I–IIIA high school graduates) and almost 100 percent high school graduates. It is the least costly way to achieve the first-term performance goals for this recruiting cohort and produces an expected average level of performance per staff-year over the first term of service of almost 57 percent.5
Alternative cases 1 and 2 show how the proposed program would change if the economic scenario, represented by the unemployment rate, were to
TABLE 1 Fiscal 199X Hypothetical Army Recruiting Program
|
|
Market Assumption (Unemployment) |
Accessions |
High-Quality Recruits |
High School Graduates |
Performance/ Staff-Yr.a |
Recruiting Budget |
Total Cost |
|
Proposed program |
6.5% |
67,500 |
65.6% |
99.2% |
56.9% |
$357.2M |
$5,258.8M |
|
Alternative case 1 |
7% |
67,500 |
66.9% |
99.2% |
57% |
$344.5M |
$5,240.7M |
|
Alternative case 2 |
5.3% |
67,500 |
64.9% |
99.3% |
56.7% |
$414.3M |
$5,319.5M. |
|
a performance per staff-year is total performance (which will equal the performance goals) divided by the total number of staff-years generated by the selected cohort over the first term of service. |
|||||||
vary. The performance goals remain unchanged, but the least costly mix of recruits to achieve those goals will change because the unemployment rate affects the relative cost of recruiting high-quality and lower-quality recruits. Case 1 shows that if the unemployment rate were 7 percent, the best program would include a higher level of high-quality recruits, and total costs would fall. Case 2 indicates that, at a lower unemployment rate, the best recruiting plan includes a slightly lower mix of high-quality recruits and a slightly higher total cost.
Question: Why is the proportion of high-quality recruits in the proposed accession plan higher than in the fiscal 1990 plan?
Answer: This plan allows us to achieve overall performance goals at the lowest cost. There are three reasons why the plan is somewhat more high-quality-intensive than the fiscal 1990 plan. First, with the reduction in overall accession demand from about 84,000 to about 67,500, the relative cost of high-quality recruits has declined. Therefore, it is less costly to achieve our goals by recruiting a slightly greater portion of high-quality recruits. Second, the unemployment rate in fiscal 199X is expected to be about 6.5 percent, compared with a rate of about 5.3 percent in fiscal 1990, a fact that also tends to reduce the cost of higher-quality recruits. Third, although the fiscal 199X plan is approximately a 20-percent reduction from fiscal 1990 accession levels, accessions in the electronics equipment repair category have remained at about the fiscal 1990 level. The training costs in this highly technical area are the highest in the Army, and the differences in expected performance between higher- and lower-scoring recruits in these areas are relatively large. Hence, we find that higher-quality personnel in this category reduce the costs of achieving the overall performance goals. For example, while the average expected performance per staff-year is about 57 percent overall, in the electronic equipment repair category it is 63 percent—the highest among the nine DoD occupational categories. (Note that the average expected performance per staff-year in the fiscal 1990 recruit cohort is about 56 percent). Since the proportion of recruits entering this occupational group increases, it is efficient (i.e., less costly) to meet performance goals by recruiting a slightly higher-quality mix.
Question: What are the consequences of reducing the proposed recruiting budget by $25 million?
Answer: A $25 million reduction in the recruiting budget would result in a failure to meet our performance or readiness goals for this cohort over the first term of service, or would force us to meet those goals in a more costly way. Overall first-term performance would decline by about 0.5 percent, the proportion of high-quality recruits would fall to about 59 per
cent, and the average expected performance per staff-year would decrease to about 56.3 percent.
The logical structure of the model provides a relatively solid basis for discussing why a particular accession program is, or is not, reasonable and the consequences of changing that program. The recruit quality level prescribed by the model is that which produces the specified level of first-term expected performance, as measured by the statistical relationship between recruit characteristics and hands-on performance, at the lowest cost to the taxpayer. Clearly the empirical measures and parameters in the model can be improved. But, perhaps for the first time, this framework, if generally accepted, will reduce the issues regarding the recruiting budget to two fundamental points: Is additional first-term performance worth its additional costs? Can we improve on the estimates of the empirical relationships underlying the framework?
The logical framework of the current model suggests the following propositions:
-
Changes in the recruiting budget result in changes in the quality mix of recruits, which, in turn, affects the expected performance of the first-term enlisted force.
-
The optimal quality mix depends, inter alia, on the state of the recruiting market, training costs, the distribution of openings among jobs, and the differences in expected performance among recruit quality categories.
These propositions and others are illustrated by the preceding example, by the examples that follow in this section, and by the section on program development and evaluation. Although estimates of certain empirical relationships can clearly be improved over time, the general framework of this model provides clear and reasonably convincing insights to the question of why a particular recruiting program is, or is not, the preferred program.
Proposed Recruiting Budget Reduction6
Consider a hypothetical case in which Congress is contemplating a reduction in the Navy's fiscal 1995 recruiting budget (Table 2). The requested recruiting budget for fiscal 1995 is estimated to result in 68,066 accessions, of which 51 percent are high-quality recruits (AFQT Category I–IIIA high school graduates) and 84.5 percent are high school diploma
TABLE 2 Implications of a Hypothetical Reduction in the Navy Recruiting Budget
|
|
Fiscal 1996 Navy Case |
12% Reduction in Recruiting Budget |
|
Recruiting costs |
$345.1M |
$302.4M |
|
Accessions |
68,066 |
68,066 |
|
Staff years |
216,813 |
216,813 |
|
Percent high quality |
51% |
38.9% |
|
Expected performance per staff-year |
61% |
55.3% |
graduates. Approximately 216,813 staff-years of service are expected to be produced by this accession cohort over the first term of service. The requested recruiting budget, derived from an application of the model, is $345 million for this program. The required budget, which is sensitive to the competitiveness of the recruiting market, was estimated under the assumption that the civilian unemployment rate would be 6.3 percent and the ratio of starting military pay to pay in the civilian youth labor market would be 0.89. The average expected performance per staff-year of service in this program would be 61.0. That is, based on the statistical relationship between recruit quality characteristics and expected performance over the first term of service, a typical recruit from this cohort will, on average over the first term of service, have been proficient in about 61.7 percent of the tasks required by the job, under one interpretation of this performance measure. In the early part of the term, proficiency or job performance will be lower than this, and it will be higher than this in the latter part of the term.
Given the intense competition for funding, Congress considers a 12-percent reduction from an already lean recruiting budget. However, authorized end strength is unchanged, so that approximately 68,066 accessions and 216,813 staff-years of service will still be required from this cohort over the first term of service. To obtain the same number of accessions with a 12-percent reduction in the recruiting budget, the percentage of high-quality recruits will decline from 51.1 to 38.9 percent in this hypothetical example. In the traditional analyses, this is as much as can be said. Because the model is directly linked to performance, however, we can say that the average performance per staff-year declines by about 10 percent, from 61 to about 55.3 percent. Under one interpretation of the performance metric, this means that the typical recruit from this cohort will be approxi-
mately 10 percent less proficient in the performance of his or her assigned tasks over the first term of service. Since high school graduation status is the main predictor of first-term attrition, the model selects only high school graduates in order to keep the same number of staff-years in both recruiting cases. In the case of reduced recruiting resources, the model selects lower aptitude applicants from the high school graduate pool.
Cost of Performance Increase
As the force structure declines over the next few years, the readiness level of the remaining force will become increasingly important. Two key questions may become: What is the price of increasing the expected performance of the first-term force? and Should all budgets, including recruiting, decline proportionately? We provide answers to these questions at two levels of accession and performance (Table 3). The first is at the level of accessions that entered the Army in fiscal 1990. In all cases, we assume a civilian unemployment rate of 6.3 percent. The total cost for exercising the model to obtain the minimum cost mix of recruits to achieve the performance level expected for that accession cohort was approximately $6,496.2 million. This includes recruiting, training, and compensation costs of an entry cohort of about 84,900 accessions, providing approximately 245,049 staff-years of service over the first term, with an average expected performance per staff-year of about 56.2 percent. Using the model again to estimate the cost of an accession cohort with a performance level that is 1 percent above this cohort's level, the total cost rises to $6,562.1 million. The additional cost of a 1 percent increase in performance, in this example, is about $65.9 million.
Now, consider the cost of providing a level of first-term performance that is about 20 percent less than that of the fiscal 1990 accession cohort.
TABLE-3 Cost of First-Term Performance
|
|
Fiscal 1990 Performance Level |
Fiscal 1990 Level less 20% |
||
|
|
— |
+1% |
— |
+1% |
|
Total cost |
$6,496.2M |
$6,562.1M |
$5,179.6M |
$5,245.4M |
|
Incremental cost of performance |
+65.9M |
|
+$65.8M |
|
|
Percent change in total cost |
|
|
-21% |
|
|
Recruiting cost |
$395.6M |
$398.4M |
$336.4M |
$338.4M |
|
Percent change in recruiting cost |
|
|
-15% |
|
This cohort will represent about 67,200 accessions and provide 195,000 staff-years of service. The total cost of this reduced accession cohort is estimated to be about $5,179.6 million. This is about 21 percent lower than the fiscal 1990 cohort. If we were to increase the performance level by the same increment (approximately 1 percent) as in the case of the fiscal 1990 cohort, the total cost, including recruiting, training, and compensation costs, would rise to about $5,245.5 million. The incremental cost of additional performance at the lower level of total performance is about the same, at $65.8 million. Hence, the model indicates that, to a first approximation, the incremental price of what can be interpreted as a measure of personnel readiness in the first-term force is not likely to become significantly less costly with downsizing.
Importantly, however, although the model indicates that total costs fall approximately in proportion to the overall change in the performance level of the first-term force in the Army, optimal recruiting budgets fall less than proportionately, according to the model's prescriptions. In moving from the level of performance implied by the fiscal 1990 Army recruiting cohort to a level of performance that is approximately 20 percent less, the recruiting budget declines from $395.6 million to $338.4 million, a decline of only 15 percent. This is because, as we have illustrated elsewhere, the effect of downsizing is to reduce the relative cost of achieving performance goals through high-quality recruits.7
THE MODEL AS A PROGRAM DEVELOPMENT AND EVALUATION TOOL
Evaluation of a Recruiting Program
The model may help provide answers to four general questions raised by a Service's accession plan. The first question concerns feasibility . Is it likely that the program can be achieved with the resources programmed? Is the budget too low or too high, given the recruiting goals? The second question concerns the program's efficiency. Here, there are two aspects of efficiency: (a) Do the recruiting resources programmed represent the most efficient combination of recruiting resources (recruiters, bonuses, advertising, and education incentives) to achieve programmed recruit quality goals? and (b) Is the programmed recruit quality mix the most efficient way to achieve the performance goals for the accession cohort over the first term of service? The third question is robustness. What are the consequences of changes in the economic environment or of cuts in recruiting resources? And fourth, the model may provide assistance in answering, perhaps, the
TABLE 4 Hypothetical Army Accession Program, Fiscal 199Y
|
|
Accessions |
High-Quality Recruits |
High School Graduates |
Staff-Years |
Recruiting Costs |
Total Costs |
|
Fiscal 199Y program |
67,522 |
62.2% |
95.3% |
194,571 |
$401.2M |
$5,234.1M |
most difficult question of all: Has the right level of first-term performance been programmed? How much more (less) costly are increases (decreases) in performance goals, and should they be changed?
Feasibility
Consider the following hypothetical accession program submitted by the Army for fiscal 199Y (Table 4).
Can this program be executed with the recruiting resources programmed? The economic assumptions for the recruiting market in fiscal 199Y are that the unemployment rate will be about 6.5 percent and the ratio of military starting pay to wages in the civilian youth labor market will be about 0.89. Given these assumptions, the recruiting cost function component of the model indicates that a recruiting budget of about $383.6 million will be necessary if the Army is to achieve a 62.2 percent high-quality mix for 67,522 accessions in the projected fiscal 199Y recruiting market. The recruiting cost function estimates the minimum cost of achieving a given accession plan, assuming an efficient use of recruiting resources. Moreover, it is a rough check on feasibility. That the Army budget request of $401.2 million is within 5 percent of the budget prescribed by the model suggests that there is not an important program execution issue. The model suggests that the Army has programmed about the right level of resources for its plan.
Efficiency
The recruiting resources programmed by the Army for fiscal 199Y are shown in Table 5. The only major difference between the recruiting resource mix programmed by the Army and the mix prescribed by the recruiting cost function is that the Army appears to have programmed too much advertising and too few recruiters. Costs can be reduced by cutting advertising by about $7 million and adding about 200 recruiters. Enlistment
TABLE 5 Mix of Recruiting Resources
|
|
Recruiters |
Advertising |
Enlistment Bonus (average) |
Education Benefits (average) |
|
Army program |
3,522 |
$24.6M |
$300 |
$200 |
|
Recruiting cost function |
3,722 |
$15.6M |
$443 |
$190 |
bonuses could also be raised, but an increase is not likely to be approved by Congress.
From the model, we can calculate the optimal recruit quality mix necessary to achieve the level of performance expected from the accession cohort programmed by the Army. This optimal mix is the one that achieves the same expected performance goal as the Army has programmed, but at the minimum recruiting, training, and compensation cost. In Table 6 , the two programs are compared.
According to the model, the overall recruit quality mix that the Army has programmed is about right. However, the model's solution suggests that the same level of expected performance over the first term of service can be obtained from an accession cohort that is approximately 525 accessions less and about $60 million less in recruiting costs. The reason the model is apparently able to do as much with less is that it distributes high-quality recruits among the various occupational categories much differently than does the Army program. However, the model's allocation is based purely on classification efficiency criteria—it does not take into account the preferences of recruits, for example—and considers only measured performance and cost differences in the allocation. Moreover, it reduces the total number of accessions. Without additional constraints, for example, the model does not recognize that a minimal proportion of higher-quality re
TABLE 6 Comparison of Fiscal 199Y Program to the Model Optimum
|
|
Accessions |
High-Quality Recruits |
High School Graduates |
Staff-Years |
Recruiting Costs |
Total Costs |
|
Fiscal 199Y program |
67,522 |
62.2% |
95.3% |
194,571 |
$401.2M |
$5,234.1M |
|
Model optimum |
66,987 |
61.5% |
99.1% |
194,265 |
$338.2M |
$5,173.2M |
cruits might be necessary in some occupations simply to provide leadership, and that individuals are necessary to fill specific positions.
Robustness
How sensitive is the recruiting program to the underlying assumptions? The recruiting cost function portion of the model can be used to analyze the effect of changes in the economic environment on required recruiting budgets. For example, the recruiting budget is based on the assumption that the civilian unemployment rate in fiscal 199Y will be about 6.5 percent and the ratio of military pay to the pay of civilian youth will remain at about 0.89. If, instead, the economy were to grow at a faster rate and the civilian unemployment rate were to decline to 6 percent, approximately $20 million more in recruiting dollars would be required to execute the program. If, in addition, first-term pay were frozen for the next year while the nominal wages of civilian youth were to increase by about 4 percent, the relative military pay ratio would decline to about 0.86. These two factors together would mean that an additional $32 million dollars would be necessary to execute the program, compared with the recruiting market conditions that are assumed in the program. Note, also, that with changes in the recruiting environment, the optimal recruiting program would itself change. This also could be analyzed by the model.
Level of Performance
How much more would an across-the-board 1 percentage point increase in aggregate first-term performance cost, relative to that underlying the program? How much would be saved by a 1 percent reduction? The model was used to estimate these trade-offs, with the performance level implied by the Army fiscal 199Y program as a baseline.8 (Note that in this analysis, the model is run unconstrained so that accessions and staff-years are permitted to vary. If both are held constant when the performance goals vary, the trade-offs become harsher, because all the change in performance must be accomplished through changes in the recruit quality mix.) The cost/performance trade-off around the hypothetical Army fiscal 199Y program is
TABLE 7 Cost-Performance Trade-off Around the Army, Fiscal 199Y Program
|
Performance Level |
Accessions |
High-Quality Recruits |
Recruiting Cost |
Total Cost |
Change Relative to Program |
|
Program |
67,002 |
62.6% |
$342.1M |
$5,178.5M |
— |
|
+1% |
67,854 |
62.4% |
$347.0M |
$5,244.5M |
+$66M |
|
-1% |
66,105 |
63.5% |
$339.3M |
$5,112.5M |
-$66M |
shown in Table 7. The table illustrates that the incremental cost of a percentage change in performance, around the hypothetical fiscal 199Y Army program, is about $66 million. The change in recruiting costs is relatively small, in this case because the model was permitted to change accessions and staff-years, as well as recruit quality, to meet the changes in the performance goal. The changes in the recruiting budget would have been much larger if accessions and/or staff-years were held constant in the analysis.
Developing the Service's Accession Programs
The model can be a potentially useful tool in developing an accession program, as well as evaluating a program. We illustrate its use as a development tool using a hypothetical Navy accession program.
Setting Recruit Quality Goals and Resources
In building the Navy accession program for fiscal 199Z, the initial guidance is that the overall level of first-term performance should be about that of the actual fiscal 1990 accession cohort, except that it should be about 20 percent smaller. Starting with the expected first-term performance implied by the fiscal 1990 program but reduced by 20 percent, the model is exercised to achieve the following program for fiscal 199Z (Table 8).
The model is run unconstrained (case 1) to produce the recruiting program shown in the table. This unconstrained case, according to the model, is the minimum cost program that produces a level of expected performance over the first term of service that is about 20 percent less, across occupation, than the actual fiscal 1990 program. It assumes that the fiscal 199Z recruiting environment will include an unemployment rate of 6.5 percent and that the ratio of Navy starting pay to civilian youth wages will be 0.89. With 90 percent high school graduates and almost 61 percent high-quality recruits, this appears to be a solid first start.
TABLE 8 Hypothetical Navy Fiscal 199Z Accession Plan
|
|
Accessions |
High-Quality Recruits |
High School Graduates |
Expected Performance/ Staff-Year |
Recruiting Cost |
Total Cost |
|
Case 1 |
55,753 |
60.7% |
90% |
60.7% |
$240.4M |
$4,554.0M |
TABLE 9 Adding an Accession Constraint
|
|
Accessions |
High-Quality Recruits |
High School Graduates |
Expected Performance/Staff-Year |
Recruiting Cost |
Total Cost |
|
Case 1 |
55,753 |
60.7% |
90% |
60.7% |
$240.4M |
$4,554.0M |
|
Case 2 |
56,000 |
59.1% |
89% |
60.6% |
$237.7M |
$4,554.3M |
The Navy strength planner notes, however, that in her opinion there are too few accessions. At least 56,000 accessions are required to meet strength goals, according to the Navy's Force Analysis Simulation Technique model—the personnel inventory model used by the strength planners. The model is rerun, this time imposing the constraint that accessions equal 56,000. The results are shown in Table 9.
Compared with the unconstrained case, the second case results in slightly lower quality and a slightly higher total cost. However, the differences are small and recruiting costs are actually lower in case 2.9 As a result, it is decided that the plan shown as case 2 will be brought to the Admiral for approval.
Adjusting for Specific Occupational Groups
Upon briefing the Admiral, it is discovered that a planning error was made. Although most occupations will decline by 20 percent relative to the fiscal 1990 accession level, the need for nuclear power skills will decline by 30 percent, reflecting the retirement of a significant number of Los Angeles-class attack submarines and several ballistic missile submarines.10 Most
TABLE 10 Fewer Nuclear-Trained Accessions
|
|
Accessions |
High-Quality Recruits |
High School Graduates |
Expected Performance/ Staff-Year |
Recruiting Cost |
Total Cost |
|
Case 1 |
55,753 |
60.7% |
90% |
60.7% |
$240.4M |
$4,554.0M |
|
Case 2 |
56,000 |
59.1% |
89% |
60.6% |
$237.7M |
$4,554.3M |
|
Case 3 |
55,163 |
61.3% |
89.8% |
61.5% |
$238.3M |
$4,502M |
of the nuclear-trained petty officers are in the electronics repair DoD occupational group. The solution, therefore, is to adjust the performance goals in this occupational group downward by 30, instead of 20 percent. The strength planner's accession goals also did not consider this additional reduction. Case 3 is a rerun reflecting this change—it does not include an explicit accession constraint (Table 10).
Case 3 comes out well. Recruit quality, as a percentage, is higher, and expected performance per staff-year increases to 61.5 percent. The recruiting budget goes up, slightly, even though total accessions and required performance go down, because high-quality recruits become somewhat less costly at the slightly lower level of accessions. Total costs of case 3 are less than in those for cases 1 and 2.
Sensitivity to Recruiting Market Conditions
Upon review of the accession plan, analysts from the Chief of Naval Recruiting Command suggest that the recruiting market assumptions may be too optimistic from the viewpoint of recruiting. They note that a pay cap is planned and that the economy's growth rate is picking up. To test the
TABLE 11 Sensitivity to Recruiting Market Assumptions
|
|
Accessions |
High-Quality Recruits |
High School Graduates |
Expected Performance/ Staff-Year |
Recruiting Cost |
Total Cost |
|
Case I |
55,753 |
60.7% |
90% |
60.7% |
$240.4M |
$4,554.0M |
|
Case 2 |
56,000 |
59.1% |
89% |
60.6% |
$237.7M |
$4,554.3M |
|
Case 3 |
55,163 |
61.3% |
89.8% |
61.5% |
$238.3M |
$4,502M |
|
Case 4 |
55,375 |
58.2% |
89.9% |
61.3% |
238.8M |
$4,510.9M |
sensitivity of the plan to market assumptions, the plan is rerun assuming that the unemployment rate falls to 6 percent in fiscal 199Z and that the ratio of Navy starting pay to the youth wage falls to 0.86. The results are shown in the Table 11 as case 4.
According to the model, the optimal adjustment to a tighter recruiting market includes reducing the high-quality goal somewhat, with only a modest increase in recruiting costs. Hence, although not desirable, it appears that a tighter recruiting market, as defined by this scenario, would not have disastrous consequences for the accession plan.
SETTING ENLISTMENT STANDARDS: ANALYSIS OF OCCUPATION-LEVEL ENLISTMENT STANDARDS
Thus far, the applications of the model have focused primarily on higher-level program decisions—the overall recruit quality mix, recruiting resources, the nature of the trade-off between budgets and performance, and the effects of the environment on these quantities. In these areas, the model is potentially helpful in formulating recruit quality goals and the resources necessary to achieve those goals, and in understanding the linkages between recruit quality goals and measures of job performance. Underlying the formulation of overall recruit quality goals, however, are enlistment standards by occupation category or group. In this section, we explore potential uses of the model in helping to understand the implications of occupation-level enlistment standards and changes in those standards and, perhaps, in providing insights concerning setting and evaluating alternative enlistment standards at the occupation level.
Minimum standards for entry into particular jobs or occupational categories are established by the Services on the basis of selected composites or combinations of the 10 subtests of the ASVAB. The subtests selected to form a composite score for a particular job or occupational category concern measurement of those abilities that are considered to be the most relevant for predicting training success and future performance in that occupation. Typically, a composite will consist of a linear combination of 2 to 5 of the 10 ASVAB subtests. Table 12 shows the combinations of subtests used by the Services.
For each military occupation or groups of occupations, the Services set a cutoff score for the relevant composite. To enter that occupation or occupational group, recruits must have achieved at least the minimum score on the relevant composite.11
TABLE 12 Service Aptitude Composites, Fiscal 1990
|
ASVAB Subtests |
Army Composites |
Navy Composites |
Marine Corps |
Air Force |
|
Mechanical Comprehension (MC) |
|
General Technical |
General Technical |
General (AR + WK+ PC) |
|
Arithmetic Reasoning (AR) |
Electrical (GS+ AR + MK + EI) |
Electrical |
Electrical |
Electrical |
|
Numerical Operations (NO) |
Clerical (PC + WK + AR + MK) |
Clerical |
Clerical |
Administrative (NO + CS + WK + PC) |
|
Math Knowledge MK) |
Mech/Maint (NO + AS + MC + EI) |
Mechanical (AS + MC + WK + PC) |
Mech/Maint (AR + AS + MC + EI) |
Mechanical (GS + 2AS + MC) |
|
General Science (GS) |
Combat (AR + CS + AS + MC) |
Basic Electronics (GS + AR + 2MK) |
|
|
|
Paragraph Comprehension (PC) |
Field Artillery (AR + CS + MK + MC) |
Engine/Boiler/Machine (AS + MK) |
|
|
|
Auto/Shop (AS) |
Operations/Food (NO + AS + MC + WK + PC) |
Mechanical Repair (AR + AS + MC) |
|
|
|
Electronics Information (EI) |
Surveillance/ Communications (AR + AS + MC + PC + WK) |
Submarine (AR + MC + PC + WK) |
|
|
|
Word Knowledge (WK) |
Skilled Technical (GS + MK + MC + PC + WK) |
Communications Technician (AR + NO + CS + WK + PC) |
|
|
|
Coding Speed (CS) |
General Maintenance (GS + MK + EI + AS) |
Hospital (GS + MK + PC + WK) |
|
|
The model does not include the 10 ASVAB subtests, or the composites built from those subtests, as variables or dimensions in the model. How-
ever, constraints can be set in the model on the minimum proportion of high-quality recruits in each of the occupational groups, but a floor on the minimum AFQT score in the occupational group cannot be directly imposed. Ostensibly, then, it would be difficult to use the model to analyze occupation-specific, minimum composite scores or enlistment standards. However, the model does use the AFQT as the overall measure of aptitude and recruit quality and the AFQT is itself a composite score consisting of the mathematical and verbal subtests: paragraph comprehension (PC), word knowledge (WK), arithmetic reasoning (AR), and mathematics knowledge (MK). Moreover, the individual subtest scores on the ASVAB are positively correlated, some of them highly so. Hence, in general, for a given composite, the higher the cutoff score, the higher the average quality of recruits entering that occupation, as measured by the AFQT.
We are able to analyze the effect of job-specific enlistment standards, defined by minimum cutoff scores on relevant composites, by approximating the effect that the cutoff scores would have on the minimum proportion of high-quality recruits entering that occupational group. We do this by establishing two links: a link between applicant's composite scores and the applicant's AFQT score and a link between the AFQT-equivalent minimum cutoff score of an occupation and the minimum proportion of high-quality recruits in that occupation. The first relationship is based on a strong correlation, in most cases, between an applicant's AFQT score (which itself is the linear combination of four ASVAB subtests) and composite scores. We can predict, with a reasonable degree of accuracy, the AFQT-equivalent of the various composite scores. The second is based on a statistical relationship between the AFQT-equivalent minimum score and the observed proportion of high-quality recruits in that occupation. Hence, we set enlistment standards in terms of a minimum percentage of high-quality recruits that, in turn, is statistically related to the underlying composite scores.
It is the relationship between the composite cutoff score and an estimate of overall high-quality recruits, as measured by the AFQT, that we wish to explore using the model. To do this, we use the overall correlation between AFQT and the various composite scores to construct an AFQT-equivalent of each composite score. We then use the observed relationship between the AFQT-equivalent cutoff score for the occupational category and the proportion of high-quality recruits in the occupation to analyze enlistment standards and the implications of changing those standards. Recognizing throughout that the relationship between underlying occupational enlistment standards, as measured by cutoff scores on the composites, and the proportion of high-quality recruits in the occupational category is less than perfectly precise, the types of analyses that can be conducted using the model include:
-
Comparisons of the proportion of high-quality recruits in each occupational category prescribed by the model to the proportion that occurs under current enlistment standards, under otherwise similar conditions;
-
The implications for overall recruit quality goals and for the costs of imposing a minimum proportion of high-quality recruits implied by current enlistment standards; and
-
The implication for overall recruit quality goals and for the costs of raising (or lowering) enlistment standards in one or more occupational categories.
We describe below how the model can be used to provide insights into the implications of occupation-specific enlistment standards. In particular, we can compare the costs of an unconstrained solution—one with no occupation-specific minimum standards—to a solution in which the equivalent of the current, occupation-specific enlistment standards are imposed, the costs associated with raising (or lowering) one or more cutoff scores, and the likely distribution effects of inefficiently high standards (according to the model) in some occupational groups.
The Empirical Linkages: Linking Occupational Enlistment Standards to High Quality12
Two types of equations will connect occupation-level enlistment standards, as measured by composite cutoff scores, to the proportion of high-quality recruits in an occupational category. These are a set of equations relating AFQT to composite scores and an equation relating the proportion of high-quality recruits (% HQ) in an occupation to the cutoff score:
and
The first equation is estimated using data from individual applicants and is a regression of an individual i's AFQT score on that individual's score on composite j. The second equation, estimated at a more aggregate level, establishes the relationship between the cutoff score in an occupational category as its predicted AFQT-equivalent and the percentage of high-quality recruits (AFQT Category I–IIIA high school graduates) in the occupa-
TABLE 13 Regression of AFQT Scores on Composites with Goodness of Fit As Measured by R2
|
Army |
|
Navy |
|
Marine Corps |
|
Air Force |
|
|
Composite |
R2 |
Composite |
R2 |
Composite |
R2 |
Composite |
R2 |
|
General technical. |
94 |
General technical |
.94 |
General technical |
.88 |
General technical |
.97 |
|
Electrical |
.89 |
Electrical |
.89 |
Electrical |
.89 |
Electrical |
.90 |
|
Clerical |
.98 |
Clerical |
.65 |
Clerical |
.85 |
Administrative |
.66 |
|
Mech/maint |
.61 |
Mechanical |
.65 |
.Mechanical |
.65 |
Mechanical |
.49 |
|
Combat |
.72 |
Basic electronics |
.93 |
|
|
|
|
|
Field artillery |
.86 |
BT/EN/MM |
.72 |
|
|
|
|
|
Operations/food |
.72 |
Mech rep. |
.65 |
|
|
|
|
|
Surveill/comm |
.77 |
Submarine |
.88 |
|
|
|
|
|
General maint |
.74 |
Comm. tech. |
.80 |
|
|
|
|
|
Skilled tech. |
.89 |
Hospital |
.92 |
|
|
|
|
tional category. The AFQT cutoff score is obtained by using the first equation to translate the composite score minimum to an AFQT score.
In general, the relation between AFQT and composite score is quite strong, as measured by R2, for most composites, as illustrated in Table 13.
Occupations in the model are aggregated into nine groups corresponding to one-digit DoD occupation codes. Using the relationship estimated between composite scores and AFQT, we compute the AFQT-equivalent of the minimum cutoff score for each DoD occupation code. This is done by computing the weighted average of the AFQT-equivalent cutoff score for the Service occupations within a DoD occupation category, in which the weights are the proportions of recruits entering that occupation in fiscal 1990. Table 14 shows the AFQT-equivalent minimum score required for each DoD occupation category using this method.
Finally, occupation-level quality constraints in the model (the equivalent of minimum enlistment standards) are not in terms of AFQT scores, but rather are in the form of the proportion of high-quality recruits—the proportion of AFQT Category I–IIIA high school graduates. Moreover, one of the important outcomes of enlistment standards by occupational group is the proportion of high-quality recruits that enters that occupational category, partly as a result of the standard. For this reason, we developed an equation predicting the proportion of high-quality recruits that enter an occupation as a function of the AFQT-equivalent cutoff score.
A regression equation describing the relationship between the weighted-average AFQT minimum cutoff score in an occupation and the proportion of high-quality recruits in that occupation is estimated by using the actual
TABLE 14 AFQT-Equivalent Average Enlistment Standards by DoD Occupation Code Average Implied AFQT Cutoff Scores
|
DoD Occupation Code |
Army |
Navy |
Marine Corps |
Air Force |
|
(0) Infantry, gun crews |
32.13 |
39.08 |
29.32 |
32.13 |
|
(1) Electronic equip, rep. |
55.29 |
62.96 |
67.23 |
63.3 |
|
(2) Comm/intel |
43.45 |
51.97 |
45.45 |
49.88 |
|
(3) Medical/dental |
44.87 |
44.22 |
— |
45.22 |
|
(4) Other technical |
45.56 |
55.51 |
48.01 |
46.64 |
|
(5) Functional support/admin. |
43.18 |
61.13 |
54.06 |
45.78 |
|
(6) Elect/mech. repairers |
46.48 |
45.22 |
45.88 |
44.65 |
|
(7) Craftsmen |
38.60 |
50.14 |
38.23 |
37.89 |
|
(8) Service/supply handlers |
40.71 |
38.78 |
31.84 |
35.36 |
TABLE 15 Proportion of High-Quality Recruits as a Function of AFQT-Equivalent Enlistment Standards
|
Service |
Intercept |
AFQT Cutoff Score Coefficient |
R2 |
|
Army |
12.7 |
1.18 |
.49 |
|
Navy |
-19.9 |
1.51 |
.57 |
|
Marine Corps |
19.4 |
1.11 |
.78 |
proportion of high-quality recruits by occupational category in fiscal 1990. For three of the Services, the proportion of high-quality recruits is regressed on the estimated AFQT-equivalent cutoff score for fiscal 1990.13 The results are shown in Table 15. Interpreted literally, these equations imply that a one-unit increase in the average enlistment standard of an occupational category, as measured by the AFQT-equivalent, is associated with a 1.18 percentage point increase in the proportion of high-quality recruits assigned to that category in the Army, a 1.51 percentage point increase in the Navy, and a 1.11 percentage point increase in the Marine Corps. Using these equations, we can estimate the percentage of high-quality recruits implied by the AFQT cutoff scores in effect in fiscal 1990 and compare this per
TABLE 16 Percentage of High Quality by Occupational Category, Fiscal 1990
|
|
Army |
|
Navy |
|
Marine Corps |
|
|
Occupation Code |
Actual |
Predicted |
Actual |
Predicted |
Actual |
Predicted |
|
0 |
56.8 |
50.6 |
45.2 |
39.1 |
50.0 |
51.9 |
|
1 |
81.8 |
77.9 |
78.4 |
75.1 |
90.9 |
94.0 |
|
2 |
72.7 |
63.9 |
63.8 |
58.5 |
62.5 |
69.8 |
|
3 |
78.5 |
65.6 |
58.8 |
46.8 |
|
— |
|
4 |
61.1 |
66.4 |
76.5 |
63.9 |
87.1 |
72.6 |
|
5 |
63.5 |
63.6 |
59.8 |
72.4 |
76.9 |
79.4 |
|
6 |
56.7 |
67.5 |
53.5 |
48.3 |
68.9 |
70.3 |
|
7 |
53.1 |
58.2 |
39.7 |
55.8 |
68.6 |
61.8 |
|
8 |
52.6 |
60.7 |
22.6 |
38.6 |
49.6 |
54.7 |
centage to the actual percentage of high-quality recruits in that category. This comparison is shown in Table 16.
Applying the Cost/Performance Trade-off Model to Enlistment Standards
It should be emphasized that the model was not specifically designed for the micro analysis of occupation-specific enlistment standards, but for more programmatic issues involving aggregate recruit quality goals and recruiting resources. Hence, we recommend that the particular applications of the model that follow be considered experimental in nature, with a goal of examining the potential of the model in this direction and, if promising, the modifications that would be necessary to realize this potential.
The performance goals and performance equations in the model do not capture all of the factors that influence readiness and job performance. Enlistment standards, represented by externally imposed, minimum cutoff scores for entry into an occupation, may capture factors affecting performance and readiness that are not included in the model. But there does not literally exist a composite cutoff score such that all those who score below that score will be unsuccessful, while all those above that score will be successful. Instead, the trade-offs are between probabilities of success or higher levels of performance and higher recruiting costs associated with more restrictive entry standards. In principle, enlistment standards by occupation should be determined by weighing the expected costs and the anticipated benefits. The model can highlight some of the cost implications of enlistment standards and changes in those standards and possibly help managers improve the way in which standards are set and revised.
Effect of Current Enlistment Standards on Recruit Quality and Cost
In this example, we compare an optimal fiscal 1990 Army accession plan when there are no explicit enlistment standards by occupation—the unconstrained case—with the same scenario when actual enlistment standards are approximated by the implied minimum proportion of high-quality recruits shown in the ''Predicted" column for the Army in Table 16. These proportions are an estimate of the effect of the fiscal 1990 minimum composite scores, discussed above, translated into minimums in terms of high quality.
First, the model is run without placing any constraints on the proportion of high-quality recruits within the occupational categories. This is equivalent to having no explicit enlistment standard except that implied by the cost-minimizing solution. Next, accessions are constrained to the actual fiscal 1990 level of 84,400 for the Army. Both the performance goals and the accession goals are held constant in the analysis. The average expected performance per staff-year in fiscal 1990 was 56 percent. First-term staff-years, however, are unconstrained. In the unconstrained case, there are no minimum high-quality percentages set by occupational group.
The alternative case imposes the fiscal 1990 enlistment standards on each occupational category. The case is precisely the same as the unconstrained case except that constraints on the minimum proportion of high-quality recruits that enter each of nine occupation groups are set to equal the percentages in the "Predicted" column from Table 16 for the Army. These minimums are the implied representation of minimum composite scores in the model. A comparison of the two cases is shown in Table 17.
The results indicate that the imposition of this approximation to enlistment standards raises the proportion of high-quality recruits accessed by about 10 percentage points, from 50.9 percent in the unconstrained optimum to 60.7 percent in the enlistment standards case. The unconstrained case also suggests that higher-quality is warranted in combat arms (infantry, gun crews, and seamanship), electronic equipment repairers, and communication and intelligence, compared with the allocation in the enlistment standards case, with lower portions of quality recruits allocated to the other occupational groups. One might presume that if it were optimal to have a high-quality proportion that exceeds the minimum enlistment standard, the allocation would be made. This is not necessarily the case, as the results indicate. The required quality allocation due to the enlistment standards in some occupations raises the marginal cost of high-quality recruits to all other occupations. Hence, while the unconstrained case suggests that 74 percent high-quality recruits is optimal for combat arms, when minimums are imposed in other occupations, the optimal, given the allocation to other
TABLE 17 Effect of Enlistment Standards on Recruit Quality and Cost: Army Example
|
Occupations |
Unconstrained Case |
Fiscal 1990 Enlistment Standards |
|
Percentage High-Quality Recruits |
|
|
|
Infantry, gun crew, seamanship |
74.0 |
50.6 |
|
Electronic equipment repair |
100 |
77.9 |
|
Communications, intelligence |
100 |
64.0 |
|
Health care |
0 |
65.6 |
|
Other technical |
60.4 |
66.5 |
|
Support and administration |
22.6 |
63.6 |
|
Mechanical equipment repair |
0 |
67.5 |
|
Craftsmen |
0 |
58.2 |
|
Service and supply handlers |
20.1 |
58.2 |
|
All |
50.9 |
60.7 |
|
Costs |
|
|
|
Recruiting |
$ 482.2M |
$ 578.3M |
|
Training |
1,532.9M |
1,534.7M |
|
Total |
6,573.0M |
6,645.8M |
Occupations, falls to 50.6 percent, which is just sufficient to satisfy the minimum.
Reducing Enlistment Standards
What are the effects of reducing the AFQT-equivalent, minimum enlistment standard by, say, 10 AFQT percentile points? Using the statistical relationship between AFQT-equivalent enlistment standards and the proportion of high-quality recruits in an occupation, we can solve for the new, lower enlistment standards implied by the reduction. These lower standards are entered into the model to establish a third case. The results of running this case are shown in Table 18, which includes the previous two cases for comparison. With the reduction in enlistment standards there is a concomitant reduction in costs and the proportion of high-quality recruits accessed. Recruiting costs fall by about $72 million, compared with the case in which the original standards are imposed, and the proportion of high-quality recruits falls by about 7 percentage points. Interestingly, the proportion of high-quality recruits in the occupations in which the unconstrained case suggests high quality is most efficient—electronic repair and communications and intelligence—rises. This occurs because the marginal cost of high-quality recruits to those occupations is reduced as high-quality recruits
TABLE 18 Reduction in Enlistment Standards
|
Occupation |
Unconstrained Case |
Fiscal 1990 Enlistment Standards |
10 AFQT-Equivalent Point Reduction in Fiscal 1990 Enlistment Standards |
|
Percentage High-Quality Recruits |
|
|
|
|
Infantry, gun crew, seamanship |
74.0% |
50.6% |
38.8% |
|
Electronic equipment repair |
100% |
77.9% |
100.0% |
|
Communications, intelligence |
100% |
64.0% |
71.7% |
|
Health care |
0% |
65.6% |
53.8% |
|
Other technical |
60.4% |
66.5% |
58.6% |
|
Support and administration |
22.6% |
63.6% |
51.8% |
|
Mechanical equipment repair |
0% |
67.5% |
55.7% |
|
Craftsmen |
0% |
58.2% |
46.4% |
|
Service and supply handlers |
20.1% |
58.2% |
48.9% |
|
All |
50.9% |
60.7% |
53.1% |
|
Costs |
|
|
|
|
Recruiting |
$482.2M |
$578.3M |
$501.9M |
|
Training |
$1,532.9M |
$1,534.7M |
$1,533.5M |
|
Total |
$6,573.0M |
$6,645.8M |
$6,591.1M |
are released from occupations in which enlistment standards are inefficiently high, according to the model. An implication of these results is that inefficiently high enlistment standards in one or more occupations raises the cost of high-quality recruits to other occupations, potentially reducing the proportion of high-quality recruits in those occupations below what would have been optimal in the unconstrained case.
SUMMARY
We have examined some potential applications of the Accession Quality Cost/Performance Trade-off Model from several different perspectives:
-
As a vehicle for explaining to Congress the rationale for an accession program and its relation to personnel readiness over the first term of service;
-
As a tool for evaluating a program;
-
As a model for developing an accession program; and
-
As an aid in setting enlistment standards.
Its actual contribution to the defense community in any of these areas de-
pends on the willingness of analysts and researchers to work with the model. The purpose of this paper is to suggest, by examples, that the effort may be worth the cost. We believe that the model, as it currently exists, provides an excellent logical framework for analyzing recruiting and first-term performance issues, perhaps providing new insight. Most important, the model may be helpful in articulating the reasons for programmatic choices regarding recruiting goals, resources, and first-term performance.
The model clearly can be improved, particularly by refining some of the underlying empirical relationships. Continued use of the model, however, is a necessary condition for improvement. Only through its use will its strengths and weaknesses be shown and its value be demonstrated.
REFERENCES
Human Resources Research Organization, Systems Research and Applications Corporation, and Lewin/VHI, Inc. 1993 Accession Quality Cost-Performance Tradeoff Model (CPTM) Guidebook. Prepared for the Office of Accession Policy, Assistant Secretary of Defense, Force Management and Personnel.
Lockman, Robert F. 1978 A Model for Estimating Premature Losses. In R.V.L. Cooper, ed., Defense Manpower Policy: Presentations from the 1976 Rand Conference on Defense Manpower. R-2396-ARPA. Santa Monica, Calif.: The Rand Corporation.
McCloy, R.A. Harris, D.A., Barnes, J., Hogan, P.F., Smith, D.A. Clifton, D., and Sola, M. 1992 Accession Quality, Job Performance, and Cost: A Cost/Performance Trade-off Model" Report No. FR-PRD-92-11. Alexandria, Va.: Human Resources Research Organization.


