
APPENDIX
E
A Risk Analysis Approach
The risk analysis approach outlined in Chapter 3 is designed to assess the current risks of marine pipeline operations and the risk reduction benefits of different kinds of safety measures. It is, therefore, structured to account explicitly for the variables that could be affected by certain improvements, technical and managerial. The approach is a prototype model, with a generalized architecture. It can be expanded further if needed. For example, the model is based mainly on means of random variables; in actual studies the whole distributions may be relevant. Some of the input variables can be obtained by more detailed models involving, for instance, computations of loads and capacities. Some of the failure modes (e.g., at the interface between risers and platforms) will require full probabilistic risk analyses (PRAs) that are only outlined here. This prototype model, however, can be implemented. It may be sufficient in some cases and can provide a basis for initial sensitivity analyses.
As outlined in Chapter 3, this model is based on a zonation of the considered area by superposition of three maps (water depth, vessel traffic density, and pipeline density). Other types of zones may be introduced following the same pattern, to account, for instance, for geological properties of the seafloor. Five types of initiating evens are considered here: collisions between vessels and pipelines, dropped objects and dragged anchors, corrosion, effects of storms and hurricanes, and incidents at the interface between platforms and risers.
The input data of the model presented below are of three kinds: direct results of statistical data base analyses (after “de-biasing” if needed to account for the possible underreporting of certain types of incidents in the past); results of other models that need to be developed separately; and expert opinions to fill information gaps when the necessary data are unavailable at decision time, unobtainable by observable statistics (e.g., densities of uncharted pipelines), or possibly obtainable from complex models but at a greater cost than justified by their information value. For example, direct data provide frequencies of observed and reported collisions between vessels and pipelines. Physical and probabilistic models can be developed to assess the occurrence and progression of corrosion on poorly maintained pipes. Expert opinions will be needed to evaluate the average vessel traffic density or the average size of the crews in specified zones.
STRUCTURE OF THE RISK ANALYSIS MODEL (ZONATION)
The risk analysis model for the area of interest (in this example, mainly off the coasts of Louisiana and Texas) is based on a zonation of the region along the three parameters mentioned above: water depth, vessel traffic density, and pipeline density. Each parameter is divided into a few discrete ranges. The geographic area is then partitioned into minimal zones (“min-zones”), each characterized by the local values of the three parameters. 1 The structure of the risk analysis model includes (a) initiating events (e.g., a vessel-pipeline collision) and their annual probabilities, (b) intermediate developments and their probabilities conditional on the initiating event (e.g., the probability of fire given a vessel-pipeline collision), and (c) the consequences (generally expressed as means or mean rates) of each accident sequence.
The risk for each rain-zone is then characterized by:
-
The annual probability of at least one death in the min-zone, and the corresponding maximum individual risk (the annual probability of death in a pipeline-related accident for the most exposed individual)
-
The mean of the amount spilled per unit of surface and per year in the min-zone and the mean annual property damage to pipelines and vessels.
Zonation of the Region
The area of interest is divided into min-zones defined by the superposition of three different partitions:
-
Pipeline density. A map showing zones of known or assessed pipeline density (e.g., two or three zones) as well as offshore platforms and their input and output pipelines is needed (Figure E-1). Several other factors may be needed on this map, including the relative densities of old pipelines and new ones, of large pipelines and small ones, of live pipelines and inactive ones, and of buried pipelines and exposed ones. To a first approximation, it may be sufficient to assume uniform ratios of old to new and live to inactive pipelines, and a uniform distribution of pipe diameters. Obviously, such assumptions should be checked; for example, around new platforms, the density of pipelines is high, most pipelines are live, and those that are new are less likely to experience corrosion leaks.
-
Vessel traffic density. Also required is a map showing a few different zones of vessel traffic density, as well as the platforms and the density of vessel traffic around them. Fishing takes place wherever the water depth is sufficient. One can expect, however, to find greater traffic density near harbors or in the most favorable fishing areas. These areas include, for shrimp, the zones surrounding the platforms.
-
Water depth. Finally, a map showing different water depth contours is needed (e.g., 0-10 feet, 10-20 feet, 20-50 feet, more than 50 feet). The water depth can be compared with the drafts of different types of the vessels likely to circulate in the area. Also dependent on the water depth is the impact of the waves on bottom sediments and the effects of storms and hurricanes on submerged pipelines.
|
1 |
Several noncontiguous min-zones can have the same set of index values. They are treated here as separate re.in-zones to allow simple analysis of the effects of hurricanes and storms as described later. |
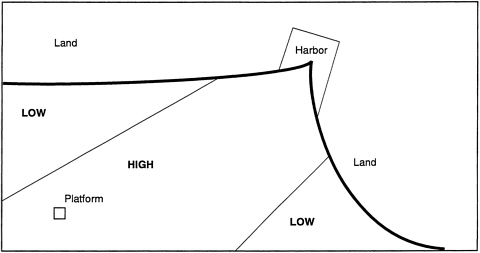
FIGURE E-1 Hypothetical map of pipeline density.
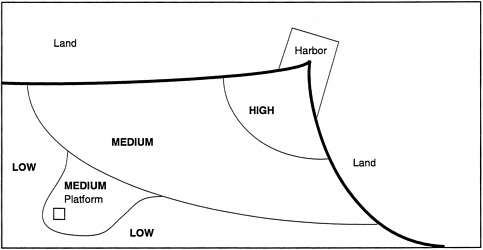
FIGURE E-2 Hypothetical map of vessel traffic density.
The superposition of the three maps in Figure E-1, Figure E-2 and Figure E-3 leads to the zonation shown in Figure E-4. This zonation is characterized by what are called here the corresponding “min-zones”, i.e., the minimal zones that result from the partitioning of the region. What is shown here is a hypothetical region. A harbor site was assumed because the vessel traffic is more likely to be high in its vicinity. The characterization of the zones (e.g., high, medium, low) is totally hypothetical and for illustrative purposes only.
Each min-zone (index i) is characterized by:
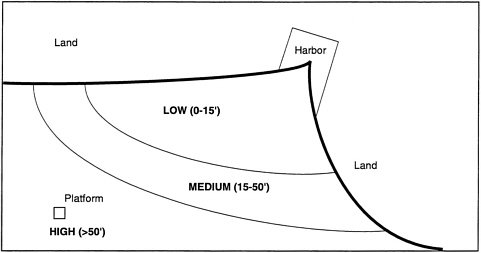
FIGURE E-3 Hypothetical map of water depth.
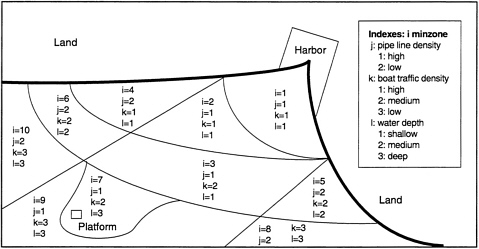
FIGURE E-4 Partition of a hypothetical area according to water depth, pipeline density, and vessel traffic density.
-
The surface area in square miles
-
The density of pipelines indexed by j (1, 2, or 3) and, possibly, specific distributions of pipe sizes, ratios of old to new and inactive to live pipelines, as well as the proportion of those carrying gas versus oil or condensate (unless these characteristics are considered geographically uniform)
-
The density of vessel traffic, indeed by k (1, 2, or 3) and possibly, the types of vessels if there are significant differences in drafts
-
The water depth indexed by l (1, 2, or 3)
-
The number of platforms.
Initiating Events
The five initiating events (denoted “IE”) are as follows:
-
For “offsite” pipelines (not in the immediate vicinity of platforms):
IEa: A vessel hits an exposed pipeline, a class of accidents that can lead to human casualties.
IEb: A vessel operator drops or drags an anchor or other object causing a breach in a pipeline
IEc: A pipeline leaks due to corrosion
IEd: A pipeline breaks and/or leaks due to damage caused by storms and hurricanes
-
For pipelines at platforms:
IEe: A pipeline fails at the interface with a platform due to excessive loads such as shocks or high internal pressures, and/or to reduced capacity due to a weakness of the equipment.
These five types of initiating events can be considered mutually exclusive. Their probabilities are defined for each min-zone as a function of water depth and the densities of vessels and pipelines. The risks associated with each failure mode can then be computed and summed over all accident types and all min-zones to assess the overall risk in the Gulf. In particular, one can compute independently the mean annual number of human casualties, and the mean annual volume of oil spilled due to leaks (which depends on the size of a hole in a live oil pipeline of specified diameter for a given spill duration).
Structure of the Risk Computation for Each Min-Zone
For each min-zone and for each initiating event, the risk is characterized by (a) the probability of at least one death per year in the min-zone (and the maximum individual risk), (b) the mean volume of oil spilled per year, and (c) the average annual property damage to vessels and pipelines. The structure of the model (data, dependencies and outputs) for each initiating event is outlined in the following sections.
Initiating Event a (IEa): Collision Between a Vessel and a Live Pipeline, Remote From Platforms
The main concern about vessels striking pipelines is the possibility of human casualties on board if the pipe transports gas. In this case, an explosion can follow, possibly causing heavy damage to the vessel and injuring or killing its occupants. If the pipe carries oil, the consequences for human life are much less severe: the vessel and the pipeline may suffer some damage and some oil may be spilled, but to the extent that the event is noticed and its location is known, the response time can be short and the amount of spillage generally small.
The annual probability of at least one casualty in min-zone i in any given year depends on (a) the probability distribution of the annual number of collisions between vessels and exposed live gas pipelines in min-zone i and (b) the conditional probability of at least one death given a collision between a vessel and a gas pipeline of diameter m (p m(D|C)). The annual probability of a vessel-pipeline collision depends on the densities of pipelines and of vessel traffic, on the water depth in min-zone i, and on the proportion of live, exposed pipelines. The term pm(D|C) depends on the probability that a pipeline of diameter m carries gas, on the mass of the vessel, and on its speed at the time of the collision.
The individual risk for the most exposed people on vessels depends on the average annual number of casualties in vessel-pipeline collisions in min-zone i, and on the number of people who incur most of the risk (the “most exposed” individuals), generally those on board fishing vessels that navigate in shallow waters.
The mean annual volume of oil spilled depends on the mean annual number of collisions, and on the average volume spilled in a collision between a vessel and a live oil pipeline (which for a given event depends, among other factors, on the size of the pipeline breach and on the response time to stop the flow).
Initiating Event b (IEb): Impact of Dropped or Dragged Anchors and Other Objects, Remote from Platforms
For this kind of incident, the main concern is the amount of oil spilled. If the pipeline carries gas, the ignition source is generally far removed from the site. The mean annual volume of oil spilled depends on the mean annual number of impacts of various objects (mostly anchors) on live, exposed pipelines transporting oil and the mean amount of oil spilled per event. 2The annual number of impacts depends on the density of vessel traffic, the density of live pipelines, and the proportion of pipelines that are exposed and transport oil in the different specified ranges of diameters. The mean amount of oil spilled per event depends, among other factors, on the probability that the impact of a dropped or dragged object causes a breach in the pipeline, the mean size of the breach, and the response time (spill duration).
The model can be simplified by assessing directly the mean amount of oil released conditional on object impact. The reason for making the equations more detailed is that some safety measures are meant to improve spill detection, thereby decreasing the spill duration and improving the response.
The mean annual financial loss due to pipeline damage can be computed by simply multiplying the mean annual number of incidents by the mean property damage per impact. (Note that only immediate damage is accounted for here; a pipe may break later due to a dent that did not cause immediate rupture.)
Initiating Event c (IEc): Corrosion of Pipelines Transporting Oil, Remote from Platforms
Oil leaks due to corrosion are generally much less serious than those due to dropped or dragged objects such as anchors. One important policy issue is the cumulative effects
|
2 |
An alternative here is to compute the annual probability of a large spill. |
of corrosion with the age of the pipelines. Also, when corrosion results in leakage, the leak dection time is critical to the amount of oil spilled. If the flow of the spill is too small to be noticeable by pipeline operators (through either electronic monitoring or visual surveillance), the spill can last for some time before measures are taken to stop it.
The mean annual volume spilled depends on the mean number of corrosion holes per year in min-zone i (allocated among buried and exposed pipelines), which itself depends (cumulatively) on the age of the pipelines and on the maintenance and management policies of the oil companies, the mean size of corrosion holes (which determines the mean spill rate, given the pressures in the pipes), and the mean duration of spills per event. The observation delay may depend on the distance to the shore (the closer, the more visible). The total amount of oil spilled per year is obtained by summing the amounts of oil spilled for all sizes of the breaches, pipe diameters, and spill durations.
The model can be simplified by considering only the frequency of occurrences of corrosion holes in each min-zone (as a function of the pipeline density) and the average amount released for each corrosion incident. Again, in this simplified form, the model allows computing the benefits of preventing corrosion, but not the benefits of earlier detection through better inspection and maintenance programs, which may themselves be cost-effective safety measures. The model can also be expanded to include the rate of deterioration of corrosion breaches and therefore, to allow computation of the benefits of earlier detection. To do so, a simple analysis of the corrosion process over time may be required. If the mean amount of oil spilled per event is the only result of interest, however, the mean time to detection for different types of pipelines (e.g., each diameter range) might be sufficient. The model could also be expanded to include corrosion of gas pipes; however, the environmental and safety consequences of these events are not considered high.
Initiating Event d (IEd): Effects of Storms and Hurricanes, Remote from Platforms
The severe wave forces of storms and hurricanes can disturb the sea floor, cause mudslides, expose buried pipelines, and damage exposed (unburied) pipelines. The effect of the waves on the pipelines depends on the energy involved, which in turn depends on the water depth. It is assumed, in this simplified model, that the distribution of occurrences of storms and hurricanes is uniform over the Gulf region. Each of them, however, affects a particular area.
The mean annual amount of oil spilled from leaks due to storms and hurricanes depends on the frequency of storms and hurricanes in the Gulf, the mean size of the area affected by each event, the distribution of event severity levels (measured, for example, by the wave heights), the water depth (which determines the energy of the waves and their effects on the sea floor given the event severity in the area affected), the pipeline diameters and densities in the considered rain-zone (which determine the sizes of the breaches and the magnitudes of the spills), and the mean spill duration.
For this failure mode, there are clear event dependencies (e.g., the same event can affect several adjacent min-zones); but if one focuses only on averages, the mean of the total amount of oil spilled per year can be obtained by multiplying the average total amount of oil spilled per storm by the mean annual number of storms, regardless of geographic correlations.
Initiating Event e (IEe): Pipeline Failure, Near Platforms
This class of initiating events is a large one, which includes pipe ruptures under normal loads due to corrosion, rupture of normal pipes due to excessive loads such as overpressure, the impact of dropped or dragged objects, heat loads due to fire, or the blast of explosions initiated elsewhere in the platform system. It also includes the effects of storms and hurricanes at the site of the connection between platforms and risers. This class of accident initiators is therefore much more complex than the previous ones.
A complete analysis of the reliability of the pipelines at the interface with the platforms involves computation of the probability that the annual extreme value of the load (a random variable described by its probability distribution) exceeds the pipeline capacity (described by another random variable). Accidents initiated on the platform constitute, in turn, initiating events for the failure of the pipelines at the interface with the platform. An example of such cases is the Piper Alpha accident in the North Sea, where the riser from platform Tartan failed at the interface with the Piper Alpha under the heat loads generated by fire on the deck. Other accident initiators occur in the pipelines themselves (e.g., corrosion leaks).
Altogether, the set of initiating events IEe can be subdivided into five categories: (a) leaks due to corrosion of a pipeline at the interface with the platform, (b) leaks due to the impact on a pipeline of a dropped object or a vessel (e.g., fishing vessels or service and supply boats) at the site of a platform, (c) pipeline failures due to a large and sudden increase of pressure (caused by human error, equipment failure, or an explosion originating at platform equipment), (d) pipeline failure under severe, sustained fire load, and (e) pipeline failure due to the effects of hurricanes and storms.
Each class of accident initiators requires a probabilistic risk assessment, possibly a partial analysis focusing on the components of interest. In principle, each of these accident sequences must be studied starting from the platforms configuration, its functions, and its operating procedures, including inspection and maintenance. In practice, the analysis can be simplified by computing or estimating based on global accident data, the rates of occurrences per (generic) type of platform. The number of casualties due to each type of initiating event is influenced by the nature of the event, its frequency, its severity, whether the pipe carries oil or gas, further developments (such as fires and explosions), and the number of workers exposed. The mean annual amount of oil spilled also depends on the nature of the incident/accident initiator, on the detection time, the diameter of the pipe, the pressures, and the time to response. The property damage (as well as the number of casualties) depends in large part on whether or not the pipeline rupture results in fires, explosions, or further failures that can affect the rest of the platform. 3
NOTATION
EV(X): Expected value (mean) of a random variable X
p(E): Probability of an event E
p(E|Y) : Conditional probability of E given Y
EV(X|Y): Expected value of X given Y
|
3 |
Only fixed platforms are considered in this section. Mobile drilling units are not included because there are fewer of them (less than 5 percent of the total platform and rig total in the Gulf of Mexico). |
Of the following notations, some represent indexes, some are events (e.g., vessel-pipeline collision), some are random variables, some are means of random variables, and some are probabilities.
Characteristics of Min-Zone i
i: Index of min-zone = {j, k, l} (pipeline density, vessel traffic density, water depth indexes for min-zone i)
ai: Proportion of exposed pipelines in min-zone i
bi: Proportion of live pipelines in min-zone i; bi may depend on ai
gi: Proportion of live pipelines transporting gas or liquefied gas in min-zone i (1-gi transport oil); gi may depend on ai
Si: Surface of min-zone i in square miles
Fi: Average number of people on vessels in the most exposed group in min-zone i (i.e., personnel on fishing vessel or service vessels more than 150 days per year), based on average number of fishing or service vessels and average size of crew
Characteristics of Pipelines
m: Index of pipe diameter ranges
dm: Discretized distribution of pipe diameters, i.e., proportion of pipelines of diameter in ranges indexed in m. Examples:
m = 1 diam < 2" => d1 = 10%
m = 2 2"< diam < 5" => d2 = 25%, etc.
(This distribution is assumed to be independent of the min-zone. The model can be easily modified to include different diameter distributions in different zones.)
Collision Between Vessels and Live Exposed Pipelines
C: Collision between a vessel and an exposed pipeline
ci: Mean number of collisions per year and per square mile between a vessel and an exposed pipeline (live or empty); ci depends on j, k, l and ai
Ci: Mean number of collisions per year in min-zone i between a vessel and an exposed pipeline
EX: Explosion (or sudden fire) following a collision between a vessel and a live gas pipeline
pm(EX|C): Probability of explosion (or sudden fire) given a collision between a vessel and a live gas pipeline in the diameter range m
NEXi: Mean annual number of explosions or sudden fires caused by vessel/pipeline collisions in min-zone i
D: Event defined as follows: at least one human death occurs due to an explosion or a sudden fire in a specified collision
p(D): Probability of at least one human death in an explosion or a sudden fire in a specified collision
NDEX: Mean number of casualties on board given an explosion or sudden fire caused by a vessel/pipeline collision
NDCi: Mean annual number of casualties in all vessel/pipeline collisions in min-zone i
OD: Event defined as follows: at least one death occurs in a given year in the Gulf in vessel-live pipeline collisions
pi(D): Annual probability of at least one human death in rain-zone i due to collision between a vessel and a pipeline
SPm: Mean spilled volume following a collision of a vessel with a live pipeline of diameter m transporting oil
XCOi: Mean volume of oil spilled per year due to collisions between vessels and exposed live pipeline transporting oil in min-zone i
PDCL: Mean value of the property damage (to vessel and pipeline owners) per collision between a vessel and an exposed live pipeline given that there is no fire or explosion
PDCX: Mean value of the property damage (to vessel and to pipeline owners) per collision between a vessel and an exposed live pipeline transporting gas given that an explosion occurs
PDCE: Mean value of the property damage to vessels per collision between a vessel and an exposed empty pipeline
PDCi: Mean value of total annual property damage due to collisions between vessels and exposed pipelines in min-zone i
IRi(D): Individual risk per year in “offsite” pipelines of min-zone i (away from the immediate vicinity of platforms) assuming that the risk of casualty is borne mostly by the regular service vessels' and fishing vessels' crews and that no one takes extra
Object Impact (Mostly Dropped and Dragged Anchors)
O: Impact of an anchor or other dropped object on a live exposed pipeline
oi: Mean annual number of object impacts on live exposed pipelines per square mile of min-zone i as a function of j, k, l, ai and bi
Oi: Mean annual number of object impacts on live exposed pipelines transporting oil in min-zone i
q: Index of breach diameter ranges in object impact incidents
ohq: Occurrence of a hole of diameter q caused by object impact on a live pipeline
pm(ohq|O): Probability of a hole of diameter q (discretized distribution) conditional on impact of object on a live exposed pipeline in the diameter range m
tr: Spill duration ranges (Example: t1: <1 day; t2: from 1 to 5 days; t3: > 5 days)
p(tr|O, ohq): Probability of oil spill of duration tr (discretized distribution over different time intervals) conditional on impact of object on a live exposed pipeline and a hole of diameter q
X(ohq ,tr): Average amount of oil spilled in each range of spill duration tr from a pipeline, through a breach of diameter range ohq
XDO: Mean amount of oil spilled per object impact
XDi: Average amount of oil spilled per year in min-zone i due to dropped anchors or impact of other objects
PDO: Mean value of the property damage per event (an impact on live exposed pipelines of dropped objects including anchors)
PDOi: Mean value of annual property damage due to impact on live exposed pipelines of dropped objects including anchors in min-zone i
Corrosion Holes
CHE: Occurrence of a corrosion hole in an exposed pipeline
CHB: Occurrence of a corrosion hole in a buried pipeline
chi: Mean annual number of corrosion holes in live pipelines per square miles of rainzone i (depends on pipeline density)
CHEi: Mean annual number of corrosion holes in exposed live pipelines transporting oil in min-zone i
CHBi: Mean annual number of corrosion holes in buried live pipelines transporting oil in min-zone i
c: Index of corrosion hole diameter ranges when detected and fixed
dc: Corrosion hole diameter ranges when detected and fixed
NCEicm : Mean annual number of corrosion holes in exposed oil pipelines of diameter m, that reach diameter c (discretized) in min-zone i
NCBicm : Mean annual number of corrosion holes in buried oil pipelines of diameter m, that reach diameter c in min-zone i
p(dc|CH): Probability that a corrosion hole reaches diameter dc conditional on occurrence on a pipe before it is detected and fixed
p(dc|CHE): Probability that a corrosion hole reaches diameter dc conditional on occurrence on an exposed pipe before it is detected and fixed
p(dc|CHB): Probability that a corrosion hole reaches diameter dc conditional on occurrence on a buried pipe before it is detected and fixed
p(tr|CHE, dc): Probability of oil spill duration tr conditional on corrosion in a live exposed pipeline and a hole that eventually reaches diameter dc
p(tr|CHB, dc): Probability of oil spill duration tr conditional on corrosion in a live buried pipeline and a hole that eventually reaches diameter dc
XCE(dc, tr): Mean volume of oil spilled through a corrosion hole of final diameter dc in alive exposed pipeline before the problem is detected and fixed
XCB(dc, tr): Mean volume of oil spilled through a corrosion hole of final diameter dc in a (live) buried pipeline before the problem is detected and fixed
XCEi: Mean amount of oil spilled per year through corrosion holes in exposed live pipelines transporting oil in min-zone i
XCBi: Mean amount of oil spilled per year through corrosion holes in exposed buried pipelines in min-zone i
XCi: Mean annual amount of oil spilled through corrosion holes in both exposed and buried pipelines in min-zone i
REi: Mean annual cost of repair of corrosion holes in pipelines in min-zone i
REEcm: Mean cost of repair of a corrosion hole of final diameter c in an exposed pipeline of diameter m
REBcm: Mean cost of repair of a corrosion hole of final diameter c in a buried pipeline of diameter m
Hurricanes and Storms
H: Occurrence of a storm or a hurricane
NH: Number of hurricanes per year in the Gulf of Mexico
pNH(nh): Probability of occurrence of nh hurricanes or storms per year anywhere in the Gulf of Mexico
s: Levels of severity of storms and hurricanes (from s=0, no effect, to a chosen smax)
pi(s|H): Probability distribution of the local severity s (wind speed) of a storm or hurricane affecting min-zone i conditional on occurrence of H anywhere in the Gulf. Severity levels are discretized into a few ranges. They determine forces on exposed pi
NHBi: Mean annual number of pipeline breaches due to storms and hurricanes in minzone i
pi(nb|H, s): Probability that a storm or hurricane of severity s that affects min-zone i causes nb breaches in marine pipelines in min-zone i (depending on the pipeline density and the water depth)
XHi: Mean amount of oil spilled per year in min-zone i due to damage caused by storms and hurricanes to live pipelines transporting oil
XH: Mean volume of oil spilled in a breach caused by a storm or a hurricane in a live pipeline transporting oil in min-zone i (assumed here to be averaged over pipe diameters, severity of the damage to the pipe and detection time)
RHi: Mean annual cost of repair of breaches in pipelines due to storms and hurricanes in min-zone i
RH: Mean cost of repair of damage to pipelines due storms and hurricanes for all events and types of breaches
Risk at the Sites of Platforms
z: Index of platforms in min-zone i (depends on i)
v: Index of initiating events at the site of the platform
IEv: Initiating event of index v:
v = 1: breaches due to pipe corrosion at the interface with the platform,
v = 2: breaches due to the impact on a pipe of a dropped object or a vessel (e.g., fishing vessels or service and supply vessels) at the site of a platform
v = 3: pipe failures due to a large and sudden increase of pressure (which can be caused by human error, equipment failure, or an explosion originated in platform equipment)
v = 4: pipe failure under severe, sustained fire load
v = 5: pipe failure due to the effects of hurricanes and storms.
Nzv: Mean annual number of occurrences of initiating event IEv at the site of platform z p(D|IEv): Probability of at least one death conditional on the occurrence of initiating event IEv on platform z (PRA result)
p(Dz): Probability of at least one death in any given year on platform z in an accident involving the pipelines
Nz: Average number of workers on platform z
NDz: Expected annual number of deaths on platform z
NDzv: Expected number of casualties in each accident of type v on platform z
Xvz: Mean amount of oil spilled conditional on occurrence of initiating event IEv on platform z (PRA result)
PDvz: Mean property damage conditional on the occurrence of initiating event IEv on platform z (PRA result)
XPi: Mean amount of oil spilled per year due to pipeline failure at the site (or in the vicinity) of platforms in min-zone i
PDPi: Mean property damage per year due to pipeline failure at the site (or in the vicinity) of platforms in min-zone i
pi(DP): Probability that at least one death occurs in any given year due to pipeline failures at the site (or in the vicinity) of a platform in min-zone i
IRz(i)(DP): Individual risk (annual probability of death) for platform workers in accidents involving pipes at the site of platform z(i) in min-zone i
COMPUTING THE RISK FOR MIN-ZONE I
The risk is computed first for each class of initiating events (denoted IEa, IEb, IEc, IEd, and IEe), then added for all types of initiating events. It is assumed that these initiating events are mutually exclusive and that their effects are additive. It is also assumed that the ratios of live-to-empty, buried-to-exposed and gas-to-oil pipelines are independent of other factors, and uniform accross min-zone i. This assumption may have to be reexamined in actual applications, and the equations may have to be modified accordingly.
IEa: Collision Between a Vessel and an Exposed Live Pipeline Carrying Gas
To model the risk of loss of lives in vessel-pipeline collisions, one can use an influence diagram similar to that shown in Figure E-5. An influence diagram is a directed graph whose nodes represent random events or random variables characterized by probabilities and probability distributions. 4An arrow between two nodes means that the probabilities characterizing the second node depend on the value of the first one. For example, the number of human casualties depends on the occurrence of an explosion or a sudden fire, which requires (1) that a collision occurs, (2) that the pipeline is live, (3) that it transports gas, and (4) that the diameter of the pipe (therefore the amount of gas involved) is sufficient.
The mean annual number Ci of collisions in min-zone i between vessels and exposed live pipelines transporting gas depends on the surface of the min-zone, the collision rate per square mile and the proportions of pipelines that are live and transport gas (it is assumed here that these two ratios are independent):
Ci = Si × ci × bi × gi Eq. 1
The mean annual number of explosions (or sudden fires) due to collisions between vessels and exposed pipelines in min-zone i depends on the total number of collisions, the distribution of pipe diameters, and the probability of explosion given collision in each diameter range. Note that this equation assumes that the probability of collision is independent of the pipe diameter.
The annual probability that at least one death occurs in min-zone i in explosions or sudden fires due to vessel/pipeline collisions is about equal to the product of the number of explosions and the probability of at least one death given that an explosion occurs
|
4 |
Schachter, R. D. 1986. Evaluating influence diagrams. Operations Research 34(6). |
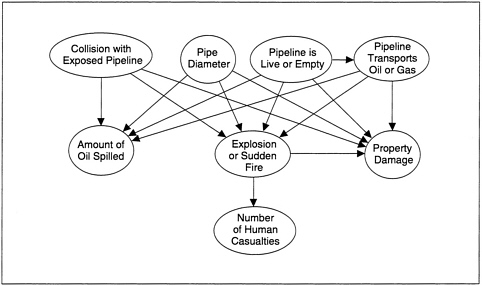
FIGURE E-5 Influence diagram for assessment of the risks involved in vessel/pipeline collisions.
following a collision. It is assumed here that p(D) is small, and that the type of vessel is not a major factor in the term p(D); otherwise, the computation should be done for the different vessel types.
pi(D) ≈ NEXi × p(D) Eq. 3
The mean annual number of deaths in explosions or sudden fires due to vessel/ pipeline collisions in min-zone i is the product of the average number of explosions by the average number of deaths per explosion (the latter can be either infered from existing statistics, or computed as the result of a model involving different types of vessels).
NDCi = NDEX × NEXi Eq. 4
Assuming that the risk of casualty is mostly borne by the service vessels' and fishing vessels' crews (Fi people in min-zone i), and that risk avoidance behaviors are fairly uniform (e.g., no one actually seeks contact with the pipelines), the individual risk for fishing vessel crews in min-zone i (annual probability of death in collision accidents for the most exposed individuals), is approximately:
IRi(D) = NDCi/Fi Eq. 5
The result of Equation 5 is the ratio of the annual expected value of the number of casualties in min-zone i to the number of individuals exposed. Therefore, it represents an individual risk per year of life in which the individual may spend only one fifth of the year on the vessel. It is not a risk per year of exposure.
The mean value of annual property damage to vessel and pipeline owners due to collisions between vessels and exposed pipelines in min-zone i is the sum of the property damage for the three following cases: the pipeline is empty, the pipeline is live and there is no explosion, the pipeline is live and there is an explosion:
PDCi = [Si × ci × (1 − bi)] × PDCE + [Si × ci × bi − NEXi] × PDCL + NEXi × PDCX Eq. 6
The mean spilled volume per year due to collisions of vessels and exposed live pipelines transporting oil in min-zone i is the sum of the spills over all ranges of pipeline diameters:
IEb: Oil Spills due to Dropped and Dragged Anchors (or Impact of Other Objects)
The analysis is based on the events and random variables described in the influence diagram of Figure E-6. It is assumed that the main effect is the spill of oil and the property damage to live pipelines.
The mean annual number of impacts of dropped and/or dragged anchors or other objects on live, exposed pipelines transporting oil in min-zone i is:
Oi = Si × oi × (1 − gi) Eq. 8
This equation assumes that oil and gas pipelines are equally likely to be hit.
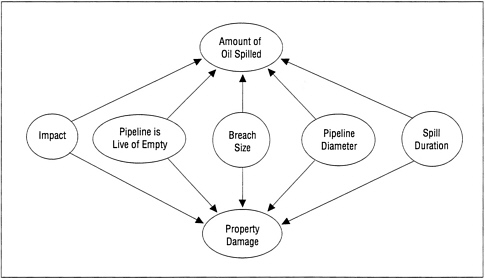
FIGURE E-6 Influence diagram (for assessment of the risk to pipelines due to dropped and dragged anchors (or impacts of other objects).
The mean amount of oil spilled per object impact given diameter of pipe, size of breach, and spill duration is the sum for all values of these three variables (considered here independent) of the amount of oil spilled under each scenario:
The mean amount of oil spilled per year in min-zone i due to impacts of dropped and/ or dragged anchors or other objects on live exposed pipelines transporting oil is the amount spilled per event multiplied by the number of events:
XDi = XDO × Oi Eq. 10
Similarly, the mean value of the annual property damage due to impacts of dropped and/or dragged anchors or other objects on all live exposed pipelines in min-zone i is the product :
PDOi = Oi × PDO Eq. 11
IEc: Corrosion of Pipelines Transporting Oil
The simplified model used here relies on the events and random variables described in Figure E-7.
The final size of the corrosion hole is a variable of the model because it would be affected by inspection policies that would allow earlier detection of corrosion and shorter oil spill durations.
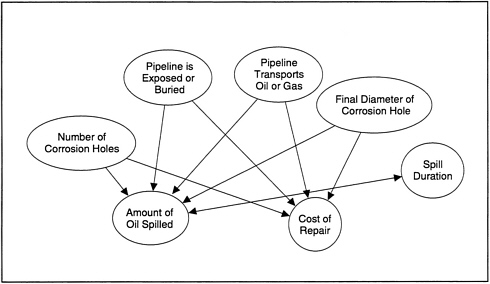
FIGURE E-7 Influence diagram for assessment of the risk due to pipeline corrosion.
The mean annual number of corrosion holes in exposed live pipelines transporting oil in min-zone i is the product:
CHEi = Si × chi × ai × (1 − gi) Eq. 12
The mean annual number of corrosion holes that reach diameter c (discretized) in exposed pipelines of diameter m, transporting oil, in min-zone i is:
NCEicm = CHEi × p(dc|CHE) × dm Eq. 13
The mean annual amount of oil spilled through corrosion holes in exposed live pipelines transporting oil in min-zone i is sum of the amounts of oil spilled for all pipe diameters, sizes of corrosion holes, and spill durations:
The same computation can be performed for corrosion holes in buried pipes (although the quantities spilled may be very small: it may take years before a leak develops and one may choose to skip equations 15 through 17).
The mean annual number of corrosion holes in buried live pipelines transporting oil in min-zone i is:
CHBi = Si × chi × (1− ai) × (1 − gi) Eq. 15
The mean annual number of corrosion holes in buried pipelines of diameter m transporting oil, that reach diameter c (discretized) is:
NCBicm = CHBi × p(dc|CHB) × dm Eq. 16
The mean amount of oil spilled per year through corrosion holes in buried live pipelines in min-zone i is the sum of the amounts of oil spilled for all scenarios (pipe diameters, sizes of corrosion holes, and spill durations):
The mean total annual amount of oil spilled through corrosion holes both in exposed and buried pipelines in min-zone i is thus the sum:
XCi = XCBi + XCEi Eq. 18
The mean annual cost of repair of corroded oil pipelines, both exposed and buried (costs of fixing corrosion holes excluding the costs of corrosion protection) is a function both of the diameter of the pipes and of the size of the corrosion holes:
(One may want to add a similar equation for gas pipelines).
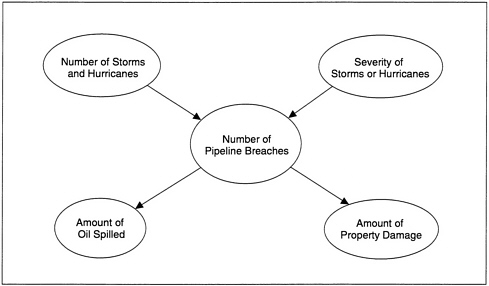
FIGURE E-8 Influence diagram for assessment of the risk to pipelines due to severe storms.
IEd: Storms and Hurricanes
The very simplified model developed further can be represented by the influence diagram of Figure E-8. This model can be developed further if needed by including the size of the area affected by an event (random variable), the diameter of the damaged pipelines, the duration of the spill, etc.
The mean annual number of pipeline breaches due to storms and hurricanes in minzone i is obtained by summing their joint distribution over the number of storms, their severity given that they occur, and the number of breaches per storm of given severity:
The mean annual amount of oil spilled due to breaches in pipelines caused by hurricanes and storms in min-zone i is obtained by restricting this number to live pipelines transporting oil, and multiplying the result by the mean amount spilled per event:
XHi = NHBi × bi × (1 − gi) × XH Eq. 21
Similarly, the mean annual amount of property damage (costs of repairs of the live pipelines damaged by storms or hurricanes) in min-zone i is:
RHi = NHBi × bi × RH Eq. 22
In addition to direct damage, hurricane and storms may also expose pipelines that were previously buried thus increasing the probability of vessel collision in the future (and therefore the results of the analysis of IEa). This effect is not included in this simplified model but can be added in a more complete version.
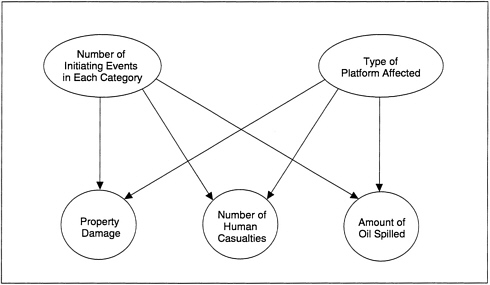
FIGURE E-9 Influence diagram for assessment of the risk due to accidents and incidents at the interface between pipelines and platforms.
IEe: Accidents and Incidents Involving Pipelines at the Site of a Platform
It is assumed here that either a preliminary PRA has been performed, accounting for the specific configuration of each platform and pipeline system, or that global rates of different categories of incidents have been assessed for different types of platforms. For initiating events involving, for instance, severe sustained fire loads across the whole platform (of the type of the Piper Alpha accident), a full (albeit simplified) PRA may be needed. It is also assumed that initiating events on a given platform are mutually exclusive, and that pipe failures across different platforms are independent.
The structure of the model is presented in the influence diagram of Figure E-9. For each type of platform, the full PRA allows computing the probabilistic link between initiating events and consequences.
The probability of at least one death in any given year on platform z in an accident involving the pipelines is one minus the probability of no death on platform z for all possible initiating events:
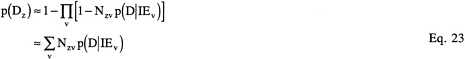
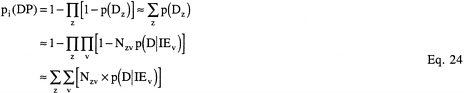
The probability that at least one death occurs in any given year due to pipeline failures at the site (or in the vicinity) of a platform in min-zone i is thus:
The expected annual number of casualties at the site of a given platform is:
The individual risk (annual probability of death) for a year of a worker's life on the platform is approximately:
The mean total amount of oil spilled per year due to pipeline failure at the site (or in the vicinity) of platforms in min-zone i is obtained by summing the amounts spilled over platforms and types of initiating events:
Similarly, the mean total property damage per year due to pipeline failure at the site (or in the vicinity) of platforms in min-zone i is:
OVERALL RISK
The annual probability of at least one casualty in the Gulf due to pipelines away from platforms (explosions or sudden fires following collisions between a vessel and an exposed live pipeline transporting gas) is one minus the probability of no casualty:
The upper bound of the individual risk across min-zones for vessel crews in the Gulf is the maximum of individuals risks over all min-zones:
The mean amount of oil spilled per year due to pipeline failures caused by any of the five considered accident initiators (vessel collision, dropped objects, corrosion, storms and hurricanes, pipe failure at the site of a platform) is the sum of all amounts of oil spilled over the different types of initiating events considered here:
Because the environmental damage caused by oil spills may depend on the distance of the spill to the shore, one may want to compute separately the amount of oil spilled in shallow waters. The sum of Equation 31 is then restricted to the values of index i corresponding to the values of index l (water depth) of particular concern.
Similarly, the mean annual amount of property damage (including costs of repair of corroded pipelines) in the Gulf due to pipeline failures caused by any of the five considered accident initiators (vessel collision, dropped objects, corrosion, hurrianes and storms, and pipe failure at the site of a platform) is the sum:
TABLE OF REQUIRED DATA
Again, it is important to remember that the model presented above is a prototype describing the architecture of what can be a much more complex analysis. The form of the data may be adjusted to the need of information to support specific decisions or to simplify the task of gathering appropriate statistics or expert opinions.
Maps:
-
Water depth
-
Vessel traffic density
-
Pipeline densities
-
Platform sites
Pipeline diameters:
-
Ranges of pipeline diameters
-
Discretized distribution of pipe diameters, i.e., proportion of pipelines in each specified diameter range. The model assumes that this distribution is independent of the min-zone; if this is not the case, the equations can be modified.
Data for Each Min-Zone
General characteristics:
-
Surface in square miles
-
Proportion of exposed pipelines
-
Proportion of live pipelines (may depend on the previous number)
-
Proportion of live pipelines transporting gas or liquefied gas (the rest transport oil)
-
Average number of people on vessels in the most exposed group (i.e., personnel on fishing vessel or service vessels more than 150 days per year), based on average number of fishing or service vessels and average size of crew
Collisions between vessels and live exposed pipelines:
-
Mean number of collisions per year and per square mile between a vessel and an exposed pipeline (live or empty)
-
Probability of explosion conditional on a collision between a vessel and an exposed live pipeline transporting gas in each diameter range
-
Expected number of casualties given that an explosion occurs following collision (this number is a function of the type of vessels that operate in the min-zone, and can be derived from the probability distribution of the number of casualties in collision-related explosions)
-
Probability of at least one death due to explosion or sudden fire in a collision between a vessel and an exposed live pipeline transporting gas in each diameter range (can be derived from the probability distribution of the number of casualties in collision-related explosions)
-
Mean spilled volume following a collision of a vessel with a live pipeline of given diameter transporting oil
-
Mean value of the property damage per collision between a vessel and an exposed empty pipeline
-
Mean value of the property damage per collision between a vessel and an exposed live pipeline transporting oil or gas given that no explosion or sudden fire occurs
-
Mean value of the property damage per collision between a vessel and an exposed live pipeline transporting gas given that an explosion or a sudden fire occurs
Object impact:
-
Define ranges of sizes for diameter of breaches
-
Define ranges of spill duration
-
Mean annual number of events (impacts on live exposed pipelines of dropped objects including anchors) per square mile
-
Probabilities of breaches of specified diameters (discretized distribution) conditional on impact of object on a live exposed pipeline
-
Probabilities of oil spills of specified duration (discretized distribution over different time intervals), conditional on impact of an object on a live exposed pipeline and a breach of specified diameter. (If the amount spilled is simply proportional to the spill duration, can be replaced by the mean spill duration and the mean amount of oil spilled per event.)
-
Average amount of oil spilled as a function of the range of spill duration and the diameter range of the breach. (If the amount spilled is simply proportional to the spill duration, can be replaced by the mean spill duration and the mean amount of oil spilled per event.)
-
Mean value of the property damage per event
Corrosion holes:
-
Define ranges of sizes of corrosion holes
-
Define ranges of spill duration
-
Mean annual number of corrosion holes in live pipelines per square mile of min-zone i. This figure can be derived, for example, from the number of corrosion holes per mile of pipes, the pipeline density, and the surface of the min-zone.
-
Probabilities that corrosion holes eventually reach specified sizes
-
Probabilities of specified oil spill durations through corrosion holes of specified final sizes in live exposed pipelines
-
Probabilities of specified oil spill durations through corrosion holes of specified final sizes in live buried pipelines
-
Mean volumes of oil spilled through corrosion holes of specified final sizes in live exposed pipelines
-
Mean volume of oil spilled through corrosion holes of specified final sizes in (live) buried pipelines
-
Mean costs of repair of a corrosion hole of specified final size in an exposed pipeline of specified diameter
-
Mean cost of repair of a corrosion hole of specified final size in a buried pipeline of specified diameter
Hurricanes and storms:
-
Define ranges of storm severity characterized, for example, by the maximum wind speed
-
Probabilities of occurrences of different numbers of hurricanes or storms per year anywhere in the Gulf of Mexico
-
Probability distribution of the local severity in min-zone i given that an event occurs anywhere in the Gulf
-
Probabilities that a storm or hurricane of given severity causes different numbers of breaches in marine pipelines in min-zone i given that min-zone i is affected
-
Mean volume of oil spilled in a breach caused by a storm or a hurricane in a live pipeline transporting oil in min-zone i
-
Mean costs of repair of damage to pipelines due storms and hurricanes for all types of events and breaches
Risk at the site of platforms:
-
Define different classes of platforms. For each class, it is assumed that a PRA or similar type of analysis has been performed, to obtain the probabilities and the consequences of different types of accidents characterized by their initiating events and
-
Define five classes of relevant initiating events:
-
Breaches due to pipe corrosion at the interface with the platform,
-
Breaches due to the impact on a pipe of a dropped object or a vessel (e.g., fishing vessels or service and supply vessels) at the site of a platform
-
Pipe failures due to a large and sudden increase of pressure (which can be caused by human error, equipment failure, or an explosion originated in platform equipment)
-
Pipe failure under severe, sustained fire load
-
Pipe failure due to the effects of hurricanes and storms.
-
-
Mean annual number of occurrences of initiating events of each type at the site of each class of platform
-
Probability of at least one death conditional on the occurrence of each type of initiating event on each class of platform (PRA result)
-
Average number of workers on each class of platform


