
2
Safety Experience
The hazards presented by marine pipelines are not to be taken lightly: environmental and property damage and, albeit rarely, human injury and death. Vessels maneuvering in shallow water may dent or rupture pipelines, releasing explosive or environmentally damaging hydrocarbons. In deeper water, fishing vessels sometimes snag nets and other gear on valves and other pipeline features, tearing the nets and occasionally causing leaks. Larger vessels may drag their anchors across pipelines, bending or cracking them. Internal and external corrosion are pervasive threats of leaks. Storms and seafloor mudslides may move, damage, or expose once-buried pipelines, allowing anchors and nets to foul them. Objects dropped from vessels or platforms can also damage pipelines. During the late 1980s the 17,000 miles of pipeline in the waters of the U.S. outer continental shelf (OCS) experienced a leak or other reportable failure about once every five days, owing to one or another of these causes (Woodson, 1991).1
Most pipeline failures result in relatively small leaks of oil or gas, which may pollute the ocean and shore. While pipeline oil spills of thousands or even tens of thousands of barrels occur occasionally, between 1967 and 1990 an average of only 10,585 barrels annually of oil pollution from marine pipelines was reported to federal regulatory agencies on the OCS (Woodson, 1991).
Oil pollution of the Gulf from pipelines is roughly comparable to that from tank vessel accidents, but with great variation from year to year. Another source, probably much greater, is runoff from urban and industrial areas in the Mississippi watershed. Natural seeps are also estimated to be very large sources. Oil remaining in the oil and water mixture produced by offshore oil wells (called “produced waters”) probably contributes several times as much oil to the Gulf as pipelines or tanker accidents. Judging the relative impacts of these sources is beyond the scope of this study.
Injury or loss of life as a result of pipeline damage is rare, but not unknown, and it is these risks that are perhaps most prominent in the public mind. Natural gas and natural gas liquid pipelines in particular (about 70 percent of the marine pipeline mileage) hold the potential for explosions. A series of dramatic accidents in the late 1980s, involving
|
1 |
For this committee the term “failure” includes any damage that is required to be reported to safety regulators. Such damage may range from small pin hole leaks caused by corrosion to major failures resulting in fires, explosions, or large oil spills. |
natural gas explosions associated with pipeline damage, resulted in deaths, injuries, and substantial property damage.
The Sea Chief accident. In July 1987, while working in shallow coastal waters off Louisiana, the menhaden purse seiner Sea Chief struck and ruptured an 8-inch natural gas liquids pipeline operating at 480 psi. The resulting explosion killed two crew members. Divers investigating found that the pipe, installed in 1968, was covered with only 6 inches of soft mud, having lost its original 3-foot cover of sediments (Joint Task Force on Offshore Pipelines, 1990). (Chapter 5 outlines the activities of the menhaden fishing fleet.)
The Northumberland accident. October 1989 saw a strikingly similar accident, with even greater consequences. The menhaden vessel Northumberland struck a 16-inch gas pipeline in shallow water near Sabine Pass, Texas. The vessel was engulfed in flames; 11 of the 14 crew members died. The pipeline, installed in 1974 with 8 to 10 feet of cover, was found to be lying on the bottom, with no cover at all (National Transportation Safety Board, 1990).2
Sonat/Arco, South Pass 60. In March 1989 a flash fire and explosion occurred on a Sonat/Arco platform in lease block South Pass 60, during repair of an associated pipeline. Seven of the platform crew died, and ten others were injured. Property damage totaled about $70 million. Investigation showed the incident had been caused by human error, leading to the sudden release of gas and liquids from the pipeline cut during repair work (which had been occasioned by damaged from an anchor line). The repair was complicated by the operator's failure to update pipeline drawings, which left the workers unaware of a subsea valve assembly that would have made the repair easier and safer (U.S. Department of Transportation, 1989).
These events illustrate the most catastrophic risk posed by pipelines: the possibility of human deaths. They have understandably aroused public and congressional concern about the overall safety of the offshore pipeline industry. Most of the events of interest are less serious, involving releases of gas or oil caused by corrosion or mechanical damage to pipelines and by natural forces, such as mudslides, and destabilization by storms and hurricanes.
The industry and its regulators are reexamining their approaches to safety in the light of this experience. This study seeks to help define the risks and to assess the adequacy of measures to control those risks. This chapter reviews what is known about the safety record.
DATA SOURCES
Various federal and state agencies independently collect data on pipeline failures:
-
The Minerals Management Service (MMS) of the U.S. Department of the Interior, requires operators to report “serious accidents,” including all spills of oil and deaths or serious injuries, on the OCS (seaward of state waters). These reports go back to 1967.
-
The Department of Transportation's Office of Pipeline Safety (OPS) requires
|
2 |
A subsequent survey of shallow-water pipelines, ordered by Congress through the Office of Pipeline Safety, found only a small fraction of the mileage (1.7 percent) with less than 1 foot of cover. These pipelines are now required to be reburied. |
-
pipeline operators to report all pipeline failures involving damage, death or injury, or pollution above certain thresholds. These reports extend from 1984 to the present.
-
The U.S. Coast Guard's National Response Center, since 1982, has received immediate telephone reports of spills of oil or other hazardous substances that meet or exceed thresholds established by the U.S. Environmental Protection Agency. (Even a light sheen of oil is sufficient to trigger a report.)
-
Most state agencies have rudimentary records of pipeline failures in their waters. (California is an exception, with a comprehensive record of failures in state waters going back more than a decade.)
LIMITATIONS OF THE SAFETY DATA
The several data sets on past pipeline failures, assembled independently, for varied purposes, by agencies with different (and changing) reporting requirements, and over different periods, cannot be expected to provide clear pictures of safety trends over time, or of subtle relations between operating or design practices and safety consequences. Only the broadest of patterns can be discernible in such a data base.
The agencies have collected data inconsistently, without interagency coordination, and often without a strong focus on safety planning or priorities. The reliability of the safety data is also limited by the unevenness of the agencies' data collection programs, which have widely varying reporting requirements (and varying incentives and disincentives for reporting). Some incidents are not reported at all (Bea, 1992; Donnell, 1992). Others are reported in more than one place (Mandke, 1990; Woodson, 1991).
As a result, data that would be useful in a thorough and detailed analysis of failures, their causes, and possible preventive or corrective measures are not requested or reported. The historical information to allow useful correlations between failure modes and such factors as pipeline age, type of pipeline, seafloor soil conditions, and water depth does not exist. Finally, the reported causes and consequences of failure identified by incident reports are often inaccurate, and follow-up reports are not always made.
Safety planning on the basis of such limited information is challenging, but not impossible. Modern techniques of risk analysis can guide the industry and its regulators in setting risk management priorities. Some of these techniques are outlined in Chapter 3 of this report, along with the framework of a risk analysis approach of a type that could be applied to the marine pipeline industry.
Minerals Management Service
The Minerals Management Service has the most comprehensive data-gathering program on pipeline failures on the OCS (Minerals Management Service, 1992; Woodson, 1991). The MMS requires more detailed accident information than OPS, and has an incident reporting system that follows up more thoroughly on the corrective measures taken. Under MMS regulations, all spills of oil must be reported both by telephone and in writing to the MMS District Supervisor. Reports must include the cause, location, volume of spill, and remedial action taken. Reports of spills of more than 50 barrels must include information on sea state, weather, and size and appearance of the spill (30 CFR 250.41). Serious accidents, deaths or serious injuries, and any fires, explosions, or blowouts on any pipeline area covered by an MMS permit must be reported (30 CFR 250.19). Appendix B is the Minerals Management Service form for reporting offshore accidents, oil spills, and blowouts.
The agency has compiled these reports, with some variations, since 1967. In addition, it routinely gathers OPS reports of incidents on the OCS. However, its data are confined to the OCS, and therefore do not shed light on many of the most important issues, such as the safety record of older pipelines, which are disproportionately located in the shallower state waters nearer shore.
MMS keeps detailed maps of all OCS pipelines (including OPS-regulated pipelines), which it is in the process of digitizing, with accident data, net hang sites, abandoned lines, and other information. To carry out its pollution prevention and response duties under the Oil Pollution Act of 1990, MMS will add data on pipelines in state waters (see Chapter 6).
Office of Pipeline Safety
OPS has collected data on marine pipeline failures, in both OCS and state waters, since 1984:
-
Operators of pipelines carrying hazardous liquids such as oil must report in writing (DOT Form 7000-1 [Appendix C]) any pipeline failures resulting in explosion or fire, loss of 50 or more barrels of hazardous liquid, escape to the atmosphere of more than 5 barrels per day of highly volatile liquids, death or serious injury, or property damage estimated at $5,000 or more.
-
Gas pipeline operators are required to report “incidents” (events involving releases of gas, death or injury requiring hospitalization, or property damage estimated at $50,000 or more) in writing (DOT Form RSPA F 7100.2-1 [Appendix D]).
Because of the high cost of making pipeline repairs offshore, the property damage thresholds result in essentially all failures of OPS- or MMS-regulated marine pipelines being reported. Telephone reports in either case are made immediately to the U.S. Coast Guard 's National Response Center (described below).
The two-page incident reporting forms used by the OPS request only the most basic and preliminary data about incidents (operator, location, numbers of deaths and fatalities, estimated property damage, estimated size of any spill, and apparent cause). They do not lend themselves to statistical interpretation, because they do not require precise enough information on the location and nature of damage, and because follow-up reports confirming initial estimates are often not completed. The agency does not publish separate safety statistics for marine pipelines. In addition to the incident reports, “safety-related conditions ” such as material defects, corrosion, or undue loading or movement of a pipeline by events such as earthquakes must be reported. OPS intends to propose expanding the reporting form to collect more information (personal communication, Cesar DeLeon, July 27, 1993). Details of this proposal were not available to the committee.
The reporting thresholds have varied substantially over the years, making it hard to establish trends in rates of incidents (Woodson, 1991).
U.S. Coast Guard, National Response Center
The U.S. Coast Guard's National Response Center (NRC) has collected data on oil spills since 1974, under the Federal Water Pollution Control Act of 1973 and several subsequent laws, including the Comprehensive Environmental Compensation and Liability Act, the Clean Air Act, the Toxic Substances Control Act, and the Resource Conser-
vation and Recovery Act. The NRC receives telephone reports of spills of oil or other hazardous substances that exceed thresholds established by the U.S. Environmental Protection Agency, and dispatches the necessary information to designated spill response teams. The reports cover all navigable waters of the United States.
For pipeline spills, the NRC is designated by OPS regulations as the recipient of immediate telephone reports. It began collecting these reports in 1982.
State Agencies
Few state agencies have made substantial efforts to collect safety data on marine pipelines until quite recently, preferring to rely on the OPS for data of this kind. Repeated inquiries by this committee at the Texas General Land Office (GLO) and the Louisiana Department of Natural Resources drew no response until mid-1993, when the GLO produced a printout of failures in Texas waters, without accompanying analysis. Louisiana provided no such information for the many miles of pipelines in its waters. California, with its 300 miles, is an exception; the State Lands Commission of California has recorded offshore pipeline failures since at least 1980 (Woodson, 1991).
PREVIOUS STUDIES
Several recent studies have been made of the marine pipeline failure data collected by the various regulatory agencies. The committee examined three in particular.
The Woodson Data Base
The most complete study yet of the available data on offshore pipeline safety was commissioned by the Marine Board of the National Research Council (Woodson, 1991). For the Gulf of Mexico OCS, the resulting data base records every failure of a gas, crude oil, or condensate pipeline reported to OPS, MMS, and the NRC between 1967 and 1990, in addition to 46 failures reported in an article by M. D. Reifel (1978). In all, the data base contains records of 1,047 events.
Woodson tabulates incident reports according to the following structure:
-
Number of reported events per failure mechanism and per year;
-
Number of reported events per failure mechanism and per month (thus accounting for weather patterns);
-
Number of reported events per failure mechanism and per nominal pipe diameter;
-
Number of reported events due to corrosion as a function of pipeline age; and
-
Number of reported events per failure mechanism in buried and exposed pipelines.
The data base has significant limitations, reflecting the weaknesses of its data sources:
-
Many of the reports compiled by Woodson are incomplete, with missing information on the causes of incidents, the ages of failed parts, and other important data.
-
Because it is restricted to the Gulf of Mexico OCS, it leaves out incidents in state waters, nearer shore, which contain the oldest pipelines and those most exposed to collisions by vessels.
-
Notably absent from this data base is information on the locations of failures (beyond specifying the the MMS lease blocks in which they took place), which would help highlight geographical patterns, such as the relation between offshore platforms and anchor damage (today poorly known).
The Woodson data base also excludes California. That state, with only about 300 miles of offshore pipeline, compared with the more than 20,000 miles in federal and state waters in the Gulf—is not critical to a statistical study of offshore pipeline safety.
Other Studies
J. S. Mandke (1990) of the Southwest Research Institute analyzed MMS pipeline failure data for the Gulf of Mexico (690 reported failures between 1967 to 1987). The aim was to relate pipeline failure trends to variables such as pipe size, failure location, nature of repair procedure, and reported failure cause. Mandke divided causes of incidents into five categories: material or equipment failure, operational problems, corrosion failures, storms and mudslides, and mechanical damage (including damage from anchors, fishing nets, and vessel hulls). Mandke's data, like Woodson's, are limited to the OCS. (In fact, his data are a subset of Woodson's.) However, his analysis provides useful insights about oil spills and other risks.
Larry Broussard (1992) of Tenneco analyzed pipeline failure reports to the OPS from 1984 to 1990, using similar categories to those of Woodson and Mandke. Broussard's data cover transmission lines in both state and federal waters.
CAUSES OF FAILURE
Reported causes of failures are not reliable; they are often determined by guesswork, without complete investigation or repair. Follow-up or “supplemental” reports are sometimes not made (U.S. Department of Transportation, 1989). In addition, different categories of causes cannot be regarded as entirely distinct, because of the likelihood of multiple failure modes. For example, a corrosion-weakened pipeline ruptured by storm or anchor damage would generally be reported as failing due to storm or anchor damage, not corrosion. (In fact, corrosion reports tend to decline after major storms [Woodson, 1991].) With these limitations in mind, however, it is possible to make some generalizations.
Causes of failure are categorized differently by the three analysts (Table 2-1). For comparison, they can be divided into the following broad categories:
-
Corrosion (external and internal);
-
Maritime activities (anchors, nets, trawls, and vessel contact);
-
Natural forces (storms, hurricanes, and mudslides); and
-
Other/unknown (including events attributed to “material failure”).
It can be seen from Table 2-1 that the three data bases are roughly consistent in the percentages of failures attributed to each of these causes. The Woodson data base is the most comprehensive, and will be the basis of the following analysis, except where noted otherwise.
Corrosion—internal and external—is the most widely reported cause of failure (50 percent of the incidents whose cause is reported), followed by maritime activities (anchor
TABLE 2-1 Marine Pipeline Incidents, by Reported Cause (Numbers of Occurrences and Percentages of Totals)
|
Percentage of total incidents attributed to each cause, by compiler and source of data (number of incidents per cause in parenthesis) |
|||
|
Cause of failure |
Woodson (MMS data, 1967-90) |
Mandke (MMS data, 1967-87) |
Broussard (OPS data, 1984-90) |
|
Corrosion (internal and external) |
50 (456) |
50 (343) |
45 (38) |
|
Material failure |
10 (94) |
9 (63) |
14 (12) |
|
Third party—nets, boats |
14 (124) |
21 (138) |
|
|
Storms/mudslides |
12 (106) |
12 (82) |
|
|
Outside forces |
31 (26) |
||
|
Other or unknown |
15 (136) |
9 (63) |
10 (8) |
|
Total (may not add, due to rounding) |
100 (916a) |
100 (690) |
100 (84) |
|
a Of the 1,047 incidents tabulated in the Woodson data base, only 916 included information on reported causes. |
|||
and net damage and vessel collisions) at 14 percent and natural forces (storms and mudslides) at 12 percent (Figure 2-1).
There appears to be no correlation between the product carried in the pipeline and the reported failure cause (Table 2-2). This result is intuitively satisfying for all major categories except corrosion; gas lines might be expected to have higher rates of internal corrosion, because the produced brines and other corrosive substances are less easily carried off by the product.
It is impossible to draw firm conclusions about the relative roles of internal and external corrosion, because more than one-third of the corrosion failure reports do not specify the location of corrosion. Mandke's (1990) analysis, however, shows that about 70 percent of corrosion failures occur in lines 6 inches or less in diameter, and that 78 percent take place at platforms, either in risers (vertical pipeline extensions from the seabed to the surface) or on the adjacent seabed. Industry experience suggests that many of these failures occur in production flowlines, in risers (through external corrosion in the splash zone or under clamps), and at the pipe bend where the riser meets the seabed (through internal corrosion on the pipe bottom). However, the data are insufficient to establish these patterns without doubt.
Relationships between failure rates and length of service cannot be established either. Such information would be extremely valuable in safety planning, and should be assigned a high priority in future risk assessment efforts.
CONSEQUENCES OF PIPELINE FAILURES
Like the causes of failures, the consequences are often inaccurately reported. Reports of incidents include preliminary estimates of the property damage or the size of oil spills, for example. These estimates are not always made by qualified observers. In any case, it is generally impossible to assess damage without carrying out detailed inspections and repairs. Depending on the agency involved and the willingness of the operator to file supplementary reports, these revised estimates may or may not find their ways into the official record (U.S. Department of Transportation, 1989).
Still, some broad conclusions can be drawn about the risks of different failure mechanisms.
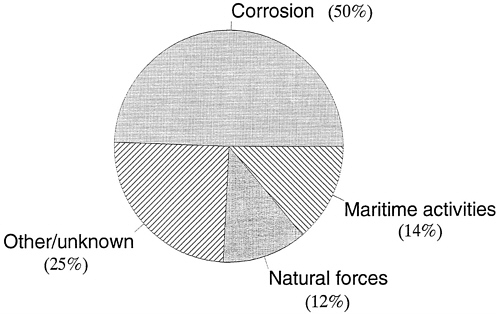
FIGURE 2-1 Pipeline failures, by reported cause.
TABLE 2-2 Reported Failure Causes, by Product Carried
|
Percentage of failures attributed to each category of cause in: |
||
|
Reported cause |
Oil lines |
Gas lines |
|
Corrosion |
48 |
50 |
|
Maritime activities |
14 |
12 |
|
Natural forces |
14 |
8 |
|
Other/unknown |
24 |
30 |
|
Total |
100 |
100 |
Deaths and Serious Injuries
Fatalities and injuries are rare in connection with pipeline failures. (This committee excluded from its consideration injuries and deaths incurred in routine pipeline operations and maintenance unconnected with pipeline failures.) The committee has found only six cases since 1967 in which offshore pipeline failures were associated with deaths or serious injuries in the United States. The Northumberland and Sea Chief accidents, already described, resulted from vessel collisions with gas and gas condensate lines in shallow water. The Sonat/Arco accident, also described earlier, resulted from the inadequate isolation of a platform from a gas pipeline undergoing repairs. Two serious injuries occurred in 1990 during repairs of the Sonat Sea Robin system (a gathering system
TABLE 2-3 Deaths and injuries associated with pipeline failures, by source, 1967-1990
|
Accident |
Date |
Number of fatalities |
Number of injuries |
Pipeline type |
|
Placid, Eugene Island 296a |
1975 |
3 |
0 |
Gas?b |
|
Chevron, Ship Shoal 266a |
1979 |
1 |
1 |
Gas condensate?c |
|
Sea Chief |
1987 |
2 |
1 |
Gas condensate |
|
Northumberland |
1989 |
11 |
3 |
Gas |
|
Sonat/Arco, South Pass 60 |
1989 |
7 |
10 |
Gas |
|
Sonat Sea Robin |
1990 |
0 |
2 |
Gas |
|
a Not reported in Woodson data base. b Not specified in MMS data base, but circumstances (explosion during repair, no pollution) strongly suggest gas. c Not specified in MMS data base, but circumstances (explosion during repair, more than 50 barrels pollution) strongly suggest gas condensate. Source: Data from Minerals Management Service. |
||||
for multiple production pipelines), when a pig trap receiving door failed to operate correctly. 3 Two earlier incidents (in 1975 and 1979) involved pipeline repairs that resulted in fatal explosions.4 Table 2-3 tabulates these deaths and injuries.
All of the deaths and injuries are associated with gas or gas condensate lines, which operate under pressure—often very high pressures—and can be violently explosive.
Pollution
The offshore oil and gas industry accidents and incidents produce surprisingly little pollution, compared with several other causes and sources noted earlier. Worldwide, offshore production accounts for about 1.6 percent of the oil released into the oceans by human activities (National Research Council, 1985). Failures of transmission and production pipelines are responsible for about 98 percent of the accidental releases from off-shore production activities in U.S. waters, by volume (Alvarado et al., 1992). 5
While corrosion is the most commonly reported cause of pipeline failures, it rarely results in large spills. Between 1967 and 1990, more than 95 percent of the pollution from pipelines on the OCS was due to maritime activities, which tend to produce much larger spills (Figure 2-2). And more than 95 percent of the pollution from maritime activities (90 percent of all marine pipeline spills, by volume) was due to anchor damage, as shown in Table 2-4. (A single 160,000-barrel spill in 1967, caused by an anchor drag, accounted for nearly two-thirds of all the pipeline spills in the Gulf OCS, by volume.)
Although some of the anchor damage has been attributed to supply vessels servicing platforms, the data do not permit comparing the anchor damage from vessels performing services for platforms with that from vessels more distant from platforms, which could be attributed to general maritime traffic. This information would be helpful in determining
|
3 |
A pig trap is a fitting attached to a pipeline to launch or receive a pig (an internal cleaning, batch separating, or inspection device). |
|
4 |
The 1988 Piper Alpha disaster in the North Sea, which killed 167, should be kept in mind. In that event, an offshore platform was destroyed in a fire fed by gas from a connecting pipeline. Property damage came to $3 billion (Cullen, 1990; Paté-Cornell, 1993). |
|
5 |
The term “offshore production activities” includes not only drilling and production, but also pipelines and supporting services. It does not include transportation by tanker or barge. |
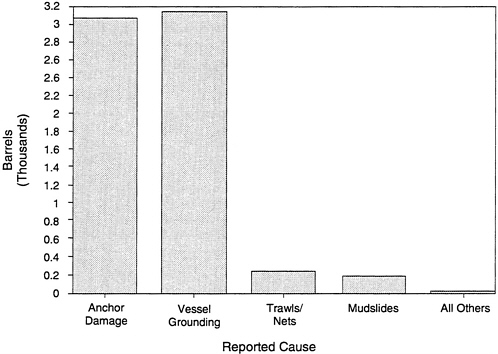
FIGURE 2-2 Average pollution amount per incident, by reported cause of failure.
TABLE 2-4 Pollution from marine pipelines, by reported cause of failures. 1967-90
|
Cause |
Number of incidents |
Pollution volume (bbl) |
Average pollution per event (bbl) |
|
Corrosion, total |
456 |
5,882 |
13 |
|
External |
186 |
105 |
< 1 |
|
Internal |
115 |
5,649 |
49 |
|
Not designated |
155 |
128 |
< 1 |
|
Maritime activities, total |
124 |
241,345 |
1,946 |
|
Anchor damage |
77 |
230,357 |
2,992 |
|
Vessel grounding |
2 |
6,330 |
3,165 |
|
Trawls, nets |
19 |
4,504 |
237 |
|
Other |
28 |
157 |
6 |
|
Natural forces, total |
106 |
3,930 |
37 |
|
Mudslides |
20 |
3,886 |
194 |
|
Storms and other |
80 |
44 |
< 1 |
|
Other or unknown |
230 |
2,886 |
13 |
|
Source: Woodson (1991) |
|||
to what extent anchoring precautions or mooring systems at platforms would help reduce pollution.
The distribution of spill sizes is also important, because large spills are disproportionately likely to do significant environmental damage. On the Gulf of Mexico OCS, from 1967 to 1987, more than 80 percent of the pipeline spills were of 10 barrels or less, as shown in Figure 2-3 (Mandke, 1990). Only 20 pipeline spills between 1971 and 1990 on the OCS exceeded 50 barrels (Minerals Management Service, 1991, p. 9).
In the Woodson data base, the four largest spills—all caused by anchor damage, and totaling 211,047 barrels—accounted for 85 percent of the volume of pollution from pipelines. The top 11—all but one of them caused by maritime activities and natural forces— produced 98 percent of the pollution. The remaining 1,036 pipeline failures were responsible for only 2 percent of the pollution, averaging just 5 barrels per failure.
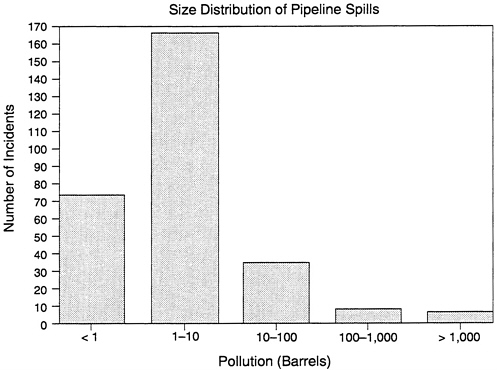
FIGURE 2-3 Size distribution of pipeline spills, 1967–1987 (Mandke, 1990).
Corrosion releases average less than 13 barrels, according to Woodson 's data. (In fact, if one excludes a single 5,000-barrel release in 1973, attributed to internal corrosion, the average is more nearly 2 barrels.)
Economic Costs
The economic costs of individual pipeline failures, in terms of property damage, repairs, lost revenues, and deferred production, are hard to estimate from the pipeline failure data base. As noted earlier, the data base includes mainly preliminary estimates of property damage, which are highly unreliable, and often incomplete. However, the experience of Hurricane Andrew, in September 1992, suggests that large-scale disruptions of the marine pipeline network can be devastating. That storm shut in production for weeks in a large part of the Gulf of Mexico, damaging 393 pipeline segments, of which only 219 had been returned to service by the following March (personal communication, E. P. Danenberger, Minerals Management Service, May 13, 1993). (Some of the reduction in numbers is due to the fact that many segments were rerouted and reconnected to other segments in the same systems because intermediate platforms were destroyed.) While the safety and environmental consequences were minor (no deaths or injuries, about 2,000 barrels of pollution, 1,000 barrels of which were recovered), the repair costs, loss of production and pipeline revenue, and interruption of national energy supplies were heavy. The consequences were contained by the industry's longstanding practice of shutting down platforms and isolating pipelines on the approach of a severe storm.
Such disruptions, whether they take place—like Andrew's—over a few weeks and months or over years of slow deterioration caused by inadequate maintenance, must be avoided.
FINDINGS
Analysis of incidents involving marine pipelines is extremely difficult, owing to the inconsistency of data collection by the various federal and state agencies with safety jurisdiction, and the lack of a shared focus on safety planning in data collection. Only for
the outer continental shelf are there any organized data on offshore pipelines. In particular, data are insufficient to establish relations between (a) corrosion and pipeline length of service, (b) anchor damage due to supply vessels working at platforms and that from other vessels, remote from platforms, (c) corrosion and the product carried, or (d) corrosion and location along the pipeline (on the riser, at the riser bend, or on the seabed).
However, analysis of the 1,047-incident Woodson (1991) data base does yield some important patterns:
-
Corrosion, although it was the reported cause of nearly half of OCS pipeline failures from 1967 to 1990, produced only about 2 percent of the pollution from pipelines and no deaths, injuries, or damage to the property of third parties.
-
Damage from vessels (and especially from anchors and groundings) is dramatically more significant as a source of pollution and other consequences, including deaths and injuries. Anchor damage alone accounts for more than 90 percent of the pipeline-related pollution on the Gulf OCS.
-
A few incidents have resulted in the majority of consequences for public safety and the environment:
-
The 4 largest pipeline spills, all caused by anchor damage, accounted for 85 percent of the pollution from pipelines on the Gulf OCS between 1967 and 1990. The largest 11, all but one caused by vessels, produced 98 percent.
-
Six accidents (two vessel groundings and four repair activities) have resulted in all of the deaths and injuries.
-
Better efforts must be made to collect and assemble safety data. In the meantime, risk analysts must use the data that is already available.
REFERENCES
Alvarado, A. P., C. W. Anderson, and P.R. Schneider. 1992. A Minerals Management perspective on detection of leaks in offshore pipelines. Pipeline Leak Detection: Government, Industry Technology, A Unique Perspective. Seminar on Pipeline Leak Detection. Houston, Texas. October 5–6. 1(48). ASME. New York, New York.
Bea, R. G. 1992. Personal communication. University of California at Berkeley.
Broussard, L. 1992. Presentation to Committee on Safety of Marine Pipelines. December 2. Houston, Texas.
Cullen, the Honorable Lord. 1990. The Public Enquiry into the Piper Alpha Disaster. Report to the Parliament by the Secretary of State for Energy by Command of Her Majesty. London. November.
Danenberger, E. P. 1993. Personal communication. Minerals Management Service. May 13.
Donnell, B. 1992. Letter to the Marine Board of the NRC. October 1.
MacDonald, I. R., et al. 1993. Natural oil slicks in the Gulf of Mexico visits from space. Journal of Geophysical Research. 89(C9): 16, 351–364.
Mandke, J. S. 1990. Corrosion causes most pipeline failures in Gulf of Mexico. Oil and Gas Journal . October 29. pp. 40–44.
Minerals Management Service. 1991. Oil Spills 1971–1990: Statistical Report. U.S. Department of the Interior. MMS 91-0088. Herndon, Virginia. March.
Minerals Management Service. 1992. Accidents Associated with Oil and Gas Operations: Outer Continental Shelf. 1956–1990. MMS 92-0058. Herndon, Virginia. October.
National Research Council. 1985. Oil in the Sea—Inputs, Fates, and Effects. Washington, D.C.: National Academy Press.
National Transportation Safety Board. 1990. Pipeline Accident Report. The F/V Northumberland and Rupture of a Natural Gas Transmission Pipeline in the Gulf of Mexico Near Sabine Pass, Texas. October 3. Report PB90-916502 NTSB/PAR-90/02. Washington, D.C.
Reifel, M. D. 1978. Storm related damage to pipelines, Gulf of Mexico. Pipelines in Adverse Environments. New York: American Society of Civil Engineers.
U.S. Department of Transportation. 1989. Accident Report, Southern Natural Gas Company (Sonat), Arco South Pass 60 Baker Offshore Production Platform, Outer Continental Shelf, Gulf of Mexico. March. Washington, D.C.
Joint Task Force on Offshore Pipelines. 1990. Joint Task Force Report on Offshore Pipelines. Washington, D.C.: U.S. Department of Transportation, Research and Special Programs Administration.
Woodson, R. D. 1991. A Critical Review of Offshore Pipeline Failures. Prepared for Marine Board, National Research Council. December.


