
3
Risk Analysis: Hazards and Zonation
The lack of consistent and comprehensive data on the safety record of offshore pipelines is a severe challenge for safety planning. Yet modern risk analysis techniques can help make sense of the data, using inferences guided by expert opinions and physical models of the nature of the risks and their distributions in location and time. Risk analysis involves identification of failure scenarios, computation of probabilities for accidents or failures for each scenario, and assessment of the consequences of a failure or accident. Use of this techniques enables industry and its regulators to set risk management priorities more rationally, more cost-effectively, and more consistently. This chapter describes the broad structure of a quantitative approach —a mathematical model—that embodies those techniques.
Risk analysis, generally, is the science of estimating risks, so that priorities for their management can be developed. This analysis can provide information fundamental to the formulation of risk management strategies for industry, as well as the federal and state government agencies that have jurisdiction over the enforcement of pipeline safety regulations. The use of risk analysis results for risk management purposes permits identification of high-risk situations and assessment of their evolutions caused, for example, by variations in vessel traffic or by shoreline erosion. Risk levels, in turn, affect the needs for safety measures, including the frequency and extent of pipeline inspection, the depth of burial, and the need for resurveying pipeline locations.
In policy making, risk analysis provides guidance in developing and promulgating regulations, implementing public laws, establishing right-of-way corridors for pipelines, or formulating requirements for the design of pipelines, such as the capability for handling internal inspection devices. Occasionally, it may also be necessary to modify existing regulations about pipeline design, location, depth of burial, and other parameters based on physical changes that modify the risk patterns (including, as mentioned above, shoreline erosion and changes in the vessel traffic). These changes would appear in the long-term process of gathering data for a regular estimation and updating of the risks. New regulations guided by the risk analysis results need not be more restrictive, but they will be better targeted. Indeed, they should be more flexible to reflect the variations in the values of risk parameters such as water depth and pipeline density along the selected coastal zones.
In industry, risk analysis can support routine choices of resource allocations (e.g., inspector assignments, aircraft or helicopter inspection overflights, resurveys of lines, and frequency of internal pipeline inspections). While pipeline regulations establish general requirements, industry keeps some latitude to operate within the regulatory range. Based on the data base generated by risk analysis and regularly updated, the operators can set priorities that should allow more cost-effective risk management both at the policy and the industry level.
The objective of risk analysis is to focus the data and information that is available or readily attainable to make decisions about using resources in the most effective way to enhance pipeline safety. It is technically and economically impossible to reduce to zero the risks to individuals and to property, no matter how much government and industry are willing to spend. Yet an acceptable level of individual safety must be provided to vessel crews and platform workers, and the risk of marine pollution must be evaluated and controlled. Many potential safety measures can be considered, such as making more accurate maps of existing pipelines, burying exposed pipelines, inspecting and maintaining pipelines, and protecting pipelines against corrosion. In addition to technical measures, organizational measures can be considered, such as streamlining the regulatory system to make risk management strategies more coherent and cost-effective. None of these measures is 100 percent effective, and most are costly. Thus, a reasonable objective is to optimize the allocation of the current resources to obtain maximum safety, or to reach a specified safety target at minimal cost. The following questions then must be addressed:
-
What is the current risk in the different areas?
-
What can be done, and with what prospect for risk reduction?
-
What are the costs of these measures?
-
When can one consider that an acceptable safety level has been achieved?
This chapter outlines a risk analysis approach designed to compute the initial risk and the risk reduction benefits of safety measures. It also contains a set of safety goals for the management of marine pipelines. In both cases, data must be gathered and objectives specified by the agencies and the industry. Calculation of the risk involves both the probabilities and the consequences of different types of accidents in different geographic zones. The different dimensions of the risk results include a variety of consequences, expressed as the probability of human casualties, the amount of oil spilled (and the consequent environmental damage), and the property damage to pipeline owners and others. The risk reduction benefits can then be estimated for different options by computing the differences of the expected values of these consequences with and without the proposed measures.
The risk analysis model described here is a prototype, intended to be developed further. It involves five categories of accident or incident initiators (“initiating events”):
-
A vessel's hitting an exposed pipeline;
-
A vessel operator's dropping or dragging an object such as an anchor or a heavy tool on a pipeline;
-
A pipeline's leaking because of corrosion
-
A pipeline damaged by the forces of waves and disturbance of the sea floor in storms and hurricanes; and
-
A pipe failure at the interface between platform and pipeline, caused either by overload (e.g., excessive internal pressures) or reduced strength (equipment deterioration).1
The probabilities and severities of incidents of the last category depend largely on the equipment and the mode of operation of each platform. This chapter focuses mainly on the first four accident types. In the risk analysis model, the last category (pipe failure at the site of a platform riser connection) is treated separately for each individual platform or type of platform, assuming that a probabilistic risk analysis has been performed for the platform/pipeline system.
The risk analysis model is designed mainly for the Gulf of Mexico. Clearly, the risk is higher in some areas of the Gulf than in others. The high-risk areas include zones of high density of pipelines, of high density of vessel traffic, of shallow waters where fishing vessels can collide with live gas pipelines, and the immediate vicinity of platforms. In addition, one may want to consider other types of regions, such as zones of severe erosion and shift of the sea floor, and zones that are most likely to be affected by hurricanes and storms. For simplicity it is assumed in this chapter that these phenomena affect the Gulf in a fairly uniform way and, therefore, do not require separate partitions. In fact, these risk factors can vary substantially from place to place. For example, seafloor shifts are more likely to occur in certain areas, such as those with steeper slopes or soft soil deposits at the mouth of the Mississippi River. The assumption of uniformity that is made here can be easily relaxed.
The risk analysis model thus relies on a zonation of the Gulf region by superposition of three maps: a map of water depth also showing the limits of the outer continental shelf (OCS), a map of vessel traffic densities, and a map of pipeline densities. In further development of the model, other types of zones may be added, such as areas of extremely weak sediments that are subject to fluidization when agitated, or additional navigation zones based on the drafts of different types of vessels. The result of this superposition is a finer partition of the region into “min-zones” defined by the local values of these three parameters. An alternative approach would be to compute the risk per mile of pipeline; but the risk posed by different segments of the same pipeline is not uniform because it depends, for example, on vessel traffic. The zonation approach was therefore preferred.
There is no need for a different set of safety regulations for each zone. Yet, some zones require higher safety levels than others, for example, because the vessel traffic density is higher there than elsewhere. The objective of this zonation-based risk analysis is to set priorities, first among zones according to their characteristics (e.g., vessel traffic density), and second among failure modes according to the relative risks involved and the costs of reducing them. For instance, it might become evident that further investment in corrosion protection may not be as cost-effective as other measures such as provision of moorings at platforms.
The use of risk analysis models based on zonation has proved useful in other cases to set priorities in risk management. For example, a risk-based zonation of the United States supports the seismic provisions of building codes (Applied Technology Council, 1982; Federal Emergency Management Agency, 1986; International Conference of Building Officials, 1982). These provisions are more stringent in California than in other regions
|
1 |
Because codes and standards differ on whether the interface is at the top or bottom of the pipeline riser, this interface should be consistently defined to eliminate confusion in estimating risk. |
of the United States. The benefits of these regulations were clear in the 1989 Loma Prieta earthquake where the losses, although tragic, were certainly lower than if the same earthquake had occurred in some other parts of the country. Another recent example, is the development, for NASA, of a risk analysis model of the heat shield of the space shuttle designed to compute the risk-criticality of the black tiles and to set priorities in maintenance operations (Paté-Cornell and Fischbeck, 1993a, 1993b). In that case, the surface of the orbiter was divided according to the density of debris that hit the tiles, the loads of heat and aerodynamic forces, and the criticality of the subsystems under the skin. The results showed that 85 percent of the risk was associated with 15 percent of the tiles. Priorities were set based on risk-criticality, and the recommendations were implemented to reduce the risk of loss of an orbiter.
DEVELOPING A PROTOTYPE MODEL: DECISION VARIABLES AND CRITERIA
Decisions
The risk analysis model outlined in this chapter is designed to support decisions among risk management measures. These decisions are closely linked to the geographic zonation of the area of concern:
-
Where to survey the pipelines. Surveying the entire Gulf is not the most efficient way to allocate limited resources and efforts. For example, it is more important for fishing vessels to know the locations of the live, exposed gas pipelines in shallow waters than elsewhere.
-
Where to request inspection of a known pipeline (by what means and how often). Inspection is costly: divers as well as the use of inspection equipment are expensive and inspection operations may require interruption of production. The structural integrity of some pipelines is easier to establish than that of others. The consequences of oil spills also vary geographically because leaks from pipelines of large diameters close to the coastline are generally viewed as more damaging to the environment.
-
What repairs and other risk reduction measures to require for existing pipelines,given inspection results showing problems. For example, when corrosion problems are indicated, which should be fixed, how, and how soon?
Because the location of the pipelines contributes to the possibility of damage, it affects the benefits of risk reduction measures:
-
Should old, empty pipelines be removed, and where? The risks of human casualties are generally associated with live pipelines. The question is whether the possibility of property damage from collisions of fishing vessels with abandoned pipelines justifies their removal.
-
What preventive measures should be required for existing pipelines and for newpipelines?
Regulations require burying exposed pipelines in shallow waters. Buried pipelines, however, become exposed when currents and storms cause erosion of the sea floor. Burying pipelines at a depth of three feet (generally the minimum standard for waters less than 200 feet deep) may be insufficient in soft soils where a greater depth may be
desirable to avoid vessel collisions. The decision must be made based on the increments of costs and risk-reduction benefits of each additional foot of burial depth.
-
Should warning devices be required on fishing vessels and other boats when thesedevices become available? It may be possible, for example, to develop devices capable of detecting a pipe's metallic mass with sufficient distance and accuracy to allow a slow fishing boat to turn and avoid frontal collision with an exposed pipeline.
-
What safety measures (procedures or equipment modification) should be requiredat the interface between pipelines and platforms? Systems for isolating platforms from pipelines in case of serious platform emergencies have proven to be important safety features that should be located in such a way that they can be easily maintained and quickly or automatically activated in case of emergency.
Decision Criteria and Relevant Outcomes
The chosen outputs of the risk analysis model depend on the structure of the decision criteria (the maximum acceptable individual risk, the cost-benefit criterion when applicable, etc.). The corresponding risk characteristics relevant to the evaluation of different safety policies are the following:
-
The overall probabilities of at least one casualty per year in different areas, and the maximum individual risk (annual probability of death) per individual exposed. This result allows ensuring basic individual safety (for example, a maximum individual risk of 10−4 or 10−5 per year, two or three orders of magnitude less than the probability of deaths per year for the population as a whole).
-
The mean volume of oil spilled per year. This result allows checking that a criterion of acceptability (which may vary with the distance to the shore or other factors) is met. One important issue is the potential for environmental pollution. If pollution to the shore and wetlands is considered more serious than pollution at sea, one relevant result is the proportion of spilled oil that reaches the shore.
-
The monetary damage due to collisions of vessels with empty or live pipelines. Other possible losses include damage to fishing nets and trawls.
-
The repair costs of corrosion pits in pipelines (which can be decreased by corrosion prevention measures).
-
The costs of the proposed risk reduction measures.
STRUCTURE OF THE RISK ANALYSIS MODEL (ZONATION)
The risk analysis approach for the area of interest (in this example, mainly off the coasts of Louisiana and Texas) is based on a zonation of the region according to the three parameters mentioned above: water depth, vessel traffic density, and pipeline density. These parameters determine the variation of the risks from place to place. The values of each parameter are divided into a few discrete ranges. The geographic area is then partitioned into minimal zones (“min-zones ”), each characterized by the local values of the three parameters. Each min-zone (index i), is characterized by:
-
the surface area in square miles;
-
the density of pipelines indexed by j (1, 2, or 3) and, possibly, specific distribu-
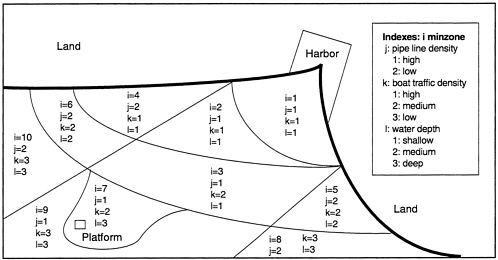
FIGURE 3-1 Partition of a hypothetical area according to water depth, pipeline density, and boat traffic density
-
tions of pipe sizes, ratios of old to new and inactive to live pipelines, as well as the proportion of those carrying gas versus oil or condensate (unless these characteristics are considered geographically uniform);
-
the density of vessel traffic, indexed by k (1, 2, or 3), and possibly the types of vessels if there are significant differences in drafts;
-
the water depth indexed by l (1, 2, or 3); and
-
the number of platforms.
Figure 3-1 shows an example of such a min-zone partition for a hypothetical region.2 A harbor is shown, to illustrate variation in vessel traffic density. (Additional parameters (e.g., the relative densities of old pipelines and new ones, or the distribution of pipelines by diameter) may be added if needed, resulting in a finer division of the area into min-zones.)
The risk for each min-zone is characterized by:
-
the annual probability of at least one death in the min-zone, and the corresponding maximum individual risk (the annual probability of death in a pipeline-related accident for the most exposed individual);
-
the mean amount of spilled oil per unit of surface and per year in the min-zone; and
-
the mean annual property damage to pipelines and vessels.
|
2 |
The zonation approach allows not only computation of the risks but also assessment of the costs of risk reduction measures. Many operations are more expensive in deep water, where putting the emphasis on design may reduce both the risks and the need for expensive inspection, maintenance, and repair. |
The structure of the risk analysis model includes (a) initiating events (e.g., a vessel-pipeline collision) and their annual probabilities, (b) intermediate developments and their probabilities conditional on the initiating events (e.g., the probability of fire given a vessel-pipeline collision), and (c) the consequences (generally expressed as means or mean rates) of each accident sequence.
The five initiating events (denoted “IE”) are as follows:
-
For “offsite” pipelines (not in the immediate vicinity of platforms):
-
IEa A vessel hits an exposed pipeline, a class of accidents that can lead to human casualties,
-
IEb A vessel operator drops or drags an anchor or other object causing a breach in a pipeline,
-
IEc A pipeline leaks due to corrosion, either at the site of a flange or in a pipe section (excluding the interface with platforms), and
-
IEd A pipeline breaks and/or leaks due to damage caused by storms and hurricanes;
-
-
For pipelines at platforms:
-
IEe A pipeline fails at the interface with a platform due to excessive loads such as shocks or high internal pressures, and/or to reduced capacity due to a weakness of the equipment.
-
These five types of initiating events can be considered mutually exclusive. Their probabilities are defined for each min-zone as functions of the information shown in Figure 3-1 : water depth and the densities of vessel traffic and pipelines. The risks associated with each initiating event can then be computed and summed over all accident types and all min-zones to assess the overall risk in the Gulf.
In general, the model can be made either simpler or more detailed, depending on the information needed. (The model's structure is outlined more thoroughly in Appendix E, along with details of the equations used.)
Choosing the Model's Complexity
The model outlined here is intentionally simple, and its structure is determined by the choice of the five initiating events described above. It represents a framework in which the values of several variables can be determined by the results of other models. Several key assumptions can be reexamined. First, mean values are used to replace full distributions of most random variables; some decision makers may want more detailed computations. Second, many of the probabilities of failures that are described here as input data can be obtained as results of classical reliability computations involving estimations of loads and capacities. Third, statistical data do not exist for some of the random variables, so that expert opinions are needed to do the analysis (for example, to assess the mean number of incident occurrences given the number on incident reports). In some cases, experiments can be performed to assess physical factors such as the rate of deterioration of a pipeline under specified circumstances. Fourth, some of the simplifying assumptions, such as a uniform ratio of different pipeline diameters or the independence of the differ-
ent failure modes, may need to be reexamined (for example, to account for differences among operators in their degree of compliance with existing regulations or their inspection and maintenance policies).
The most difficult task will probably be the analysis of the risks at the site of platforms because the initiating events of accident sequences are numerous, and the systems are complex and different. Again, the choice of a level of analytical aggregation is determined by the resources available and the precision needed for the assessment of different safety policies. The intent of this chapter is to provide the general framework of a risk analysis model. Each variable can be analyzed further according to the circumstances.
Modeling Change Over Time
The approach presented here provides a means of deriving a snapshot of the situation. It does not account for the trends that will affect pipeline performance in the future. These trends can be included in the model by replacing simple values of the deterministic variables by functions of time, and random variables by stochastic processes (representing probabilities). At present, the trends include the following:
-
Some of the facilities are aging (and presumably, deteriorating). At the same time, new facilities are installed with better technologies, such as improvements in anode protection and inspection facilities.
-
New regulations, as they are enacted, tend to reduce the risks if properly implemented.
-
At the same time, there is a significant rate of abandonment of pipelines (but it is smaller than the rate of abandonment of platforms).
In this simplified model, the length of service of a pipeline affects mainly two of the five identified failure modes: corrosion and pipe failure at the site of a platform. Although corrosion seems to occur at the same rate on old and new pipelines, its cumulative effects over time make older pipelines more vulnerable in the long run. Fatigue and repeated exposure to wave loads may also reduce the capacity of the pipelines to withstand hurricanes and storms.
All the dynamic effects listed above can be included in the model. This requires, at the minimum, an evaluation of the rates at which these phenomena are occurring. These rates of evolution, however, may not be constant, so that past statistics may offer only limited information. In the long term, evolution may be driven by external variables, such as the future price of petroleum on the world market, or the design and implementation of new government policies. Uncertainties about such future variables can only be described by expert opinions.
DATA SETS AND BIASES
As reported in Chapter 2, there are several data sets containing records of past pipeline failures, accidents, and oil spills. They are managed by different agencies, with little interagency coordination. These data bases cannot be used directly, because they are incomplete and contain substantial but unknown biases.
“De-biasing” such a data set requires assessing, for each category of events, the probability of incidents being reported, then inferring from the reports the likely actual
rates of events per year and per category. The probability that an event of a given type in a given period was actually reported depends on the reporting process at that time, the incentives to report, and the probability and consequences of discovering an unreported event. This problem is similar to that of assessing the magnitude of a medical or a social problem based on reported cases when there are reasons to believe that some cases are not reported. The probabilities of events being reported, given that they have occurred, are best estimated by expert opinions. Even though expert opinions seem less reliable than so-called hard statistics, they may be more accurate.
Furthermore, the factors affecting pipeline failures are not constant. The probabilities of the different failure types are changing, and only experts can attempt to predict what they might be in the future under different scenarios. Therefore, when using the available data, the rates of changes (deterioration as well as improvement) must be incorporated in the analysis to allow predicting the effects of proposed safety measures.
Obviously, in the end, the risk analysis results will be only as good as the input data. As is almost always the case in risk analysis, the data needed for the computations outlined in this chapter and in Appendix E come from three sources:
-
statistics from past reported incidents;
-
physical models (involving vessel drafts, water depth, vessel speeds, corrosion mechanisms, etc.); and
-
expert opinions (subjective assessments of probabilities based on experience).
One important source of information that needs gathering and exploiting whenever possible are data about minor incidents (such as contact with a pipeline that does not result in failure), because they enrich the small information base about rare events such as severe accidents. 3
ESTABLISHING SAFETY GOALS
The risk analysis results could be used to support two kinds of management decisions: regulatory decisions (e.g., whether requirements for the removal of abandoned pipelines are warranted) and private decisions of the oil companies (e.g., the frequency of inspection and the technology to be used). Cost-benefit analysis can be used for these decisions, but only after a certain level of safety has been ensured for people who spend much of their lives on fishing vessels, supply and service boats, or platforms. What follows is a set of numerical safety goals based on a survey of current practices in the United States and abroad, and recently presented at a workshop of the Department of Energy (Paté-Cornell, 1992).
It is important to emphasize that zero risk is unachievable. Balancing costs and risk reduction requires finding an acceptable balance between economic efficiency and equity. Equity requires that all individuals be granted equal protection against risks inflicted on them by others. Therefore, a basic individual safety level must first be provided everywhere. Once this safety level has been ensured, additional safety measures may be
|
3 |
In the first implementation of the model, there will be considerable uncertainties about the inputs. A first run can simply be based on means (e.g., of future frequencies of incidents derived from past incidents and expert opinions), as described in Appendix E. Uncertainties can be introduced in the analysis if desired, and described by probability distributions for these variables. Existing software allows computing the effect of these uncertainties on the risk results. |
required in zones of high vessel traffic density and/or high pipeline density on a cost-benefit basis. Economic efficiency requires placing a ceiling on these additional safety expenditures per capita in the considered range of individual risks. Below a certain level of individual risk, no further safety measure is necessary because the benefits are negligible to the individuals concerned.
Economic efficiency is desirable to ensure the maximum risk-reduction benefit for a given safety expenditure. At some point, however, from the individual point of view, resources are better spent to increase investment and consumption (which can increase both longevity and quality of life) than for further risk reduction. Investing more resources to reduce low risks thus becomes counterproductive beyond a certain level of costs, even if one restricts the objectives to issues of individual safety and welfare. This maximum expense per capita to eliminate a low individual risk (divided by the risk magnitude) is sometimes referred to as “the value of life.” For example, spending $2 per capita to eliminate a risk of 10−6 per year is sometimes referred to as a $2 million “value of life”. Here, the relevant figure is this $2 “cost of human safety,” i.e., an amount spent to eliminate an individual risk in the range of 10−6 per year.
Equity considerations require that no individual should be exposed to an excessive risk for reasons of economic efficiency; therefore, society may want to sacrifice some economic efficiency to achieve a more balanced allocation of risks. The proposed criteria thus include an upper bound, above which the risk to an individual is simply unacceptable and must be reduced or eliminated if at all feasible, regardless of the costs. It is only below this threshold that cost-benefit analysis is relevant.
Finally, there is a risk level that is so low as to be below regulatory or legal concern (“deminimis”) simply because, in that lower range, the benefits of risk reduction are so small as to be negligible to the individual. Investing in risk management in this domain is wasteful, because it would divert attention and resources from more beneficial risk reduction measures.
In any case, an acceptable risk is not found simply by applying numerical criteria. It is instead the product of an acceptable decision process, in which risk analysis results and numerical safety goals are only parts of a larger context. For example, “voluntariness” and “informed consent” are key elements of the acceptability of risk. Therefore, it generally makes sense to require more stringent risk limits for the public than for workers of the oil and gas industry, who are presumably informed and compensated and assume the risks voluntarily. Obviously, this fact implies a responsibility of firms to inform workers of the risks they face.
Based on these principles and on the targets that have emerged in recent years from the safety debate (Paté-Cornell, 1992, 1994), the following risk strategy would be appropriate for marine pipelines:
-
First, basic requirements and traditions of the best segments of the oil and gas industry should generally be satisfied; for example, proper inspection and maintenance, prompt reporting of incidents and spills, and prompt reaction to spill reports.
-
Beyond that, safety measures should be adopted so that no member of the public, including those on fishing boats, or other vessels, is exposed to an individual risk greater than a threshold, for example, 10−4 or 10−5 per year of exposure (one objective being to reach this goal at minimum cost).
-
Beyond that, further risk reduction measures should be adopted if they cost less than a specified “cost of human safety,” for example, $20 per person per year to eliminate
-
a risk of 10−5 per year (cost-benefit criterion) or $2 per person per year for a risk of 10−6 (a criterion sometimes referred to as “$2 million per life”).
-
Finally, a de minimis individual risk threshold can be set, for example, at 10−7 per year per person.
In addition, cost-benefit criteria can be used to evaluate environmental protection measures. There is, however, no established criterion for assessing the benefits of environmental protection, and no observable consistency in the public's willingness to pay for a given level of protection.
It could well be that, for marine pipelines, the de minimis level is currently achieved. If this is the case, the model could suggest which improvements should be considered next if one wanted to provide still higher safety levels.
Again, these figures are not meant to represent universally acceptable risks; they are targets rather than absolute criteria. Precedents and economic arguments suggest, for example, that some of these targets could be relaxed by up to an order of magnitude for older pipelines that are not expected to be in service much longer. The risk analysis results and the safety targets are inputs into a joint decision process of the agencies and the oil and gas industry, which could lead to improvements in safety.
Some safety measures reduce both the risk to human life and the expected value of property damage. In this case, the reduction of the financial loss can simply be subtracted from the costs before doing a cost-benefit analysis based on human safety (in the range of individual risk such an analysis where is appropriate, as noted earlier in this chapter). Other safety measures decrease only property damage and should be adopted on a simple cost-benefit analysis basis. The risk analysis model allows computing the risk-reduction benefits by comparing the expected values of the losses with and without the proposed measures. When the options involve a continuous range (e.g., in determining the appropriate depth of burial of pipelines in shallow waters), such an analysis should be based on incremental costs and incremental benefits. In all cases, an appropriate discount rate should be used to account for the time value of money over the remaining expected lifetime of the equipment.
FINDINGS
Use of the risk analysis approach outlined in this chapter can help decision makers in industry and regulatory agencies identify the most risk-critical zones of the Gulf of Mexico for marine pipelines. They can then adapt their risk management strategies to the local conditions while providing a basic level of safety everywhere. Extensions of the model to the immediate vicinity of the platforms can also help the regulatory agencies to identify weaknesses in the components of the pipeline-platform interface and to choose appropriate and economical safety measures.
Risk analysis is a management tool applicable to both strategic planning and administration by industry, and policy making by federal and state governments. The risk analysis approach to safety standards for marine pipeline zones and safety decision support can be useful in the development and implementation of routine risk management activities. It permits setting priorities and improving cost-effectiveness in resource allocation, for example for inspection operation, the resurvey of pipelines, and decisions about rights-of-way for new construction.
The dispersion of the regulatory authorities and of the information gathering systems complicates greatly the risk management task. A common data gathering policy would
permit merging reports from all sources in a single data base and would provide a clearer picture of the current situation and trends. Furthermore, a unified risk management strategy among the agencies would allow more consistency and cost-effectiveness while simplifying the task of industry operators.
To place marine pipeline safety priorities on a firm basis, it is necessary that data be gathered in a consistent format by the responsible agencies, stored in a central data base, and used in a risk analysis model based on the zonation approach presented in this chapter.
REFERENCES
Applied Technology Council. 1982. Tentative Provisions for the Development of Seismic Regulations for Buildings. ATC-3-06, NBS SP 510, NSF 78-8. Gaithersburg, Maryland: National Bureau of Standards.
Cullen, The Honorable Lord. 1990. The Public Enquiry into the Piper Alpha Disaster. Report to the Parliament by the Secretary of State for Energy by Command of Her Majesty. November.
Federal Emergency Management Agency. 1986. NEHRP Recommended Provisions for the Development of Seismic Regulations for New Buildings, Part 3. FEMA 97. February.
International Conference of Building Officials. 1982. Uniform Building Code. Whittier, California.
Mandke, J. S. 1990. Corrosion causes most pipeline failures in Gulf of Mexico. Oil and Gas Journal. October 29. pp. 40–44.
Morris, D. V., ed. 1991. Proceedings of the International Workshop on Offshore Pipeline Safety, New Orleans. December 4–6.
National Transportation Safety Board. 1990. Pipeline Accident Report. The F/V Northumberland and Rupture of a Natural Gas Transmission Pipeline in the Gulf of Mexico Near Sabine Pass, Texas, October 3, 1989. Report PB90-916502 NTSB/PAR-90/02. Washington, D.C.
Paté-Cornell M. E., and P. S. Fischbeck. 1993a. Probabilistic risk analysis and risk-based priority scale for the tiles of the space shuttle. Reliability Engineering and System Safety. 40: 221–238.
Paté-Cornell M. E., and P. S. Fischbeck. 1993b. PRA as a management tool: Organizational factors and risk-based priorities for the maintenance of the tiles of the space shuttle orbiter. Reliability Engineering and System Safety 40: 239–257.
Paté-Cornell, M. E. 1993. Learning from the Piper Alpha Accident. Risk Analysis 13(2): 215–232.
Paté-Cornell, M. E. 1992. Risk management for existing energy facilities: A global approach to numerical safety goals. Proceedings of the DOE Workshop on the Management of Aging Facilities, Rice University, Houston, Texas. October 13.
Paté-Cornell, M. E. 1994. Quantitative Safety Goals for Risk Management of Industrial Facilities. Structural Safety 13(3): 145–157.
U.S. Department of Transportation. 1989. Accident Report, Southern Natural Gas Company (SONAT), ARCO South Pass 60 Baker Offshore Production Platform, Outer Continental Shelf, Gulf of Mexico. March 19.
Woodson, R. D. 1991. A Critical Review of Offshore Pipeline Failures. Prepared for Marine Board, National Research Council. December 1.


