
Appendix F
THE ROLE OF FOREIGN NATIONALS STUDYING OR WORKING IN U.S. UNIVERSITIES AND OTHER SECTORS
Mitchel B.Wallerstein
Staff Consultant
The number of foreign students in higher education in the United States increased substantially during the 1970s, especially at the graduate level. Underlying this trend were two major factors: (1) an increased demand for U.S. training to meet the needs of foreign nations for skilled scientific and engineering personnel, and (2) increased recruitment of foreign students by U.S. institutions to augment domestic enrollment. This trend is indicated clearly in Table 1. Enrollment of foreign students doubled during the 1970s at both the undergraduate and graduate levels, rising to almost 290,000 students in 1979.
GRADUATE TRAINING
The proportion of full-time graduate students in science and engineering (S&E) who were from foreign countries rose from 16 percent in 1974 to 20 percent in 1979. Although there was an increase in almost all S&E fields between 1974 and 1979, the growth was most dramatic in engineering and mathematical/computer sciences. Over 40 percent (16,200) of the 1979 graduate enrollment in engineering, and over 30 percent (4,300) of the enrollment in mathematical/computer sciences, consisted of foreign students (see Figure 1).
DOCTORATE PRODUCTION
Approximately 3,600 (or 1 out of every 5) S&E doctorates granted by U.S. universities in 1979 were awarded to foreign citizens. This is
The material in this appendix was derived primarily from two sources: (1) a National Science Foundation report, “Foreign participation in U.S. science and engineering higher education and labor markets” (NSF 81–316), and (2) data provided by the Commission on Human Resources of the National Research Council. Due to general nature of the data, however, it was not possible to determine the number of foreign nationals from any particular country participating in U.S. scientific and technological enterprises.
TABLE 1 Foreign Enrollment in US Institutions of Higher Education, Selected Years, 1954–1979
|
Selected Years |
All Institutions |
||
|
Total Enrollment |
Foreign Enrollment |
Foreign as a Percentage of Total |
|
|
1954 |
2,499,800 |
34,200 |
1.4 |
|
1964 |
5,320,000 |
82,000 |
1.5 |
|
1970 |
8,649,400 |
144,700 |
1.7 |
|
1975 |
11,290,700 |
179,300 |
1.6 |
|
1976 |
11,121,400 |
203,100 |
1.8 |
|
1977 |
11,415,000 |
235,500 |
2.1 |
|
1978 |
11,392,000 |
263,900 |
2.3 |
|
1979 |
11,707,100 |
286,300a |
2.4a |
|
aPreliminary. SOURCES: National Center for Education Statistics and Institute of International Education. |
|||
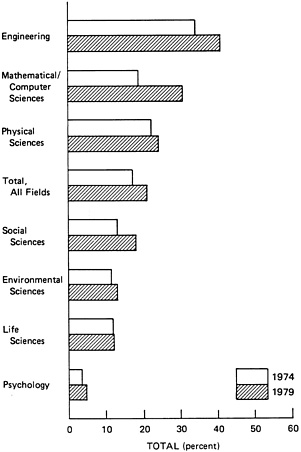
FIGURE 1 Foreign students as a percentage of full-time graduate science/engineering enrollment in doctorate-granting institutions within fields, 1974–1979.
SOURCE: National Science Foundation.
broken down by field of study in Table 2. In engineering alone, foreign nationals obtained about 1,200—or almost half—of the doctorates received by graduate students. The share of all S&E doctorates awarded to foreign nationals increased from about 15 percent in 1960 to 21 percent in 1979. Since then, it has remained relatively stable.
The large number of foreign citizens obtaining doctorates in the United States indicates the large amount of foreign interest in the high technology work underway in U.S. institutions. Foreign nationals with temporary visas received at least 20 percent of the S&E doctorates awarded in 1979 in each of more than 40 subspecialties. The largest percentages were in fuel technology/petroleum engineering (76 percent) and agricultural engineering (50 percent).
Table 3 lists the ten leading U.S. institutions that granted doctorates to foreign full-time graduate students. The University of California-Berkeley and M.I.T. were first and second, respectively, in both 1974 and 1979, but the other institutions on the list varied substantially during the five-year period. The top ten institutions (by size) accounted for 21 percent of all foreign graduate students in 1979, compared with 23 percent in 1974.
POSTDOCTORATES
Foreigners constituted about one-third (or almost 6,500) of the S&E postdoctorates employed in doctorate-granting institutions in 1979, down from almost one-half in 1977. Figure 2 shows that two of every three postdoctorate engineers in 1979 were foreign nationals. Similarly, about 50 percent of the postdoctorate positions in the physical sciences were held by persons with foreign citizenship. Likewise, foreign nationals held about 45 percent of the postdoctorate positions in mathematical/computer sciences. Table 4 presents a summary of the ten leading institutions for foreign S&E postdoctorate employment in 1979. These universities accounted for 27 percent of the foreigners with postdoctorates working in U.S. institutions.
CHARACTERISTICS OF EMPLOYMENT DISTRIBUTION
Data from annual surveys conducted by the National Research Council’s Commission on Human Resources paints a more detailed picture of the fields of interest and types of employment of “science/engineering Ph.D.s with foreign citizenship in the United States in 1981.” The figures presented here vary somewhat from the preceding data because they are more recent. They are also particularly noteworthy in that they encompass foreign Ph.D.s in noneducational areas of S&E employment. Table 5 indicates, for example, that while about 55 percent of the foreign Ph.D.s were employed in U.S. educational institutions of all types, about 37 percent (391 of those replying to the survey) were working in business and industry, another 2.3 percent (42 of those replying) were working for nonprofit organizations, and 1.6 percent (22 of those replying) were working for the U.S. government. Foreign
TABLE 2 Number and Percent Distribution of Ph.D. Recipients by Type of Citizenship for Selected Years
TABLE 3 Ten Leading Doctorate-Granting Institutions in Foreign Full-Time Graduate Science/Engineering Enrollment, 1979 and 1974
|
Institution |
Rank |
Number |
Percent Change |
||
|
1979 |
1974 |
1979 |
1974 |
1974–79 |
|
|
Total, all institutions |
– |
– |
44,800 |
31,700 |
41 |
|
Total, leading 10 institutions |
– |
– |
9,170 |
7,090 |
29 |
|
University of California-Berkeley |
1 |
1 |
1,239 |
1,201 |
3 |
|
Massachusetts Institute of Technology |
2 |
2 |
1,101 |
881 |
25 |
|
Ohio State University |
3 |
8 |
1,002 |
610 |
64 |
|
University of Wisconsin-Madison |
4 |
3 |
904 |
750 |
21 |
|
University of Michigan |
5 |
9 |
874 |
600 |
46 |
|
University of Illinois-Urbana |
6 |
7 |
864 |
686 |
26 |
|
Stanford University |
7 |
4 |
861 |
725 |
19 |
|
University of California-Los Angeles |
8 |
13 |
830 |
467 |
78 |
|
University of Southern California |
9 |
15 |
774 |
451 |
72 |
|
Cornell University |
10 |
5 |
722 |
711 |
2 |
|
All other institutions |
|
|
35,620 |
24,610 |
45 |
|
SOURCE: National Science Foundation. |
|||||
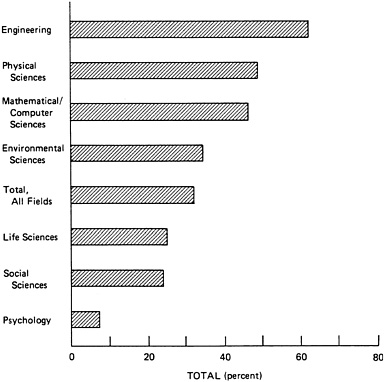
FIGURE 2 Foreign students as a percentage of total science/engineering postdoctorates in doctorate-grating institutions within fields: 1979.
SOURCE: National Science Foundation.
TABLE 4 Ten Leading Institutions in Foreign Science/Engineering Postdoctorate Employment, 1979
|
Institution |
Rank |
Number |
Percent Distribution |
|
Total, all institutions |
– |
6,080 |
100 |
|
Total, leading 10 institutions |
|
1,649 |
27 |
|
Harvard University |
1 |
297 |
5 |
|
University of California-Berkeley |
2 |
189 |
3 |
|
Stanford University |
3 |
171 |
3 |
|
Massachusetts Institute of Technology |
4 |
160 |
3 |
|
University of Wisconsin-Madison |
5 |
158 |
3 |
|
University of California-Los Angeles |
6 |
145 |
2 |
|
University of Southern California |
7 |
143 |
2 |
|
Cornell University |
8 |
139 |
2 |
|
University of California-San Francisco |
9 |
127 |
2 |
|
Yale University |
10 |
120 |
2 |
|
All other institutions |
|
4,430 |
73 |
|
SOURCE: National Science Foundation. |
|||
TABLE 5 Number of Employed Science/Engineering Ph.D.s with Foreign Citizenship in the United States in 1981 by Field of Doctorate and Type of Employer
|
1982 Type of Employer |
|
All Fields |
Field of Doctorate |
|||||
|
Mathematics |
Computer Science |
Physics |
Chemistry |
Engineering |
Bioscience |
|||
|
Employed Populationa |
N |
1,328 |
107 |
25 |
146 |
187 |
181 |
208 |
|
|
V%b |
100.0 |
100.0 |
100.0 |
100.0 |
100.0 |
100.0 |
100.0 |
|
Educational Institution |
N |
800 |
84 |
13 |
84 |
91 |
57 |
160 |
|
|
V% |
54.5 |
78.3 |
43.5 |
58.7 |
45.5 |
24.5 |
76.2 |
|
4-Year College/University/Medical School |
N |
789 |
82 |
13 |
83 |
91 |
57 |
159 |
|
V% |
54.0 |
76.1 |
43.5 |
58.6 |
45.5 |
24.5 |
76.0 |
|
|
Business/Industryc |
N |
391 |
19 |
12 |
47 |
85 |
116 |
26 |
|
|
V% |
36.8 |
18.2 |
56.5 |
32.0 |
51.7 |
71.6 |
10.1 |
|
U.S. Government |
N |
22 |
1 |
– |
3 |
1 |
– |
4 |
|
|
V% |
1.6 |
0.3 |
– |
2.6 |
0.9 |
– |
4.1 |
|
Other Nonprofit Organization |
N |
42 |
3 |
– |
8 |
4 |
4 |
4 |
|
|
V% |
2.3 |
3.2 |
– |
4.8 |
1.1 |
1.8 |
2.5 |
|
NOTE: In view of the lack of a comprehensive sampling frame for foreign-earned doctorates in the United States, few additions of segment seven cases have been made to the sample since the 1973 survey. Therefore, the number of science and engineering Ph.D.s who are foreign citizens may be somewhat underestimated. aIncludes those individuals who were full-time employed, part-time employed, or on postdoctoral appointments. bV%=Vertical percentage. cIncludes those self-employed. SOURCE: 1981 Survey of Doctorate Recipients, National Research Council. |
||||||||
TABLE 6 Number of Employed Science/Engineering Ph.D.s with Foreign Citizenship in the United States in 1981 by Selected Field of Doctorate and Primary Work Activity
|
Primary Work Activity |
|
All Fieldsa |
Field of Doctorate |
|||||
|
Mathematics |
Computer Science |
Physics |
Chemistry |
Engineering |
Bioscience |
|||
|
Totalb |
N |
1,328 |
107 |
25 |
146 |
187 |
181 |
208 |
|
|
V%c |
100.0 |
100.0 |
100.0 |
100.0 |
100.0 |
100.0 |
100.0 |
|
Research and Development |
N |
675 |
33 |
14 |
99 |
121 |
99 |
130 |
|
|
V% |
52.8 |
29.2 |
62.5 |
65.1 |
72.0 |
58.6 |
66.9 |
|
Basic Research |
N |
364 |
21 |
6 |
55 |
62 |
10 |
114 |
|
|
V% |
24.6 |
20.2 |
32.9 |
35.8 |
33.7 |
6.0 |
59.7 |
|
Applied Research |
N |
226 |
8 |
5 |
25 |
49 |
55 |
13 |
|
|
V% |
18.7 |
6.6 |
16.3 |
16.0 |
32.1 |
28.4 |
6.4 |
|
Development/Design |
N |
85 |
4 |
3 |
19 |
10 |
34 |
3 |
|
|
V% |
9.4 |
2.4 |
14.4 |
13.4 |
6.2 |
24.2 |
0.8 |
|
Management/Administration |
N |
115 |
4 |
4 |
10 |
19 |
20 |
15 |
|
|
V% |
10.3 |
3.5 |
8.8 |
6.3 |
9.6 |
12.7 |
6.7 |
|
Management of R&D |
N |
74 |
1 |
4 |
8 |
14 |
17 |
10 |
|
|
V% |
6.7 |
0.3 |
8.8 |
6.1 |
6.7 |
12.0 |
4.9 |
|
Teaching |
N |
375 |
59 |
7 |
30 |
31 |
34 |
41 |
|
|
V% |
25.3 |
54.3 |
28.7 |
22.3 |
10.9 |
14.5 |
17.4 |
|
Consulting/Professional Services |
N |
84 |
7 |
– |
4 |
3 |
19 |
12 |
|
V% |
6.3 |
7.5 |
– |
3.9 |
1.3 |
11.1 |
5.0 |
|
|
NOTE: In view of the lack of a comprehensive sampling frame for foreign-earned doctorates in the United States, few additions of segment seven cases have been made to the sample since the 1973 survey. Therefore, the number of science and engineering Ph.D.s who are foreign citizens may be somewhat underestimated. aThese figures represent more than the totals presented in the table. bIncludes those individuals who were full-time employed, part-time employed, or on postdoctoral appointments. cV%=Vertical percentage. SOURCE: 1981 Survey of Doctorate Recipients, National Research Council. |
||||||||
nationals in business and industry were heavily represented in the fields of engineering, chemistry, and physics, but were found in other fields as well. Most of those working for the U.S. government were employed in bioscience, physics, or chemistry.
In Table 6 the doctoral fields of foreign national Ph.D.s and their primary work activity are shown. Approximately 53 percent were engaged in R&D, with lesser numbers in R&D management, consulting, or teaching. The heaviest concentration of foreign national Ph.D.s working in R&D was in chemistry, followed closely by bioscience, physics, computer science, and engineering. With the exception of engineering, a larger proportion of the researchers were engaged in basic research than in applied science or development/design.
Table 7 shows foreign national Ph.D.s by type of employer and primary work activity. Here again the majority (52.8 percent, or 678, of those replying to the survey) were engaged in R&D, primarily within educational institutions (45.6 percent, or 356, of those replying) and business/industry (45.5 percent, or 250, of those replying). A majority of the foreign nationals involved in R&D in educational institutions were working in basic research, while those employed by business/industry tended to be in applied research or development/design. The table also reveals that the federal government was
TABLE 7 Employed Science/Engineering Ph.D.s with Foreign Citizenship in the United States in 1981 by Selected Type of Employer and Primary Work Activity
|
Primary Work Activity |
|
Total Employeda |
1981 Type of Employer |
||||
|
Educational Institution Total |
College/University/MedicalSchool |
Business/Industryb |
U.S. Government |
Other Nonprofit Organization |
|||
|
Totalc |
N |
1,328 |
800 |
789 |
391 |
22 |
42 |
|
|
H%d |
100.0 |
54.0 |
54.0 |
36.8 |
1.6 |
2.3 |
|
|
V%d |
100.0 |
100.0 |
100.0 |
100.0 |
100.0 |
100.0 |
|
Research and Development |
N |
675 |
356 |
355 |
250 |
16 |
24 |
|
H% |
100.0 |
45.6 |
45.6 |
45.5 |
2.3 |
2.8 |
|
|
|
V% |
52.8 |
44.2 |
44.5 |
65.2 |
77.4 |
64.7 |
|
Basic Research |
N |
364 |
280 |
280 |
37 |
13 |
18 |
|
|
H% |
100.0 |
77.1 |
77.1 |
11.7 |
3.9 |
4.4 |
|
|
V% |
24.6 |
34.9 |
35.2 |
7.9 |
62.1 |
46.4 |
|
Applied Research |
N |
226 |
71 |
70 |
136 |
3 |
5 |
|
|
H% |
100.0 |
26.7 |
26.6 |
63.7 |
1.3 |
2.1 |
|
|
V% |
18.7 |
9.2 |
9.2 |
32.4 |
15.3 |
16.8 |
|
Development Design |
N |
85 |
5 |
5 |
77 |
– |
1 |
|
|
H% |
100.0 |
0.8 |
0.8 |
97.4 |
– |
0.4 |
|
|
V% |
9.4 |
0.1 |
0.1 |
25.0 |
– |
1.4 |
|
Management/Administration |
N |
115 |
33 |
33 |
60 |
3 |
9 |
|
H% |
100.0 |
31.8 |
31.8 |
56.2 |
2.9 |
4.3 |
|
|
|
V% |
10.3 |
6.0 |
6.0 |
15.7 |
19.3 |
19.1 |
|
Management of R&D |
N |
74 |
12 |
12 |
51 |
2 |
6 |
|
|
H% |
100.0 |
10.9 |
10.9 |
78.6 |
4.4 |
4.6 |
|
|
V% |
6.7 |
1.3 |
1.3 |
14.2 |
18.7 |
13.3 |
|
Consulting/Professional Services |
N |
84 |
12 |
11 |
48 |
1 |
5 |
|
H% |
100.0 |
9.6 |
8.9 |
71.2 |
0.5 |
1.9 |
|
|
|
V% |
6.3 |
1.1 |
1.0 |
12.2 |
2.1 |
5.1 |
|
NOTE: In view of the lack of a comprehensive sampling frame for foreign-earned doctorates in the United States, few additions of segment seven cases have been made to the sample since the 1973 survey. Therefore, the number of science and engineering Ph.D.s who are foreign citizens may be somewhat underestimated. aThese figures may represent more than the totals presented in the table. bIncludes those self-employed. cIncludes those individuals who were full-time employed, part-time employed, or on postdoctoral appointments. dH%=Horizontal percentage. V%=Vertical percentage. SOURCE: 1981 Survey of Doctorate Recipients, National Research Council. |
|||||||
design. The table also reveals that the federal government was relatively insignificant as an employer of foreign national Ph.D.s, either in R&D or in the management of science and technology.
The data in Tables 8 and 9 provide a very limited indication of the involvement of foreign nationals in some of the sectors of the U.S. economy that are considered vital to U.S. national security—i.e., defense, space, and energy. In Table 8 the individual’s generic area of interest is arrayed against his/her type of employment. Those working in the defense sector accounted for only 2.9 percent (29 of those replying to the survey) of the total foreign national workforce of Ph.D.s. This was similar to the percentage of those employed in space science (2.8 percent of those replying). Within the defense sector, Ph.D.s with foreign citizenship were found exclusively in
TABLE 8 Employed Science/Engineering Ph.D.s with Foreign Citizenship in the United States in 1981 by Selected Type of Employer and Area of National Interest
|
Area of Interest |
|
Total Employeda |
1981 Type of Employer |
||||
|
Educational Institution Total |
College/University/Medical School |
Business/Industryb |
U.S. Government |
Other Nonprofit Organization |
|||
|
Total Employedc |
N |
1,328 |
800 |
789 |
391 |
22 |
42 |
|
|
H%d |
100.0 |
54.5 |
54.0 |
36.8 |
1.6 |
2.3 |
|
|
V%d |
100.0 |
100.0 |
100.0 |
100.0 |
100.0 |
100.0 |
|
Education (Not Teaching) |
N |
64 |
53 |
49 |
5 |
1 |
4 |
|
H% |
100.0 |
86.0 |
80.6 |
6.2 |
2.8 |
4.5 |
|
|
|
V% |
4.3 |
6.8 |
6.4 |
0.7 |
7.6 |
8.4 |
|
Health |
N |
273 |
193 |
193 |
37 |
5 |
7 |
|
|
H% |
100.0 |
69.0 |
69.0 |
16.8 |
2.8 |
1.3 |
|
|
V% |
16.0 |
20.3 |
20.4 |
7.3 |
28.7 |
9.2 |
|
Defense |
N |
29 |
12 |
12 |
17 |
– |
– |
|
|
H% |
100.0 |
38.3 |
38.3 |
61.7 |
– |
– |
|
|
V% |
2.9 |
2.0 |
2.0 |
4.8 |
– |
– |
|
Space |
N |
33 |
17 |
17 |
10 |
5 |
1 |
|
|
H% |
100.0 |
53.6 |
53.6 |
31.9 |
14.2 |
0.3 |
|
|
V% |
2.8 |
2.7 |
2.8 |
2.4 |
25.4 |
0.4 |
|
Energy or Fuel |
N |
119 |
49 |
49 |
63 |
– |
4 |
|
|
H% |
100.0 |
36.7 |
36.7 |
57.7 |
– |
3.2 |
|
|
V% |
12.5 |
8.4 |
8.5 |
19.6 |
– |
17.2 |
|
NOTE: In view of the lack of a comprehensive sampling frame for foreign-earned doctorates in the United States, few additions of segment seven cases have been made to the sample since the 1973 survey. Therefore, the number of science and engineering Ph.D.s who are foreign citizens may be somewhat underestimated. aThese figures may represent more than the totals presented in the table. bIncludes those self-employed. cIncludes those individuals who were full-time employed, part-time employed, or on postdoctoral appointments. dH%=Horizontal percentage. V%=Vertical percentage. SOURCE: 1981 Survey of Doctorate Recipients, National Research Council. |
|||||||
educational institutions or business/industry, similar to the pattern in space research. Finally, Table 9 shows that a majority (58.4 percent or 18) of the foreign nationals working in the defense sector were involved in R&D, primarily applied research and development/design. More than one-third were working in educational areas that are related in some way to national defense.
In sum, the data on foreign national Ph.D.s in science and engineering contain few surprises. Within certain fields, foreign citizens do constitute a significant percentage of those engaged in R&D activities in both the university and industrial sectors. At the same time, however, their presence remains inconsequential in generic areas, such as defense, which are directly related to U.S. national security. It is unfortunate that more specific data, indicating country or national origin, remain unavailable, since they would probably reveal that most foreign scientists and engineers are citizens of nonadversary countries. On the basis of the evidence presented here, however, it is apparent that the total number of foreign nationals presently in the United States is significant and, most likely, still increasing.
TABLE 9 Employed Science/Engineering Ph.D.s with Foreign Citizenship in the United States in 1981 by Selected Primary Work Activity and Area of National Interest
|
Area of Interest |
|
Totala |
Research and Development |
Management |
||||||
|
Area Total |
Basic Research |
Applied Research |
Development/Design |
Area Total |
of R&D |
Teaching |
Consulting/Professional Services |
|||
|
Total Employedb |
N |
1,328 |
675 |
364 |
226 |
85 |
115 |
74 |
375 |
84 |
|
|
H%c |
100.0 |
52.8 |
24.6 |
18.7 |
9.4 |
10.3 |
67 |
25.3 |
6.3 |
|
|
V%c |
100.0 |
100.0 |
100.0 |
100.0 |
100.0 |
100.0 |
100.0 |
100.0 |
100.0 |
|
Education (Not Teaching) |
N |
64 |
17 |
12 |
3 |
2 |
7 |
1 |
30 |
5 |
|
H% |
100.0 |
26.6 |
24.1 |
1.7 |
0.9 |
18.6 |
1.0 |
42.9 |
7.3 |
|
|
|
V% |
4.3 |
2.2 |
4.2 |
0.4 |
0.4 |
7.8 |
0.6 |
7.3 |
5.0 |
|
Health |
N |
273 |
171 |
126 |
39 |
6 |
23 |
14 |
49 |
19 |
|
|
H% |
100.0 |
68.2 |
50.4 |
12.5 |
5.3 |
7.5 |
5.3 |
15.6 |
5.9 |
|
|
V% |
16.0 |
20.7 |
32.7 |
10.7 |
9.0 |
11.8 |
12.9 |
9.8 |
15.1 |
|
Defense |
N |
29 |
18 |
3 |
10 |
5 |
1 |
1 |
8 |
2 |
|
|
H% |
100.0 |
58.4 |
6.9 |
24.4 |
27.1 |
1.3 |
1.3 |
36.0 |
4.3 |
|
|
V% |
2.9 |
3.2 |
0.8 |
3.8 |
8.3 |
0.4 |
0.6 |
4.1 |
2.0 |
|
Space |
N |
33 |
27 |
17 |
7 |
3 |
2 |
2 |
4 |
– |
|
|
H% |
100.0 |
85.7 |
47.8 |
21.0 |
16.9 |
8.2 |
8.2 |
6.1 |
– |
|
|
V% |
2.8 |
4.5 |
5.4 |
3.1 |
5.0 |
2.2 |
3.4 |
0.7 |
– |
|
Energy or Fuel |
N |
119 |
75 |
22 |
38 |
15 |
6 |
6 |
25 |
10 |
|
|
H% |
100.0 |
56.6 |
11.7 |
24.0 |
20.9 |
6.6 |
6.6 |
22.7 |
12.6 |
|
|
V% |
12.5 |
13.4 |
5.9 |
16.0 |
27.7 |
8.0 |
12.4 |
11.2 |
24.9 |
|
NOTE: In view of the lack of a comprehensive sampling frame for foreign-earned doctorates in the United States, few additions of segment seven cases have been made to the sample since the 1973 survey. Therefore, the number of science and engineering Ph.D.s who are foreign citizens may be somewhat underestimated. aThese figures may represent more than the totals presented in the table. bIncludes those individuals who were full-time employed, part-time employed, or on postdoctoral appointments. cH%=Horizontal percentage. V%=Vertical percentage. SOURCE: 1981 Survey of Doctorate Recipients, National Research Council. |
||||||||||


