
Incarceration and Violent Crime: 1965-1988
Jacqueline Cohen and José A. Canela-Cacho
Imprisonment rates in the United States changed dramatically from 1965 to 1988. Offenders in prison and incarceration rates per population first decreased during the late 1960s and have increased to record levels since the mid-1970s. Recent increases have continued unabated despite the severe pressures they have placed on strained prison capacities. For retributive as well as public protection reasons, the tendency in recent sentencing reforms has been to rely increasingly on longer and/or more certain incarceration terms.
This paper examines various aspects of the relationship between incarceration and levels of violent crime. We focus first on the nature of changes in the prison population from 1965 to 1988, particularly the role of incarceration for violent offenses in observed changes in the total prison population, and the relative contributions of sanction policies and levels of offending to changes in observed incarceration rates. We then explore the likely crime control effects of incarceration on levels of violent crime, especially
Jacqueline Cohen is at the H. John Heinz III School of Public Policy and Management, Carnegie Mellon University. José Canela-Cacho is at the Graduate School of Public Policy, University of California, Berkeley.
the appropriateness of deterrence and incapacitation strategies as means for reducing violent offending.
Throughout the analysis, we limit consideration to incarceration in state prisons—the primary site for long-term institutionalization of violent offenders—and exclude local prisons and jails. When referring to violent offenses, we include murder (which usually includes nonnegligent homicide), aggravated assault, rape, and robbery. For purposes of comparison, we also analyze burglary and drug offenses, two nonviolent offenses that figure prominently in prison populations.1 We rely primarily on annual data from 1965 to 1988 for selected states. State-level data are especially useful because they provide annual counts of both admissions to prison and resident populations disaggregated by crime type.
The analyses of prison populations are designed to answer three main questions:
-
What is the contribution of incarceration for violent crimes to the changes over time in the total prison population?
-
How have sanction policies regarding the certainty and severity of imprisonment for violent crimes changed over time?
-
What is the contribution of changing sanction policies for violent crimes to changes in the size of the prison population?
With regard to the crime control effects of incarceration, we are especially concerned with examining whether incarceration is an effective strategy for controlling violent crimes and the merits of pursuing alternative incarceration policies.
DATA
In addition to national data, we obtained corrections data from the following states: California, Florida, Michigan, New York, Pennsylvania, and Texas.2 These states were selected because they are geographically distributed in various regions of the United States, and together they comprised 38.5 percent of total prisoners under jurisdiction in state and federal institutions in 1988 (Bureau of Justice Statistics, 1990a). All of the states provided annual data on commitments to prison and average daily population (typically a one-day census of the resident inmate population) disaggregated by crime type and for the total over all crime types.3
The data for each state vary somewhat in the years covered. New York and California are the most complete, and cover the entire period from 1965 to 1988; the data for the remaining states
TABLE 1 State Corrections Data, 1965-1988: Earliest Year Available for Residents and Commitments to Prison by Crime Type
begin sometime during the 1970s and are usually more complete for commitments (see Table 1).
The data on inmates have been augmented by data on crimes reported to the police for each state available from the annual Uniform Crime Reports (UCR) published by the Federal Bureau of Investigation (FBI). We supplemented the regularly published crime data with state-level data obtained from the FBI on the numbers of total arrests and arrests of adults (age 18 or over) for each crime type for 1965 to 1988. The full data set potentially includes a maximum of 864 observations (6 states × 6 crimes × 24 years). The number of observations actually available was reduced to 723 after removing cases in which the data were obviously unreliable.4
PRISON POPULATIONS
Between 1975 and 1989 the total annual prison population of the United States grew from 240,593 to 679,263 inmates in custody, an increase of 182 percent. Certainly, some of this increase is due to increases in the general population over this period, and more particularly to increases in the size of the adult population. Nevertheless, the annual incarceration rate adjusted for total population rose 146 percent from 111.7 inmates per 100,000 population to a historical high of 274.4 over this same period, and the incarceration rate adjusted by adult population (age 18 or over) rose by 128 percent from 162.2 to 369.7 inmates per 100,000 adult population (Figure 1).5 This increase is unprecedented in recent U.S. history,
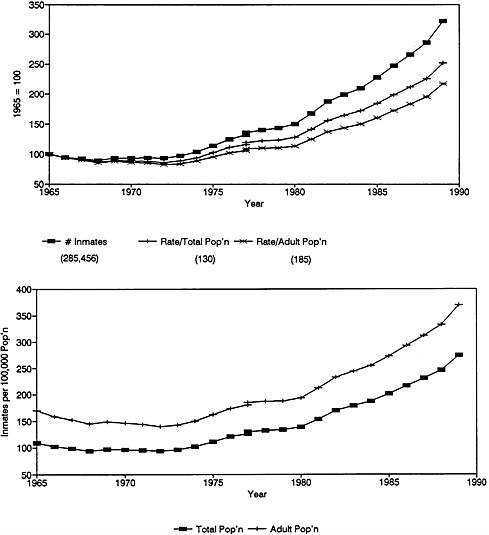
FIGURE 1 Incarceration in state and federal institutions in the United States, 1965-1989. Top. Inmate population rescaled with year 1965 = 100 (actual values for 1965 are in parentheses). Bottom. Incarceration rates.
and follows a period of relative stability in incarceration rates from 1945 to 1974 when the incarceration rate averaged 106 inmates per 100,000 total population, with a minimum rate of 93 in 1972 and a maximum rate of 119 in 1961 (Blumstein and Cohen, 1973).
The increases during the 1980s also exceed what were generally regarded as unrealistically high projections of prison populations obtained by simply extrapolating prevailing linear trends
during the 1970s. The Abt Corporation's 1980 study of past prison populations in the United States (Mullen, 1980:96) was typical of a widely held view in its conclusion that
although all prison population projections anticipate some further growth in the number of inmates in state custody, none call for continuation of the historically high rate of the mid-1970s.
In fact, as Table 2 reveals, the average annual growth from 1975 to 1980 of 5.5 percent in the number of inmates (3.7 percent in inmates per 100,000 adult population) was exceeded from 1980 to 1988, when the annual growth in the number of inmates averaged 8.0 percent (6.6% for inmates per adult population). Moreover, the one-year increase of 12.5 percent in the number of inmates in 1989 (11.3% in the rate per 100,000 adult population) was the largest increase ever.
These increases nationally are mirrored in individual states (Figure 2). By 1988 the incarceration rates, either per total population or per adult population, were close to or exceeded the corresponding national rates in five of the six states examined. Only Pennsylvania's rates remained less than 200 inmates per 100,000 population. The largest percentage increases from 1975 rates occurred in California (where the rate per total population increased more than 250%), New York (up 180%), and Pennsylvania (up 158% from 58 in 1975 to 149 in 1988). The increases in Florida and Texas were smaller, up about 60 percent from the already higher rates prevailing in those states in 1975. The six states examined are becoming more similar to one another in their incarceration rates: excluding Pennsylvania, the standard deviation in rates across the other five states drops from 33 percent of a mean rate of 120 in 1975 to only 6 percent of a mean rate of 257 in 1988.
Increases in crime—especially in violent crimes that are more likely to result in sentences to prison following conviction—are among the factors that may account for the recent rise in prison populations. Figure 3 shows the percentage of inmates incarcerated for individual crime types. Total U.S rates from the most recent 1986 inmate survey are contrasted with the corresponding range of rates found in the same year in the six study states. Although differing somewhat in absolute magnitude, the six states displayed the same relative prevalence of different crime types found in periodic national surveys of inmates in state prisons. Robbery and burglary are the most prevalent convicted offenses among resident inmates both in the United States and in individual
TABLE 2 Prison Inmates in the United States, 1965 to 1989
|
|
|
|
|
Annual Change in Inmates (%) |
||
|
Year |
Number of Inmates |
Inmates per 100,000 Total Population |
Inmates per 100,000 Adult Population |
Number of Inmates |
Rate per Total Population |
Rate per Adult Population |
|
1965 |
210,895 |
109.0 |
170.3 |
— |
— |
— |
|
1966 |
199,654 |
102.1 |
158.9 |
-5.3 |
-6.3 |
-6.7 |
|
1967 |
194,896 |
98.7 |
152.8 |
-2.4 |
-3.3 |
-3.8 |
|
1968 |
187,914 |
94.2 |
145.1 |
-3.6 |
-4.5 |
-5.1 |
|
1969 |
196,007 |
97.3 |
148.9 |
4.3 |
3.3 |
2.6 |
|
1970 |
196,429 |
96.3 |
146.3 |
0.2 |
-1.1 |
-1.7 |
|
1971 |
198,061 |
95.8 |
144.5 |
0.8 |
-0.6 |
-1.2 |
|
1972 |
196,092 |
93.7 |
140.2 |
-1.0 |
-2.2 |
-3.0 |
|
1973 |
204,211 |
96.6 |
143.2 |
4.1 |
3.1 |
2.1 |
|
1974 |
218,466 |
102.4 |
150.3 |
7.0 |
6.0 |
4.9 |
|
1975 |
240,593 |
111.7 |
162.2 |
10.1 |
9.0 |
7.9 |
|
1976 |
262,833 |
120.8 |
173.7 |
9.2 |
8.2 |
7.1 |
|
1977 |
278,141 |
126.6 |
180.3 |
5.8 |
4.8 |
3.8 |
|
1977 |
285,456 |
129.9 |
185.0 |
2.6 |
2.6 |
2.6 |
|
1978 |
294,396 |
132.6 |
187.1 |
3.1 |
2.0 |
1.2 |
|
1979 |
301,470 |
134.2 |
187.9 |
2.4 |
1.3 |
0.4 |
|
1980 |
315,974 |
139.0 |
193.2 |
4.8 |
3.6 |
2.8 |
|
1981 |
353,167 |
153.8 |
212.3 |
11.8 |
10.6 |
9.9 |
|
1982 |
394,374 |
170.0 |
233.3 |
11.7 |
10.5 |
9.9 |
|
1983 |
419,820 |
179.2 |
244.8 |
6.5 |
5.4 |
4.9 |
|
1984 |
443,398 |
187.5 |
255.3 |
5.6 |
4.6 |
4.3 |
|
1985 |
480,568 |
201.3 |
273.5 |
8.4 |
7.4 |
7.1 |
|
1986 |
522,084 |
216.8 |
293.8 |
8.6 |
7.7 |
7.5 |
|
1987 |
560,812 |
230.7 |
312.2 |
7.4 |
6.4 |
6.3 |
|
1988 |
603,720 |
246.1 |
332.3 |
7.7 |
6.7 |
6.4 |
|
1989 |
679,263 |
274.5 |
369.8 |
12.5 |
11.5 |
11.3 |
|
|
|
1975-1980 Average |
5.5 |
4.5 |
3.7 |
|
|
|
|
1980-1988 Average |
8.0 |
7.0 |
6.6 |
|
|
SOURCES: Flanagan and Maguire (1990:Table 6.43); Bureau of Justice Statistics (1990a). Adjustments to form population rates use population data from Bureau of the Census (1974, 1982, 1984, and 1986). Both custody and jurisdiction counts are reported for 1977 to facilitate year-to-year comparisons. |
||||||
states, whereas rape and aggravated assault are the least prevalent of the crime types compared.
When examined over time from 1975 to 1988, the crime mix of inmates in each of the six states does not display any general increases in violent offenses among either commitments to prison or resident inmates. With the exceptions of rape (which increases
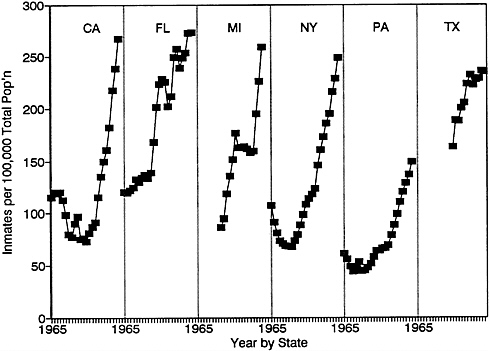
FIGURE 2 Annual total incarceration rate in individual states: inmates per total population from 1965-1988.
sharply from 4.6 to 13.8% among Michigan inmates, and more modestly in Florida from 5.0 to 9.1%) and assault (which exhibits slow but steady increases from 5.0 to 6.8% in Michigan and Pennsylvania, and from 2.1 to 4.0% in Texas), the contribution of violent offenses to the total is stable or, in the case of robbery (Figure 4-top), actually decreases during the 1980s. Only drug offenses (Figure 4-bottom) display widespread sharp increases as a percentage of total prison populations, especially after 1980.6
The proportional mix of crime types among inmates is a constrained relational measure: recent large increases in the proportion of inmates for drug offenses must be offset by corresponding declines in the proportions of inmates for other crime types. Such compensating changes in proportions could easily conceal real increases in incarceration for violent offenses. In order to better isolate patterns of incarceration for violent crimes, the crime-specific rate of resident inmates per 100,000 population is compared to the more commonly reported total incarceration rate.
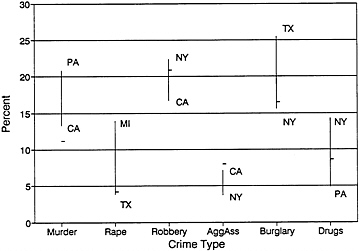
FIGURE 3 Crime mix among resident inmates in 1986: percent of total inmates by most serious convicted offense in the United States (represented by a dash), and in individual states with the lowest and highest percents among the six states in this study. SOURCE: For U.S. percents, Bureau of Justice Statistics (1988).
Figure 5 presents crime-specific incarceration rates for New York. Because the different crime types are characterized by incarceration rates that differ markedly in scale, with rates as low as 1 inmate per 100,000 population for rape or aggravated assault and as high as 60 for robbery or burglary, annual incarceration rates for each crime type are adjusted to a common scale by using the 1977 rates as a base.
Since 1977, across the six states, incarceration rates for the expressive, violent offenses of murder and aggravated assault (e.g., Figure 5-top) have increased at rates very similar to those observed for total incarceration rates in Figure 1. (The increase for aggravated assault is somewhat higher in Pennsylvania and Texas.) Similar increases in incarceration rates were also observed across the six states for the more instrumental offenses of robbery and burglary (e.g., Figure 5-bottom). The increases in total incarceration rates evident in Figures 1 and 2 thus reflect a general pattern of similar increases that occurred widely across different crime types and states. The incarceration rate for drug offenses is distinguished from other crime types by a rapid increase in the inmate population beginning in 1985.
Some interesting exceptions to the general pattern do exist. It is evident from Figure 6-top that Florida experienced distinctive
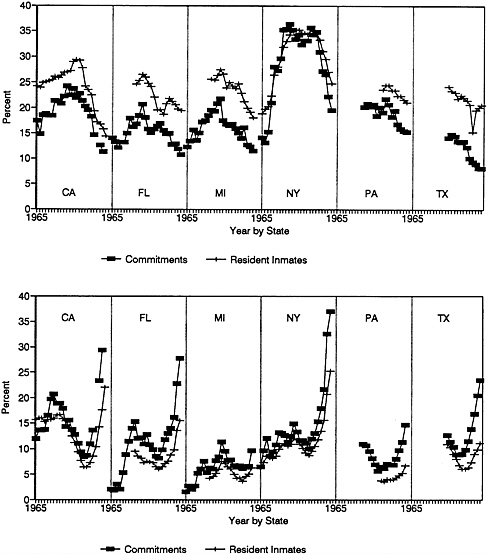
FIGURE 4 Percent of prison population serving time for robbery or drug offenses each year from 1965-1988 in individual states. Top. Commitments and resident inmates for robbery. Bottom. Commitments and resident inmates for drug offenses.
increases in incarceration rates for rape over the period under study. Similar increases in the incarceration rate of inmates serving time for rape were also observed in Michigan and Texas. Also in Florida, incarceration rates for aggravated assault, burglary, and robbery do not exhibit the same general increases observed in other states. Instead, incarceration rates for these offense types
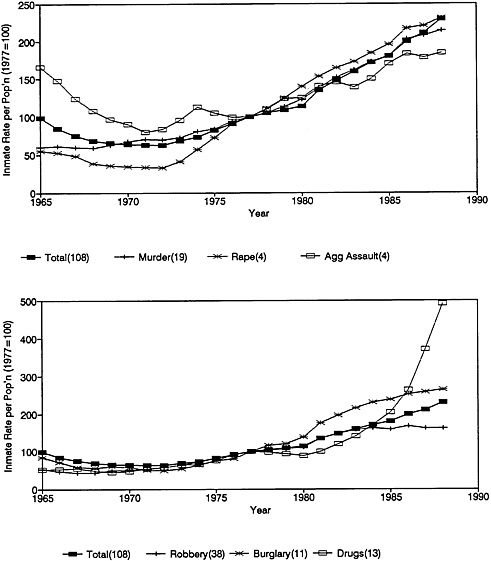
FIGURE 5 Variation over time in crime-specific incarceration rates in New York. Rates for individual crime types are rescaled using a common base rate of 100 in 1977 (actual values for 1977 are in parentheses). Values represent percentage differences from rates in 1977. Top. Violent offenses of murder, rape, and aggravated assault. Bottom. Instrumental offenses of robbery, burglary, and drugs.
recently began to stabilize or actually decline. Similar declines are also evident in incarceration rates for burglary and robbery in Texas.7 These declines for selected crime types occur in the two states in this study whose entire correctional systems are operating under court order to relieve overcrowding and improve other
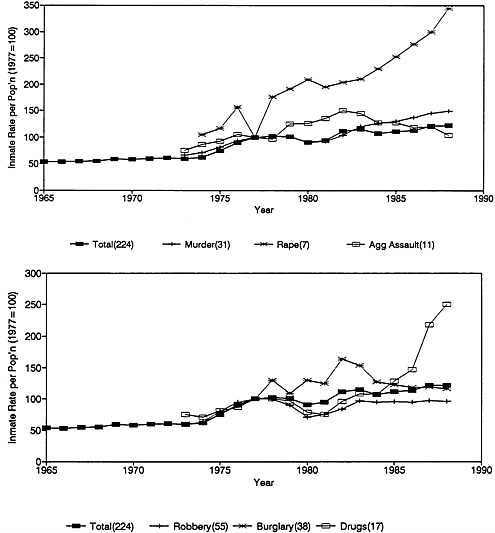
FIGURE 6 Variation over time in crime-specific incarceration rates in Florida. Rates for individual crime types are rescaled using a common base rate of 100 in 1977 (actual values for 1977 are in parentheses). Values represent percentage changes from the rates in 1977. Top. Violent offenses of murder, rape, and aggravated assault. Bottom. Instrumental offenses of robbery, burglary, and drugs.
conditions of confinement (American Correctional Association, 1989; National Conference of State Legislatures, 1989).
In the face of continuing shortages of space and other resources, one strategy to alleviate overcrowding is to reduce the number of inmates, through either reductions in the length of stay or use of
alternatives to imprisonment at sentencing. Such strategies are preferably reserved for less serious or marginal cases in order to ensure sufficient prison capacity for more serious cases. In Florida, however, the escalating flow of new commitments to prison—principally for drug offenses—has resulted in early release from prison even for inmates convicted of serious violent offenses. Under a program granting ''administrative gain time" (time off from the sentenced term), state prison inmates in Florida have recently had one month deducted from their sentences for every two weeks they actually serve (Isikoff, 1990).
FACTORS CONTRIBUTING TO CHANGING INCARCERATION RATES
Crime-specific incarceration rates (such as those in Figures 5 and 6) adjust for changes in the size of the base population and for changes in the crime mix that characterizes offending. Such incarceration rates are themselves influenced by changes in the underlying crime rate and in sanction policies. The standard measure of the incarceration rate as the ratio of inmates to the general population reflects the combined effects of offending rates, arrests by the police, convictions and sentences to incarceration in the courts, and release and recommitment rates by parole authorities. The separate influences on incarceration rates of these various stages of processing by the criminal justice system can be examined in the product
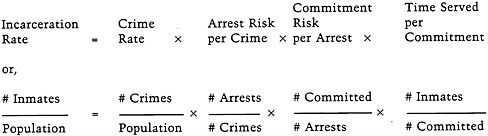
The separate components are listed in Table 3. The appendix tables, which appear at the end of the paper, report the mean and standard deviation of each variable over time for each crime type and state. We examine the changes in individual components separately and later assess the relative contribution of these factors to the incarceration rate.
TABLE 3 Offending and Sanction Variables in Analysis of Changing Incarceration Rates
CHANGES IN OFFENDING
From 1965 to 1975 the total index crime rate in the United States more than doubled, from 2,445 reported index crimes per 100,000 population in 1965 to 5,284 in 1975.8 Between 1975 and 1988 the changes in total index crime rates had slowed considerably, increasing 12 percent to a peak rate of 5,919 in 1980, declining 15 percent to a rate 5,025 in 1984, and then rising again by 13 percent to the 1988 rate of 5,664.9 As a result, the total index crime rate in 1988 was not much higher than the same rate in 1975 (up 7.2%).
Despite the relative stability of the total index crime rate for
the United States between 1975 and 1988, there are some interesting differences among the crime-type components of the total rate. Rates for violent crimes increased more than property crimes in the FBI's crime index. The modest 7.2 percent increase in the total index crime rate in the United States from 1975 to 1988 resulted from a 4.7 percent increase in the property crime rate and a much larger 32.3 percent increase in the violent crime rate.10 If robbery (which shares features of both violent and property crimes) is excluded, the rate per total population for the remaining violent offenses increased 58.0 percent between 1975 and 1988, reflecting increases in the rates of rapes and aggravated assaults that are reported by the police;11 murder rates actually declined by 12.5 percent between 1975 and 1988.
Changes in population crime rates may be affected by changes in the composition of the population toward increased (or decreased) representation of population subgroups that are characterized by higher (or lower) crime rates. Age, for example, is a potentially important factor distinguishing population crime rates,12 as illustrated by age-specific arrest rates in 1988 that peaked in the late teens or early twenties and then dropped slowly through the adult years (Federal Bureau of Investigation, 1990b). The period 1965 to 1988 was characterized by a general aging of the U.S. population, with adults (age 18 and over) rising from 64 percent of the population in 1965, to 69 percent in 1975, and then to 74 percent by 1988. This population shift, combined with age-varying arrest rates, would contribute to increases in general population crime rates.
The increasing representation of adults in the total population is a particularly important factor in the differences observed between violent and property crime rates for the total population. Violent crimes are especially characteristic of adults. While the peak arrest rate for murder was at age 18 in 1988, murder rates declined slowly with age and did not reach a rate equal to one-half the peak rate until ages in the early thirties (Federal Bureau of Investigation, 1990b). Rape and aggravated assault rates peaked at ages 23 and 21, respectively, and remained above the half-peak rate into the late thirties. This contrasts with arrests for property crimes, which peaked at age 16 and reached the half-peak rate by age 23. Robbery rates fell between violent and property crimes, peaking at age 18 and reaching the half-peak rate in the late twenties.13
After partially controlling for age and using rates of the estimated number of crimes committed by adults per adult population,14
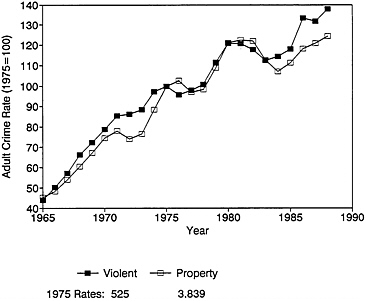
FIGURE 7 Growth in U.S. crime rate, 1965-1988, with annual adult crime rates (estimated crimes by adults per 100,000 adult population) rescaled to a common base rate of 100 in 1975 (actual values for 1975 are in parentheses). Values represent percentage differences from the rates in 1975.
the growth in adult crime rates through 1975 was very similar for violent and property offenses, which increased 127 and 121 percent, respectively (Figure 7). The increases in crime rates from 1975 to 1988 were smaller in magnitude for both crime types, but only slightly more pronounced for violent offenses: increasing 38 percent for adult violent crimes and 24 percent for adult property crimes. Thus, much of the larger increase over time observed in violent crime rates per total population compared to the same rates for property crimes is removed when appropriate controls for aging of the population are included.
Blumstein et al. (1991) use a richer age partition and include race differences in offending rates for a more thorough analysis of changes in total crime rates in the United States over the same period. They conclude that, on average, changes in the racial and age composition of the population accounted for about 20 percent of the total change in crime rates for robbery and burglary and almost 30 percent of the change in crime rates for murder. Changes in population composition had especially important effects on the
large increases in crime rates between 1965 and 1975 for robbery and murder.
Crime rates will also be affected by changes in levels of criminality toward more or less offending. Increases in criminality—whether they result from increases in the size of the offender population or from higher frequencies of offending by individual offenders—can increase the incarceration rate independently of any changes in imprisonment policies.15 The rise in adult crime rates illustrated in Figure 7 hints at the substantial underlying changes in criminality from 1965 to 1988 reported in Blumstein et al. (1991). Such increases in offending levels, particularly in those crime types that are more vulnerable to imprisonment, will contribute to increases in population incarceration rates.
CHANGES IN SANCTION POLICIES
The incarceration rate is influenced further by changes in sanction policies that either increase (or decrease) the risk of arrest per crime qa, the imprisonment risk per arrest Qi, or the average length of time served in prison S. We used data on reported crimes and arrests for each state in combination with annual data on commitments to state prisons and resident inmates to estimate the sanction variables.
Arrest Risk per Crime, qa
The arrest risk per crime (reported in appendix Table A-2) is estimated from the ratio of adult arrests of persons age 18 and older in each state to the estimated number of adult crimes reported by the police. The arrest risk variable used here is only a proxy measure that overstates the actual risk of arrest following a crime. The upward bias in qa arises from two sources: (1) the number of crimes in the ratio includes only crimes that are reported by the police, and (2) the number of arrests in the ratio often includes the arrest of several offenders for a single offense.
Data that are available from the annual National Crime Survey (NCS) indicate that the upward bias in qa may be substantial. Crime victims responding to the NCS indicate that about one-half of the violent crimes they suffer are reported to the police each year. Although the reporting rate varies somewhat across offense types, it has remained fairly stable at about 55 percent per year for the more serious violent offenses of rape, robbery, and aggravated assault (Bureau of Justice Statistics, 1990b). After adjustment
for unreported crimes, total crimes will increase about 1.8-fold.
The NCS also provides data on the number of offenders per crime incident. These data on multiple offenders vary considerably in availability across different offense types, but are more readily available for crimes of violence that involve direct offender-victim confrontations. By using data from Reiss (1980) on crimes committed from 1972 to 1975 in the United States, the average number of offenders per crime committed was estimated to be 1.6 for rape, 2.3 for robbery, and 2.6 for aggravated assault (Blumstein and Cohen, 1979).
Adjusting qa for unreported crimes increases the total number of crimes about 1.8-fold, whereas adjustment for multiple offenders increases total crimes another 1.6- to 2.6-fold. The simple ratio of arrests to crimes reported by the police in qa (Table A-2) thus overstates the arrest risk per crime committed threefold (1/[1.8*1.6]) for rape; four-fold (1/[1.8*2.3]) for robbery; and five-fold (1/[1.8*2.6]) for aggravated assault.
The arrest risk per crime (Table A-2) varies primarily by crime type. As might be expected, murder has the highest arrest risk per crime.16 This is followed by other violent offenses with mean values of qa that vary roughly from 0.25 to 0.35. If adjustments for unreported crimes and multiple offenders per crime incident were taken into account, the actual arrest risk per crime would be reduced to a range of 5 to 10 arrests for every 100 crimes that offenders commit for the violent offenses of rape, robbery, and aggravated assault. Some differences among states are also evident, notably, higher values of qa in Pennsylvania for most crime types. With regard to time, qa generally remained fairly stable from 1965 to 1988.
Certainty and Severity of Imprisonment
The decade of the 1980s was one of substantial changes in imprisonment policies effected through implementation of determinate or mandatory sentencing schemes, sentencing guidelines, and restrictions on or elimination of parole release from prison. In addition to addressing concerns about reducing judicial discretion and the variability in sentences imposed for similar offenses, these new sentencing policies entailed a shift toward more severe penalties.
Imprisonment sanctions can be distinguished in terms of the risk—or certainty—of going to prison following arrest (Qi), and
the length of time served—or severity—for those offenders who are committed to prison (S). Certainty is primarily determined by the sentencing judge, although legislatures have increasingly become involved in influencing Qi through statutory provisions that mandate the imposition of prison terms for certain offenses. Severity, although partially the result of judicially imposed sentences, is determined primarily by administrative agencies, through the release and custody policies of corrections and parole agencies.
The partition between Qi and S distinguishes between short-term and long-term effects of imprisonment policies on the size of the resident inmate population. Effects of Qi on the flow of inmates into prison will be felt in the short term through immediate changes in the number of commitments to prison, whereas effects of changes in S will take longer to be manifested as substantial increases (or decreases) in the stock of resident inmates.
The prevailing levels of these imprisonment sanctions can be estimated from data on commitments to prison and the size of the resident population. The imprisonment risk per arrest (Qi) is estimated from the ratio of commitments to prison in a year to the number of adult arrests. Data on new commitments to prison are obtained from the intake process over an entire year. Only those commitments to prison that arise from a new sentence in court are included in the count of commitments. Persons who are recommitted or returned to prison from any form of conditional release (usually parole) in order to serve additional time on a previous sentence are excluded from the commitment count. Thus, Qi represents the risk of being sentenced to prison following an arrest.
Mean values of Qi vary considerably by crime type (see Table A-2). The risk of prison following arrest is naturally highest for murder. Even for this most serious of violent offenses, however, imprisonment is not a certainty, due primarily to the failure of some arrests to end in conviction. Robbery and rape follow murder, with 10 to 33 percent of arrests resulting in commitment to prison for these offenses. The imprisonment risk for robbery is somewhat higher than for rape in Florida, Michigan, and New York. Qi generally falls to a range of 2 to 5 percent for aggravated assault, burglary, and drug offenses, although the imprisonment risk for burglary is three to four times higher in Florida and Texas.
Time served in prison, S, is estimated from the ratio of the average daily census of resident inmates in a year to the number of new commitments in the same year.17 The number and characteristics of resident inmates are obtained from a one-day census,
typically conducted at the end of the fiscal year. Both new commitments from court and recommitments on the same sentence are included in the count of resident inmates. Thus, time served represents the total time an offender spends incarcerated on a sentence, including time served until first release from prison and any additional time served on the same sentence following revocation of conditional release.18 The pattern of average time served across crime types matches that observed for Qi, being highest for murder at 4.5 or more years per commitment, and lowest for aggravated assault, burglary, and drug offenses at 1.27 to 3.0 years (see Table A-3).
Table 4 reports the average annual percentage change in imprisonment risk per adult arrest (Qi0 and in average time served per commitment to prison (S) since 1977. Increases in both imprisonment sanctions are widespread from 1977 to 1988, although somewhat more likely for S than for Qi.19 Increases in time served for robbery, aggravated assault, and burglary were less than 1.5 years, whereas terms for murder increased from 2 to 4 years. Rape is the only crime type experiencing increases in both Qi and S widely across the six states examined. For murder and robbery, by contrast, increases in S are more common than increases in Qi.
The relative magnitudes of changes in Qi and S vary across states.20 In California, increases in both Qi and S are widespread, though somewhat larger in magnitude for commitments to prison (Qi). Increases in time served in prison, S, predominate in Michigan, New York, and Pennsylvania.21 The increases in these four states are compatible with sentencing reforms to increase penalties in each state, especially for offenses involving violence or firearms.22
About one-half of all state-by-crime comparisons involve changes in opposite directions for Qi and S. Such changes are especially characteristic of certain states and crime types. In Florida, although the risk of commitment to prison following arrest (Qi) has been increasing for all crime types, the average time served once in prison (S) has declined for all crime types except the most serious violent offenses of murder and rape. This reflects the impact of special provisions for administrative reductions in minimum sentences in order to reduce seriously overcrowded prison populations in that state. Opposite changes in Qi and S also predominate for robbery and burglary with Qi declining, and for drug offenses with S declining (Table 4).23
TABLE 4 Average Annual Percentage Change in Imprisonment Sanctions by State and Crime Type, 1977-1988
|
State |
Murder |
Rape |
Robbery |
Aggravated Assault |
Burglary |
Drug Offenses |
|
Imprisonment Risk per Adult Arrest, Qi (prison commitments per adult arrest): |
||||||
|
California |
0.9 |
8.2 |
3.5 |
8.4 |
10.9 |
11.5 |
|
Florida |
6.0 |
9.1 |
1.8 |
9.8 |
6.7 |
1.9 |
|
Michigan |
-0.9 |
6.7 |
-5.7 |
0.5 |
-3.4 |
0.5 |
|
New York |
0.4 |
0.3 |
-2.7 |
0.1 |
10.7 |
8.3 |
|
Pennsylvania |
5.5 |
2.7 |
-1.0 |
2.6 |
-1.5 |
0.7 |
|
Texas |
-0.2 |
9.5 |
-5.1 |
5.6 |
-1.8 |
15.0 |
|
Average Time Served in Prison (years), S (resident inmates per prison commitment): |
||||||
|
California |
3.5 |
7.0 |
3.6 |
3.5 |
4.6 |
-3.0 |
|
Florida |
0.6 |
-0.8 |
-4.3 |
-9.3 |
-7.0 |
-6.1 |
|
Michigan |
4.0 |
7.6 |
4.4 |
3.5 |
5.3 |
4.6 |
|
New York |
7.2 |
7.7 |
3.7 |
2.1 |
2.6 |
-0.8 |
|
Pennsylvania |
3.7 |
5.5 |
8.1 |
6.2 |
10.7 |
3.1 |
|
Texas |
4.0 |
7.0 |
3.2 |
0.4 |
0.5 |
-5.7 |
IDENTIFYING THE COMPONENTS OF CHANGE IN INCARCERATION RATES
In this section, we aggregate the various components of the incarceration rate into two main factors: variations in the adult crime rate per population (ACR) and variations in the expected time served per adult arrest (Qi * S). The total incarceration rate is contrasted with these two elements to identify the relative influences of offending and sanction policies on observed changes in incarceration over time.24
Figures 8 to 11 present graphical displays of smoothed values of ACR and QiS for illustrative states and crime types. Two distinct time periods are evident in changing incarceration rates, one of relative stability or slow declines in inmate rates through the mid-1970s, followed by a period of steady growth in inmate rates through 1988. Figure 8 presents the dominant pattern of change. The early period before the mid-1970s is generally one of offsetting trends, with adult crime rate (ACR) increasing and imprisonment sanctions (QiS) decreasing. During the latter period of growth in incarceration rates, continued growth in adult crime rates is often compounded by rises in QiS as well.
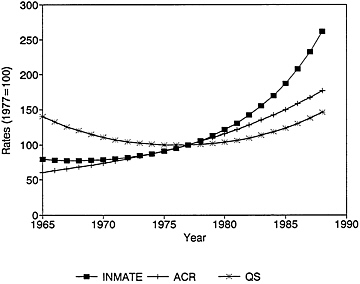
FIGURE 8 Role of crimes and imprisonment sanctions in changing incarceration rate for aggravated assault in New York (ACR = adult crimes per 100,000 population; QiS = expected man-years in prison per adult arrest [inmates/adult arrests]; INMATE = inmates per 100,000 total population).
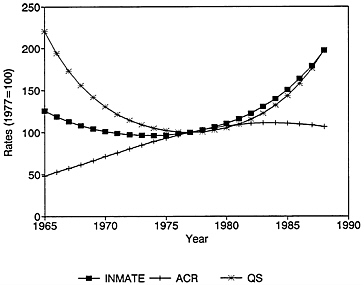
FIGURE 9 Role of crimes and imprisonment sanctions in changing incarceration rates for robbery in California (ACR = adult crimes per 100,000 population; QiS = expected man-years in prison per adult arrest [inmates/adult arrest]; INMATE = inmates per 100,000 total population).
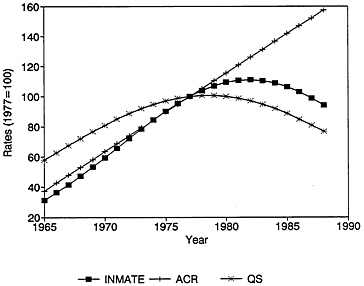
FIGURE 10 Role of crimes and imprisonment sanctions in changing incarceration rates for robbery in Florida (ACR = adult crimes per 100,000 population; QiS = expected man-years in prison per adult arrest [inmates/adult arrests]; INMATE = inmates per 100,000 total population).
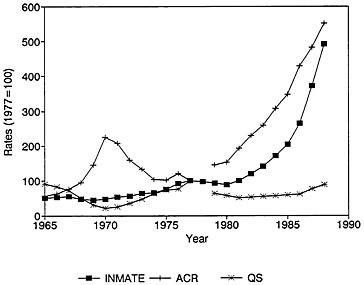
FIGURE 11 Role of crimes and imprisonment sanctions in changing incarceration rates for drug offenses in New York (ACR = adult crimes per 100,000 total population; QiS = expected man-years in prison per adult arrest [inmates/adult arrests]; INMATE = inmates per 100,000 total population).
TABLE 5 Average Annual Percentage Change in Crimes and Incarceration by State and Crime Type, 1977-1988
|
State |
Murder |
Rape |
Robbery |
Aggravated Assault |
Burglary |
Drug Offenses |
|
Adult Crime Rate, ACR (adult crimes per 100,000 adult population): |
||||||
|
California |
1.3 |
-1.2 |
1.5 |
5.9 |
-0.3 |
10.0 |
|
Florida |
0.8 |
1.2 |
7.8 |
2.8 |
5.3 |
7.8 |
|
Michigan |
3.8 |
2.4 |
-1.9 |
4.3 |
-0.9 |
8.1 |
|
New York |
1.8 |
0.9 |
5.7 |
5.5 |
2.3 |
15.6 |
|
Pennsylvania |
-1.4 |
2.7 |
2.7 |
3.5 |
1.1 |
9.8 |
|
Texas |
-4.2 |
4.9 |
4.6 |
5.6 |
5.7 |
5.8 |
|
Expected Time Served per Adult Arrest, QiS (resident inmates per adult arrest): |
||||||
|
California |
8.9 |
8.3 |
5.9 |
6.9 |
14.2 |
10.2 |
|
Florida |
5.4 |
11.4 |
-3.5 |
-2.4 |
-0.8 |
-1.4 |
|
Michigan |
0.5 |
16.0 |
0.3 |
3.8 |
7.5 |
11.6 |
|
New York |
4.4 |
7.1 |
-2.0 |
0.7 |
11.2 |
4.3 |
|
Pennsylvania |
11.4 |
10.2 |
7.6 |
10.4 |
10.7 |
5.6 |
|
Texas |
2.4 |
16.1 |
-1.7 |
4.1 |
-3.1 |
4.3 |
|
NOTE: The average yearly percentage change in the product QiS does not, in general, equal the product of the average percentage change in each component, Qi and S: E[Qi(t+1)S(t+1)/Qi(t)S(t)] ≠ E [Qi (t+1)/Qi(t)] • E [S(t+1)/S(t)]. Thus the values in this table cannot be obtained directly from the values in Table 4. |
||||||
The pattern in the early period is widespread across states and crime types, as is evident in Figures 8, 9, and 11. Since the mid-1970s, imprisonment sanctions have generally increased across the states for most crime types. (Exceptions to this pattern in Florida and Texas, as well as for the crime of robbery, are discussed below.)
Table 5 reports the average annual percentage change in adult crime rates and imprisonment sanctions for the period 1977 to 1988. Increases in QiS are most widespread in California and Pennsylvania, where growth rates average from 5 to 15 percent per year and accompany explicit changes in sentencing policy in the two states (also see Figure 9). In 1977, California implemented a policy of determinate sentences accompanied by the elimination of early release on parole. In the early 1980s, Pennsylvania implemented new sentencing guidelines, which have frequently been augmented by special statutory provisions for mandatory
minimum sentences for selected offenses. In the other four states, QiS actually leveled off or declined for some offenses during the later period (also see Figure 10).
The increases in QiS since 1977 usually accompany continued increases in adult crime rates (ACR) through the 1980s—a pattern illustrated in Figure 8. Crime rates are most stable through the 1980s in California, as illustrated in Figure 9. Since the mid-1970s, rising incarceration rates thus have resulted from upward trends in both QiS and ACR, or they have tracked increases in QiS where adult crime rates have remained relatively stable. Rape is distinguished among crime types by uniformly large increases in QiS across all six states (Table 5).
There are two noteworthy exceptions to the general upward trend in use of imprisonment sanctions from 1977 to 1988. First, for all crime types except murder and rape in Florida, and for selected crime types in Texas—notably robbery and burglary—QiS decreased, while adult crime rates continued to rise (Figure 10 and Table 5). These declines in QiS occur in the two states in this study whose state corrections systems are under court order to reduce prison crowding, and thus may reflect explicit changes in imprisonment policies intended to address the prison population problem.
The decrease in use of imprisonment sanctions in Florida occurs despite implementation in the early 1980s of harsh sentencing policies that abolished parole, lengthened sentences, and mandated prison terms for many offenses. Although these policies were intended to increase the use of incarceration, they quickly overburdened already strained corrections resources in that state. The problem became so acute by the late 1980s that special procedures were implemented to permit administrative reductions in sentences for most inmates serving time in Florida prisons. By 1990, sentences were being reduced by one month for every two weeks actually served (Isikoff, 1990).
The second exception to widespread increases in QiS is the pattern in incarceration rates for robbery. As Figure 10 illustrates (also see Table 5), QiS has been declining for robbery during the post-1977 period. Such declines are observed in three of the six states examined and occurred while adult crime rates (ACR) in robbery, on average, continued to increase from 1977 to 1988.
Growing at an average of about 5 to 10 percent per year, the use of imprisonment for drug offenses has increased at rates roughly comparable to those of violent offenses (Table 5). Increases in Qi S are usually accompanied by larger increases in input to the
courts from arrests of adults for drug offenses (also see Figure 11). When combined with these rising adult arrest rates for drug offenses that show no immediate indications of slowing, the recent increases in QiS for drug convictions forebode even larger increases expected in the inmate population for drug offenses.
SUMMARY
The data from six states illustrate the important role that changing imprisonment policies have played in rising prison populations over the last decade. Increases in the use of imprisonment, usually accompanying explicit policy changes toward harsher penalties, are widespread across states and crime types between 1977 and 1988. Policy changes that involve sentencing guidelines, statutes specifying mandatory minimum prison terms, and restrictions on parole release share a common goal of increasing the certainty and severity of prison terms imposed on offenders. The data suggest that these changes in policy have for the most part resulted in corresponding changes in practice.
Both imprisonment risk following arrest (Qi) and time served for those committed to prison (S) have increased. Such increases were especially prevalent for rape, where both Qi and S increased, and for murder and robbery, where time served increased while Qi remained relatively stable or declined. Increases in the use of imprisonment sanctions also were observed broadly across crime types in California. In Florida, increases in Qi are more common, whereas increases in S predominate in Michigan, New York, and Pennsylvania. The resulting increases in expected time served per adult arrest, QiS, combined with continuing increases in crime rates through the 1980s, contribute to the staggering increases in prison populations of the past decade.
Robbery and drug offenses are distinctive among the crime types examined because they involve opposite changes in Qi and S. For robbery, increases in time served (S) were dominated by larger declines in imprisonment risk following arrest (Qi), and robbery was the only crime type among those examined that was characterized by declining or stable levels of expected time served per adult arrest (QiS) during the 1980s. In the case of drug offenses, increases in Qi were often accompanied by declines in S, which moderated somewhat the total increases in QiS for this offense. In Florida, the decrease in S results from an administrative program of emergency early release that is implemented as
needed to offset excessive growth in prison populations in that state arising from continuing increases in Qi.
CRIME CONTROL EFFECTS OF INCARCERATION FOR VIOLENT CRIMES
Whether measured by raw counts of inmates, by population rates, or in relation to crimes committed, the use of incarceration has increased substantially in the United States since the mid-1970s. In this section, we explore the likely impact of these changes in sanction policies on levels of violent crime. Aside from retribution (or punishment), incarceration also serves crime control purposes, operating directly through incapacitation to prevent crimes by those incarcerated offenders who are physically removed from the community, or indirectly through the deterrence (i.e., inhibiting) effects of threatened incarceration on offenders who are not now in prison.
Incapacitation and deterrence interact in important ways to reduce the overall level of crime. Despite an extensive body of empirical research, no prior studies satisfactorily estimate these two effects.25 Numerous studies provide estimates of the elasticity of crime to changes in sanction levels. To the extent that estimates of the ''deterrence" elasticity refer to imprisonment sanctions, however, they really reflect the combined effects of deterrence and incapacitation. Incapacitation estimates, by contrast, fail to incorporate deterrence effects that may substantially reduce the individual offending levels from which incapacitation is measured.
The discussion below focuses mainly on the incapacitation effects of incarceration and offers important new advances over previous estimates. We also consider, in an exploratory way, recalibrating these incapacitation estimates to accommodate the impact of deterrence on base offending levels.
INCAPACITATION OF VIOLENT CRIMES
As with other forms of crime, any single violent offense rarely leads to incarceration of its perpetrator. Thus, at any point in time, only a small fraction of offenders who engage in violent crimes are imprisoned and incapacitated from further victimizing individuals in the community. Yet, the reduction in violent crimes attributable to incapacitation need not be negligible, since a relatively
small group of incarcerated offenders could, in the absence of imprisonment, substantially increase the violent crime rate.
Typically the incapacitation effect (I) of imprisonment is measured on a percentage basis by comparing the number of crimes that are prevented by incapacitation to the total number of crimes that would have been committed if offenders were fortunate enough to avoid imprisonment. Thus, I for violent offenses depends fundamentally on the number of crimes that incarcerated offenders would commit if they were to remain free in the community, which in turn rests on the mix of offense types that offenders commit, individual rates of committing violent crimes while offenders are free, and the length of time that offenders will continue to commit violent crimes.26 Assessing the crime control effects of incapacitation in reducing violent crimes thus requires that we inquire about the general characteristics of offending careers and the role of violent offenses in those careers.
Although studies that focus exclusively on violent offenders are rare,27 empirical evidence about violent offending can be found in cross-sectional and longitudinal studies of general offending careers. The bulk of this literature, as it applies to violent crimes, has been reviewed by Farrington (1982), Blumstein et al. (1986), and more recently Weiner (1989). We discuss briefly the empirical findings about the contributions of violent offenses in offending careers and highlight their implications for incapacitation. The results from this research generally support the conclusion that incapacitation has nontrivial consequences for the control of violent crime.
At the end of the section, we offer estimates of I for robbery in California, Michigan, and Texas. These estimates were computed based on a model that explicitly incorporates important features of the crime-generating process previously observed in empirical research. Comparable estimates for other violent offenses remain unavailable at this time.
Individual Offending Frequency (λ)
Violent offenses constitute a relatively small percentage of the total crimes generated by an offender population. For example, Tracy et al. (1990) found that violent offenses represented less than 5 percent of total police contacts in cohort studies of juvenile offending by Philadelphia boys born in 1945 and 1958. Similar results were reported by Shannon (1982, 1988) for each of three birth cohorts traced in Racine, Wisconsin. In summarizing
several studies of juvenile and adult offenders, Blumstein et al. (1986:78-79) conclude that violent offenses represent only 10 to 20 percent of the criminal records of arrested or convicted offenders.
At the individual offender level, estimates of annual offending rates (λ) for selected violent crimes are typically low. The average value of λ for robbery—the violent crime most frequently analyzed—among all offenders committing that crime has been estimated to be in the interval of 1 to 3 crimes committed per year free (Peterson and Braiker, 1981; Blumstein et al., 1993). Although λ estimates of comparable accuracy for other violent crimes committed by the overall offender population have seldom been computed, existing evidence points in the direction of rates even lower than those for robbery, especially for rare offenses such as homicide and rape.28 Extrapolating from self-reported crime rates among California prison inmates surveyed in 1976, Chaiken (1980) estimated average λ's for the general population of offenders of 0.16 crime per offender per year free for homicide, 0.92 for rape, 2.38 for aggravated assault, and 1.97 for armed robbery. Blumstein and Cohen (1979) found similar λ values for robbery and aggravated assault in samples of adult arrestees in Washington, D.C. and in the metropolitan area of Detroit.29
Such low offending rates would seem to suggest small to negligible incapacitation returns from incarcerating violent offenders, especially when the low risk of incarceration following most violent crimes is considered. For example, based on estimates reported in Canela-Cacho (1990:Table 6.5), the odds against imprisonment following a robbery committed during the late 1970s were 135:1 in California, 72:1 in Michigan, and 50:1 in Texas.30 For those offenders who are caught and sent to prison, the average time served for robbery during the late 1970s was relatively constant—about 3.7 years in the three states. Over the course of a career, the average offender would only exceptionally be intercepted by the criminal justice system, and while incarcerated, fewer than a dozen robberies would be prevented. Thus, the crimes prevented by incapacitation would appear to represent only a small fraction of the total crimes that an offender would generate were he to avoid all interruptions by imprisonment.
To date, the most widely applied method to measure incapacitation is the model developed in Avi-Itzhak and Shinnar (1973) and applied in Shinnar and Shinnar (1975). This model offers a way to estimate I for the average offender under particular values of the sentencing parameters: Q = qa*Qi for the probability of
TABLE 6 Average Incarceration Sanctions for Robbery, 1975-1980
incarceration following a crime, and S for the average time served among incarcerated offenders.31 For the average Q and S values observed in California, Michigan, and Texas during the latter half of the 1970s (Table 6), and the average λ for robbery during the same period in each state estimated by Blumstein et al. (1993),32 the Avi-Itzhak and Shinnar model yields I values of a 7.9 percent reduction from the potential number of robberies in California, 12.8 percent in Michigan, and 9.1 percent in Texas.33 These modest reductions in crime of 5 to 15 percent are similar in magnitude to other I estimates (based on different estimating procedures), which have led some analysts to conclude that incapacitation does not contribute substantially to crime control (see, for example, Clarke, 1974; Greenberg, 1975).
Heterogeneity in Individual Offending Frequencies (λ1)
There are, however, strong reasons for believing that these estimates suffer from a sizable downward bias. Without exception, studies of general offending, whether based on self-reports or official data, have found considerable variation in individual offending
rates (peterson and Braiker, 1981; Chaiken and Chaiken, 1982; Dunford and Elliott, 1984; English, 1990; Horney and Marshall, 1991; Miranne and Geerken, 1991). Moreover, a small subset of offenders generally accounts for a disproportionately large share of total crimes reported or recorded for the group of offenders under study (Wolfgang et al., 1972; Chaiken and Chaiken, 1982). This same general pattern also holds, but to a lesser degree, for violent offenses. For example, Piper (1985) found that 18.6 percent of violent offenders accounted for 45.2 percent of total police contacts for violent crimes in the 1958 Philadelphia cohort. These results mirror those in Miller et al. (1982:Table 4.9), in which 22.9 percent of violent offenders were responsible for 45.7 percent of all arrests for violent crimes. Such disparity in the shares of offenders and offenses reveals considerable heterogeneity in λ within the offender population.
Large variability—or heterogeneity—in individual offending rates has played a significant role in promoting policies to selectively incapacitate, typically for longer terms, only the smaller number of high-λ offenders. This same heterogeneity, however, also has important implications for existing estimates of the incapacitation effect. Although previous estimates have essentially assumed that inmates were like the average offender, heterogeneity in λ actually results in high levels of selectivity of high-λ offenders into prison.
It has been variously recognized that in the presence of λ heterogeneity, offenders in prison are not expected to be representative of all offenders (Chaiken, 1980; Blumstein et al., 1986). Even if all offenders face identical incarceration risks for each crime committed, and the criminal justice system does not seek to enforce any deliberate selective policies, high-λ offenders will be overrepresented among inmates. This greater stochastic selectivity of high-λ offenders into prison results purely from a process in which incarceration outcomes are stochastically determined. As λ increases, so does the expected number of crimes that an offender will commit, which in turn increases the risk that the offender is eventually incarcerated. For example, if the probability of incarceration per robbery is .01 for all offenders, an offender who commits robberies at an annualized Poisson rate of λ = 1 will evade incarceration during a year with probability .99, whereas an offender who commits robberies at rate of 100 per year will escape prison with the much lower probability of .37.
The bias toward high λ's among offenders sentenced to incarceration can be substantial. Blumstein et al. (1993) developed a
TABLE 7 Distribution of Robbery Rates While Free (λ) for Incoming Prison Inmates and for All Offenders In and Out of Prison
model to infer the distribution of λ for all offenders, based on the observed distribution of λ for an entering cohort of prison inmates, and applies it to data for convicted robbers in California, Michigan, and Texas prisons who participated in a study of self-reported crimes (Chaiken and Chaiken, 1982). The results show a strikingly consistent pattern across states (see Table 7).
In all three states, the distribution of λ inferred for all robbers is a mixture of three exponential distributions representing low-, medium-, and high-λ subpopulations of offenders. The low-λ subpopulation comprises about 90 percent of the total offender population who commit robberies at a mean rate of roughly 1 per year. By contrast, the high-λ group constitutes less than 1 percent of
TABLE 8 Mean Robbery Rates While Free (λ) for Incoming Prison Inmates and All Offenders
|
|
California |
Michigan |
Texas |
|
Imprisonment risk per robbery committed, Q |
0.0074 |
0.0139 |
0.0199 |
|
Overall mean annual robbery frequencies, λ |
|
|
|
|
Incoming inmates |
44.44 |
41.10 |
14.28 |
|
Total offender population |
3.22 |
2.85 |
1.29 |
|
Selectivity ratio [λ(inmates)/ λ(all offenders)] |
13.8 |
14.4 |
11.1 |
|
NOTE: Overall mean λ's are based on the λ distributions reported in Table 7. Results are extracted from Canela-Cacho (1990:Table 6.17). |
|||
the total offender population, but they commit robberies with a mean annual λ greater than 100. The medium-λ subpopulation contributes roughly 9 percent of the offender population and has a mean rate of about 10 robberies annually per offender.
Because of selection bias toward high-λ offenders, the participation of the three subgroups is drastically different among incoming inmates. Only half of incoming inmates come from the low-λ subpopulation, whereas members of the high-λ subpopulation represent 10 to 20 percent of incoming prisoners. Thus, high-rate offenders are overrepresented among inmates by 20 to 40 times their base rate in the total offender population. The impact of this stochastic selection bias toward the most active offenders is evident in the ratio of the average λ for imprisoned offenders to that for all offenders (Table 8): 13.8 for California, 14.4 for Michigan, and 11.1 for Texas. While incarcerated robbers in California, on average, commit 44.4 robberies pay year free, the mean rate for all robbers—including those who are rarely found among inmates—is just 3.2.
The implications for incapacitation of such selectivity are fully explored by Canela-Cacho (1990) and briefly summarized here. Although the homogeneous λ model of Avi-Itzhak and Shinnar
(1973) estimates I for the average offender in the population, the actual measure of interest is the average value of I across all offenders. We are interested in the average number of crimes prevented among all offenders, rather than the number of crimes prevented for an offender whose λ is equal to the population average.
It can be proved formally that unless λ is indeed constant across offenders, these alternative measures of I are not equal to one another (Canela-Cacho, 1990:Chapter 3). Whether or not their difference has any practical significance depends on the extent of the variability in λ. If the values of λ are tightly distributed around their mean, the two measures—though mathematically different—will approximate each other reasonably well. However, when the spread in the distribution of λ is of the magnitude revealed in inmate surveys, the selection bias toward high-rate offenders among inmates is sizable and I for the average offender seriously underestimates the desired average value of I across all offenders. In measuring incapacitation for robbery in California, for example, the homogeneous λ model of Avi-Itzhak and Shinnar (1973) assumes that since the average offender commits 3.22 robberies per year, every year that a robber spends incarcerated will prevent about 3.22 crimes. The fact that the average offender in prison would actually commit crimes at a rate 14 times higher is not accounted for.
Career Length (L)
Thus far, our discussion of incapacitation has ignored the possibility that some offenders in prison may have "retired" from offending and would not continue to commit crimes if they were released early from their prison terms.34 Confinement beyond the end of offending careers for such offenders yields no incapacitation benefits to society. The duration of offending careers is thus a variable that critically affects the incapacitation returns of imprisonment. If, on admission to prison, an offender's expected residual offending career is short and his sentence is comparatively long, chances increase that the offender will end offending before he is released, thus wasting scarce prison resources.35 The possibility of career termination lowers the expected number of crimes prevented per incarcerated offender and therefore reduces I.
Moreover, career termination could render incapacitation totally infeasible for a large number of offenders. Consider a case in which the vast majority of offenders have very short careers so
that an entire career consists of only a few crimes. Obviously, an offender's first crime can never be prevented through incapacitation, since incapacitation becomes an option only after the offender commits and is convicted of that crime. Given the generally low risk of incarceration for each crime committed, it is entirely likely that offenders would also evade imprisonment following their second and third offenses.
Hence, when the offender population has a high turnover rate, with offenders committing only a few offenses before they terminate offending and are replaced by other new offenders, it is increasingly likely that a fair number of offenders would be unaffected by incapacitation. Most careers would begin and end without interruption by the criminal justice system, and the capture of a small fraction of unlucky offenders who were about to end offending soon would reduce the crime rate only marginally.36
Although some offenders have careers that span only a few crimes, other offenders start offending early in their lives and continue well into adulthood. Several longitudinal studies have found that between 33 and 75 percent of all delinquent youths persist into adult criminality (Blumstein et al., 1986:Table 3-13). Adult arrest history data for arrestees in Washington, D.C., Michigan, and New York State show that individuals who are arrested at least once for a serious offense accumulate an average of five to six arrests per offender in these samples.37 Since only a small fraction of the crimes committed by offenders results in arrests—about 5 percent for robbery, aggravated assault, or burglary—the average number of crimes by these offenders is considerably higher.
Similarly, recidivism studies suggest that offenders have long rather than short careers. Most recently, for example, of 16,000 inmates released from state prisons, 62.5 percent were rearrested and 41.4 percent were recommitted to prison for a new offense within three years of their release. Among those who had served time for a violent offense, 30 percent were rearrested for another violent offense (Beck and Shipley, 1989:Table 9).
Some studies have explicitly estimated the average length of offending careers for different types of offense.38 These studies find that careers average 5 to 10 years in length, with violent offenders—those who commit at least one violent offense during their careers—having somewhat longer careers than nonviolent offenders. Earlier attempts to approximate the length of offending careers produced similar results (Greenberg, 1975; Greene, 1977; Shinnar and Shinnar, 1975).
Thus, although the efficiency of incapacitation is reduced by
career termination, which inevitably leads to some waste of prison resources from the standpoint of incapacitation, available empirical evidence on career length does not rule out incapacitation as a viable crime control strategy. Careers are sufficiently long to anticipate reasonable crime prevention from the incapacitation of some portion of the offender population.
Incapacitation Under Offender Heterogeneity and Finite Careers
Canela-Cacho (1990) generalizes the model of Avi-Itzhak and Shinnar (1973) to control simultaneously for the effects of offender heterogeneity and career termination. As in Avi-Itzhak and Shinnar, the generalized model assumes a Poisson distribution for the number of crimes committed by each offender with individual rate λi. The length of an offending career is modeled as an exponential random variable with a constant termination rate throughout the career. Furthermore, interactions between the criminal justice system and individual offenders are stochastic, following a homogeneous Bernoulli process: incarceration follows commission of a crime with probability Q independently of any prior outcomes, and time served (S) varies according to an exponential random variable. The expected time served per crime (QS) is assumed to be constant across offenders; thus the model excludes deliberate policies to selectively incapacitate high-rate offenders.
Unlike Avi-Itzhak and Shinnar, Canela-Cacho's model allows λi to vary across offenders. A continuous distribution that mixes several exponential distributions is used to represent this variability. Such mixtures are flexible enough to accommodate the high levels of skewness revealed in empirical studies of the distribution of λ, where the vast majority of offenders have low λ values, but a small subset of offenders generates crimes at unusually high rates.39
The model estimates the amount of time that an offender is expected to be both active and imprisoned—the only time when incapacitation occurs—as a function of the imprisonment policy parameters Q and S, and of the offending parameters λ and career length L. The incapacitation index I* is then computed as the ratio of the average number of crimes prevented to the average total crimes that would be expected if offenders were to remain free in the community.
Table 9 presents estimates of I* for robbery in California, Michigan, and Texas during the late 1970s. These figures are based on the distributions of λ reported in Table 7, and the values of Q and S in
TABLE 9 Estimates of the Percentage Reduction from the Potential Level of Robberies Resulting from Incapacitation in Prison Following a Robbery Conviction
|
|
California |
Michigan |
Texas |
|||
|
I*, heterogeneous λ |
30.1 |
41.3 |
27.8 |
|||
|
I, homogeneous λ |
4.7 |
7.8 |
5.3 |
|||
|
Incapacitative advantage, I*/I |
6.4 |
5.3 |
5.2 |
|||
|
NOTE: Estimates of the incapacitative effects, I and I*, assume (1) an average career length L of five years, (2) the λ distributions for all offenders reported in Table 7, and (3) the imprisonment sanction levels reported in Table 6. The estimates for homogeneous λ derive from the model in Shinnar and Shinnar (1975), with I = λ QSL/(S + L + λQSL), whereas those for heterogeneous λ are developed in Canela-Cacho (1990). |
||||||
Table 6. The I* estimates also assume an average career length of five years for robbery, which is consistent with the empirical estimates discussed above. To underscore the impact of the selection bias toward high-λ offenders that is induced by offender heterogeneity, Table 9 also includes estimates of the incapacitation effect, I, as measured by the Avi-Itzhak Shinnar model using the same sanction parameters, average career length, and mean λ that are applied in the computation of I*.
It is evident from Table 9 that the effect of stochastic selectivity on the estimated incapacitation effect is substantial. If offender heterogeneity and the resulting selection bias toward high-rate offenders among inmates are ignored, the Avi-Itzhak and Shinnar model seriously underestimates crime reduction from incapacitation. Once we account for offender heterogeneity, the reductions in robberies that result from incapacitation are anything but negligible: of every ten potential robberies, between three and four are prevented by the incarceration of some robbers. Alternatively, whereas in the case of homogeneous λ, the number of robberies committed would be expected to increase by only 5 to 10 percent from prevailing levels if offenders were fortunate enough to avoid incarceration,40 that increase when λ is heterogeneous would be from 39 to 70 percent.41 This result is all the more impressive in
light of an average time served (QS) of less than one month per robbery committed in the three states examined.42
The relationship between the composition of the offender population and incapacitation is also well illustrated by the variation in I* across states. Texas has the highest sanction level (QS = 0.0776), but the lowest incapacitation effect. Two factors contribute to this seemingly paradoxical outcome. First, the mean λ for robbery in the total offender population in Texas is less than half of that in California or Michigan (see Table 8). Second, even high-λ robbers in Texas commit crimes at lower rates than their counterpart high-λ offenders in either California or Michigan, and they comprise a smaller proportion of the total offender population (see Table 7). It is thus not surprising that more crimes are prevented for each robber incarcerated in California than in Texas. The incapacitation index measures the fraction of potential crimes that are averted through incarceration, and as shown by Cohen (1978), the less potential crime in a community, the smaller are the returns from incapacitation.
Remaining Sources of Bias in Incapacitation Estimates
Some important potential sources of measurement bias remain in the estimates of incapacitation reported so far. We discuss these factors briefly below and indicate the direction of the biases they may introduce. Unfortunately, the models and data currently available do not permit rigorous treatment of these biases. Nevertheless, existing knowledge provides some basis for speculating on whether or not these biases are likely to be sizable.
Relationship Between λ and Q. The estimates of incapacitation—both average and marginal—assume a risk of incarceration for each crime committed, Q, that is homogeneous across all offenders. Thus, the crimes of high- and low-λ offenders alike are assumed to be equally vulnerable to interception by the criminal justice system. Heterogeneity in λ coupled with homogeneity in Q leads to overrepresentation of high-rate offenders among prison inmates, which increases the incapacitation index considerably.43
If λ and Q were inversely related—so that high-rate offenders were more likely to escape imprisonment following commission of a crime—the selection effect toward high-λ offenders into prison would be attenuated or could even be reversed, with obvious negative consequences for incapacitation. Consider one extreme in which the most active offenders are completely invulnerable to arrest,
whereas one-time-only offenders are almost certain to be arrested. In this case, prisons would be filled with inactive offenders, and the most prolific offenders would escape incapacitation altogether.
Although empirical evidence on the relationship between λ and Q is far from conclusive, a negative association has been observed in which the probability of arrest following a crime seems to decrease as λ increases (Dunford and Elliott, 1984; Chaiken and Chaiken, 1984; Cohen, 1986; Greenwood and Turner, 1987; Blumstein et al., 1989). Ignoring this relationship will bias the I* estimates upward. There are good reasons, however, for believing that this bias is not likely to be sizable.
First, the same evidence that suggests a negative correlation between λ and Q clearly shows that an offender's overall risk of incarceration remains an increasing function of λ (Cohen, 1986:Table B-25). In other words, although Q may be lower for each crime committed by high-λ offenders, the number of crimes that these offenders commit is sufficiently large to compensate for any reduction in Q, so that high-λ offenders still have a greater probability of eventually being incarcerated during a period of, for example, one year. Thus, although the magnitude of stochastic selectivity toward high-rate offenders is diminished, it is not completely eliminated.
Second, for the type of skewed λ distributions revealed in empirical studies, Canela-Cacho (1990:26-32) found that the crimes of low-λ offenders would have to be about 200 times more vulnerable to incarceration than the crimes of high-λ offenders before stochastic selectivity would reverse. Nothing in the available evidence suggests differentials in Q of this order of magnitude. For example, among inmates who participated in the second Rand survey, Blumstein et al. (1989) estimated that offenders who committed robberies at rates of less than 3 per year were 5 to 15 times more vulnerable to arrest per crime than those with frequency rates in excess of 100 robberies per year. Cohn (1986:Table B-25) estimates a similar differential in arrest risk per crime between high- and low-λ offenders in data from the National Youth Survey of a general population sample. Simulations in Canela-Cacho (1990) show that the stochastic bias toward high-rate offenders in prison remains sizable for differences of Q in this range, provided the distribution of λ is fairly skewed.
Finally, although the probability of arrest per crime is a decreasing function of λ, the probability of incarceration given arrest is not. An offender's prior record weighs heavily in a judge's decision to sentence a convictee to prison. Both the length and
the seriousness of past recorded offenses increase the likelihood of a sentence to prison (Blumstein et al., 1983). Because high-rate offenders who remain active for long periods of time are also most likely to accumulate a prior record, it would appear that the probability of incarceration given arrest increases with λ. Thus, the range of variation in Q between high- and low-λ offenders is smaller than might be suggested by the difference in the probabilities of arrest for these two groups of offenders.
Diversity of Offending Behavior The computation of I* for robbery, when calculating crimes prevented, includes only periods of incarceration resulting from robberies and does not account for the possibility that a ''robber" could also break into a house, murder someone, or steal an automobile. Obviously, an offender who commits five robberies and three burglaries per year has a higher risk of entering prison than does an offender who commits five robberies and no other crimes. Thus, it is the total offending rate, including all crime types, that ultimately determines the fraction of a career that an offender spends in prison.
Numerous studies have looked at the issue of offender specialization in various types of crime. Overwhelmingly, the evidence indicates that exclusive specialization in any one crime type is virtually nonexistent. However, as Farrington (1982:178) concluded after reviewing the literature, "some degree of specialization [is] superimposed in a high degree of generality." So for example, Chaiken and Chaiken (1984) found a group of offenders they labeled "violent predators" who commit robbery, assault, and drug dealing at high rates. Some of these offenders, however, also regularly commit other offenses such as burglary, theft, and credit card fraud.
Although the label "violent offender" is inexact because few offenders engage exclusively in crimes of violence, it provides a useful way to distinguish offenders with some violent offenses from those who never commit violent crimes. In this respect, some interesting findings have been replicated in various studies. Violent offenders appear to have higher mean offending rates across all crime types than do nonviolent offenders. In a sample of juvenile offenders, Farrington (1978) observed that while nonviolent delinquents averaged 2.7 convictions, violent delinquents averaged 4.3. Similarly, for a cohort born in 1958 in Philadelphia, Piper (1985) found that among male delinquents, violent offenders average 4.2 arrests compared to 1.2 for nonviolent offenders. Perhaps more surprisingly, Piper also observed that although violent
delinquents represented 32 percent of all offenders, they accounted for 57 percent of all offenses.
The relationship between overall offending levels and violent offending is particularly striking among male delinquents in a 1945 Philadelphia cohort. Offenders with five or more recorded police contacts of any type—violent or nonviolent—were responsible for the vast majority of violent crimes: 71.4 percent of all homicides, 72.7 percent of all rapes, 81.8 percent of all robberies, and 69.1 percent of all aggravated assaults (Weiner, 1989:Table 2.16). Although somewhat attenuated, the same pattern was also found for the 1958 Philadelphia cohort.44
The relationship between violent and nonviolent crimes is of paramount importance for incapacitation purposes. A nonviolent offense committed with high frequency by a violent offender can lead to incarceration, which serves just as well to incapacitate violent offending as does incarceration for violent offenses. As a matter of fact, Chaiken and Chaiken (1984) found that among inmates who participated in the second Rand survey, many of the so-called violent predators were currently serving time for a nonviolent offense, often burglary. So, even if individual offenders commit rape or homicide only rarely, incapacitation levels for these offenses can still be substantial if these offenders end up spending a large fraction of their careers behind bars as a result of other crimes they commit at much higher rates.45
Estimates of incapacitation based only on offending rates and incarceration for one type of violent crime, such as robbery, are biased downward because they underestimate the total amount of time that an offender serves in prison throughout his entire career. In this respect, the I* estimates for robbery presented in the previous section should be considered conservatively low.
DETERRENCE AND INCAPACITATION
All previous estimates of incapacitation ignore the possibility that actual or threatened incarceration might alter individual propensities to commit crime. Largely for reasons of tractability, dynamic changes in offending have been ignored. The failure to address adaptive behavioral responses by offenders is especially problematic for estimates of incapacitation that are cast in terms of the proportional reduction from the potential level of crimes if incarceration were to be eliminated entirely.
Critics have rightly pointed out that even the customary estimates of the potential level of crimes at zero incarceration are
themselves influenced by prevailing sanction levels. In particular, the rate at which offenders have been observed to commit crimes while they are free, λ0 (e.g., in offender self-reports), is influenced by the sanction risks, Q0S0, that those offenders faced while they were free. If sanctions were to change markedly from prevailing levels, it would be reasonable to expect corresponding changes in offending rates while free and thus changes in the base level of potential crimes from which incapacitation is measured.
Although changes in λ constitute a genuine cause for concern, existing estimates of incapacitation are not completely without value. In acknowledging the potential role of sanctions in determining the base level of crimes, incapacitation is measured not against a standard of crimes when incarceration is totally absent, but rather against the level of crimes that would be expected if, despite the prevailing level of sanction risks, offenders were to remain free. The base offending level, λ0, is the rate at which an offender commits crimes conditional upon the prevailing risk of incarceration Q0S0. In an expected utility formulation, λ0 might be regarded as the rate of offending at which the expected benefits from crime equal the expected costs from incarceration for those crimes.
The estimates of incapacitation discussed in this paper should be interpreted in this way. So, for example, the 41.3 percent reduction in crime in Michigan (Table 9) is not the reduction from the expected level of crime if Q0S0 were reduced from 0.0514 (Table 6) to zero in Michigan. Rather, it is the reduction from the level of crime that would be expected if offenders were fortunate and avoided incarceration despite a prevailing expected time served per robbery of 0.0514 year. Such conditional estimates are useful for gauging the relative magnitude of crime reduction from incapacitation in static comparisons across jurisdictions with different prevailing values of λ0 and sanction policies, Q0S0, and for assessing the likely impact of short-term marginal changes from Q0S0. They are less well suited, however, for analyzing the impacts of substantial long-term shifts in policy, such as those observed in recent decades in the United States.
Deterrence effects that alter the size of the active offending population, the offending rates of active offenders, or the duration of offending careers will have important implications for the magnitude of crime reduction that derives from incapacitation. Because they affect the potential crime levels against which incapacitation effects are measured, decreases in the general level of offending also reduce the incapacitative effect. Although deterrence
and incapacitation both contribute to crime control, they interact in complex ways, and under some circumstances their effects are negatively correlated.
When offenders are faced with a higher expected time served in prison—whether from increases in the certainty (Q) or the severity (S) of prison terms for the crimes they commit—the following behavioral responses are possible:
-
Some offenders may reduce their offending frequencies (λ) in an effort to restore their overall incarceration risk to previous levels.
-
Other offenders might regard the increased criminal sanctions as sufficiently severe that they withdraw from crime altogether.
-
Some individuals who would have embarked on offending careers under previous sanctioning levels may refrain from crime because of the increased penalties.
In each case, the deterrence effects on individual offending will reduce the expected total volume of crime that is susceptible to incapacitation by depressing individual offending frequencies, reducing the number of active offenders, or both.46
As noted above, the smaller the total crime base is, the lower the returns from incapacitation will be. Thus, large deterrent effects would reduce the opportunities for incapacitation and result in lower incapacitation levels. In the extreme, if deterrent effects were completely successful in dissuading all offenders from further criminal involvement, prisons would have zero incapacitation returns.47
Estimates of the reduction in crime and increase in prison population following the introduction of tougher criminal sanctions that disregard deterrent effects and refer only to incapacitation suffer from a double distortion. On the one hand, the number of crimes prevented is underestimated because no correction is made for those crimes that offenders preemptively abandon in response to the threat of prison. On the other hand, prison population growth is overestimated because no adjustments are made for reductions in the offender population or in offending frequencies that the stiffer penalties induce.
The magnitudes of these biases depend critically on the extent to which deterrent effects are realized. Although it is virtually undisputed that criminal sanctions do deter some crime, there is considerable uncertainty about the size of these effects, particularly the marginal effects as criminal sanctions change within a
reasonably small range.48 Available estimates of the deterrence elasticity are generally in the range of -0.2 to -1.0 percent reductions in crime associated with a 1 percent increase in sanction levels.49 These estimates are used here only as suggestive of the possible magnitude of deterrence effects.
Exploratory Estimates of Deterrence Effects
We use the following procedure to distinguish the relative magnitudes of the deterrence (D) and incapacitation (I) effects associated with a change in imprisonment policies. From an initial base level of sanctions and crimes—with total offenders N0, average individual offending rate λ0, and expected time served per crime Q0S0—the potential number of crimes committed is C0 = λ0 * N0.50 An increase in imprisonment sanctions to Q1S1 is assumed to operate through deterrence to reduce both the size of the offender population and the average offending rate, and yields a new potential number of crimes, C1 = λ1 * N1.51 Incapacitation from Q1S1 then operates to reduce potential crimes C1 to the expected number of crimes actually committed, O1, where O1 is estimated by using the model of incapacitation under offender heterogeneity and finite careers, I*, described earlier.
The deterrence and incapacitation effects of a change in sanctions from Q0S0 to Q1S1 are given by
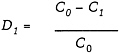
(2a)
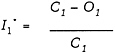
(2b)
where D1 is the deterred portion of potential crimes and I1* is the incapacitated portion of the remaining undeterred crimes. Total crime reduction (R1) from C0 as a result of the increase from Q0S0 to Q1S1 is
(3)
By substituting equation (2a) and (2b) into equation (3), R1 can be written as
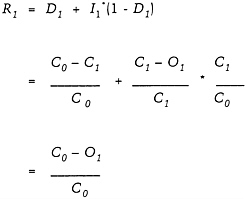
(4)
In equation (4), the expression
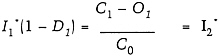
represents the incapacitated portion of the original potential level of crimes, C0. Although the magnitues of D1 and I1 * cannot be compared directly to one another because of the different base crime levels, C0 for D1 and C1 for I1 *, D1 and I2 * are comparable, and indicate the relative portions of C0 crimes that are deterred and incapacitated, respectively. The analyses of crime control effects that follow will rely on D1 and I2 *.52
Sanctions are assumed to be uniform for all offenders, but we allow for variation in offender taste for risk by contrasting three alternative deterrence scenarios: one in which deterrence operates equally on all offenders, a second in which only low-λ offenders are deterred, and a third in which only high-λ offenders are deterred. Under scenario 2, only the least committed, marginal offenders are deterred, whereas under scenario 3, only the worst offenders are deterred. The latter might occur, for example, if high-rate offenders are more aware of and responsive to changes in sanctions.
Values of the offending and sanction variables are chosen to closely resemble actual values estimated for violent crimes in the United States during the mid-1970s and end of the 1980s (see Table 10). The distribution of robbery offending rates estimated for all offenders in Michigan in the mid-1970s (Table 7) is used as the initial distribution of offending rates. Imprisonment sanctions are based on the numbers of inmates and total crimes for serious violent offenses in the United States in 1975 and 1989.53
TABLE 10 Estimated Offending Rates and Sanction Levels for Violent Crimes in the United States, 1975 and 1989
|
|
Low-λ Offenders |
Medium-λ Offenders |
High-λ Offenders |
Total Offenders |
|
Mean annual offending rate while free, λ0 |
1.4 |
8.9 |
239.0 |
2.8 |
|
Percentage of offenders in each offender group |
93.3 |
6.3 |
0.4 |
100.0 |
|
Average career length (years) |
10.0 |
10.0 |
10.0 |
10.0 |
|
Imprisonment risk per crime |
|
|
|
|
|
Q0 |
0.0068 |
0.0068 |
0.0068 |
0.0068 |
|
Q1 |
0.0123 |
0.0123 |
0.0123 |
0.0123 |
|
Average years served in prison |
|
|
|
|
|
S0 |
2.5 |
2.5 |
2.5 |
2.5 |
|
S1 |
4.0 |
4.0 |
4.0 |
4.0 |
|
Expected years served per crime |
|
|
|
|
|
Q0S0 |
0.0170 |
0.0170 |
0.0170 |
0.0170 |
|
Q1S1 |
0.0492 |
0.0492 |
0.0492 |
0.0492 |
|
NOTE: Offending rates are those estimated for robbery among all offenders in Michigan during the mid-1970s (Table 7). Imprisonment sanctions Q0S0 correspond to the year 1975, and Q1S1 to 1989. |
||||
Table 11 reports the resulting estimates of deterrence and incapacitation effects under the assumed model. Estimates are obtained by using deterrence elasticities of -0.2 and -1.0 for each scenario. In this illustration, deterrence effects increase monotonically with the contribution of piλi to the overall mean λ0 = ∑pjj (with high-λ offenders contributing less than low-λ offenders, Phiλhi < ploλlo, who in turn contribute less than the total population of offenders, p loλlo < λ0). Naturally, D is also increasing monotonically, but at a decreasing rate, for larger deterrence elasticities
TABLE 11 Percentage Reduction from Potential Violent Crimes Due to Incapacitation and Deterrence Under Alternative Deterrence Scenarios
|
|
Deterrence |
Incapacitation |
Total |
|
|
|
D1 |
I2 * |
I1 * |
D1 + I2 * |
|
Base level crime reduction at Q0S0 |
0.0 |
32.9 |
32.9 |
32.9 |
|
Crime reduction at Q1S1 No deterrence |
0.0 |
41.9 |
41.9 |
41.9 |
|
Deter high-λ offenders |
|
|
|
|
|
Elasticity = -0.2 |
11.9 |
30.8 |
34.9 |
42.7 |
|
Elasticity = -1.0 |
30.2 |
14.0 |
20.1 |
44.2 |
|
Deter low-λ offenders |
|
|
|
|
|
Elasticity = -0.2 |
15.8 |
40.2 |
47.7 |
56.0 |
|
Elasticity = -1.0 |
40.1 |
38.3 |
63.9 |
78.4 |
|
Deter all offenders |
|
|
|
|
|
Elasticity = -0.2 |
34.7 |
26.0 |
39.8 |
60.7 |
|
Elasticity = -1.0 |
88.1 |
3.8 |
31.9 |
91.9 |
|
NOTE: Crime control effects are obtained from the offending and sanction levels reported in Table 10. Reductions are from the potential number of crimes C0 = λ0N0 that prevail at initial sanction levels Q0S0 = 0.017 (i.e., after the base level of deterrence from sanctions Q0S 0). (The deterrence effect from the base level of potential crimes is unknown and treated as zero.) |
||||
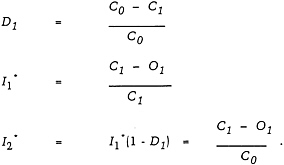
Deterrence from the new sanction level Q1S1 reduces the potential level of crimes to C1 = λ1N1 by discouraging participation in crime (N1 < N0) and inhibiting the frequency of crimes committed by active offenders (λ1 < λ0). Incapacitation I2 * at sanction level Q1S1 further reduces potential crimes C1 to the expected number of crimes actually committed, λ1 * < λ1. The more commonly used measure of incapacitation, I1 *, reports the incapacitation effect relative to the new undeterred level of potential crimes, C1 = λ1N1.
in this illustration, a fivefold increase in absolute magnitude for the deterrence elasticity, -1.0/(-0.2), results in only a 2.54-fold increase in crime reduction from deterrence.
The exploratory analysis manifests an interesting interaction between D and I in which the incapacitation effect is not monotonic and depends instead on how deterrence alters the distribution of offending rates. When deterrence reduces the representation and mean λ's of low-λ offenders, high-λ offenders become a greater share of the new offending distribution, and incapacitation effects are large. Deterrence of high-λ offenders has exactly the opposite effect by reducing the high end of the λ distribution. It is important to note that D and I are not necessarily inversely related. When deterrence increases the concentration of high-λ offenders, incapacitation effects will also increase. As deterrence effects become more widely spread throughout the offender population, however, incapacitation effects decline.
Under the "no-deterrence" or "deter high-λ" scenarios in Table 11, the new sanction level Q1S1 is associated with total crime reduction in the range of 42 to 44 percent of λ0N0 crimes prevented. Reflecting the decreasing marginal returns from increasing sanctions, the increment above the 32.9 percent crime reduction from incapacitation already achieved at Q0S0 is small, especially in view of the very large increase in QS. More substantial incremental crime reduction that is similar in magnitude to the almost tripling in imprisonment sanctions between 1975 and 1989 requires large deterrence effects—an elasticity of -1.0—that apply broadly throughout the offender population.54
Whereas Table 11 presents the reduction in crimes relative to their potential level, we are also interested in how these crime control mechanisms affect the expected number of crimes that are actually committed. Along with observed changes in crimes and inmates, Table 12 shows the changes in crimes and inmates that would have been expected from the combination of deterrence and incapacitation, as modeled here, if observed changes in incarceration policies between 1975 and 1989 had been applied to offending levels that prevailed in the mid-1970s. Although the observed number of inmates nearly tripled (increasing by 188%) between 1975 and 1989, the observed number of violent crimes remained virtually unchanged (-1.1% in Table 12). None of the deterrence scenarios examined in Table 12 satisfactorily replicates this observed pattern in crimes and inmates. Instead, under the model analyzed here, we see that deterrence and incapacitation would have combined to transform an almost threefold increase
TABLE 12 Percentage Change in Numbers of Inmates and Crimes Actually Committed Under Alternative Deterrence Scenarios for Violent Offenses in the United States, 1975 to 1989
The number of inmates by crime type each year is estimated from the crime type distribution available from national surveys of state prison inmates in 1974 and 1986 (National Prisoner Statistics, 1976; Bureau of Justice Statistics, 1988) applied to total counts of inmates with sentences of one year or longer reported for state prisons in 1975 and 1989 (Bureau of Justice Statistics, 1990a; Flanagan and Maguire, 1990). State prison inmates are combined with annual data on the crime-type mix of inmates held in federal prisons (Callahan, 1986; Flanagan and Maguire, 1990).
Expected changes in crimes committed and in inmate population are relative to observed levels in 1975, and are associated with the changes in sanctions from Q0S0 to Q1S1 observed between 1975 and 1989 (see Table 10). All estimates derive from the model of deterrence and incapacitation specified in equations (2) and (3) and in note 51.
in imprisonment sanctions during recent years into substantial reductions from 1975 crime levels and smaller changes from the 1975 prison population.
Among the scenarios in Table 12, the two that come closest to observed rates involve either no deterrence or deterrence that operates narrowly on a very small subgroup of high-λ offenders. In the no-deterrence case, individual offending is not affected by deterrence, and potential violent crimes in 1989, λ1N1, would be identical to the base level of potential crimes in 1975, λ0N0. The increases in imprisonment sanctions, from Q0S0 to Q1S1, nevertheless, would have been expected to reduce observed crimes by 13.4 percent through increased incapacitation. If high-λ offenders were deterred by the increased imprisonment risk, slightly more crimes would have been prevented at a somewhat smaller cost in terms of increased inmates.
The other deterrence scenarios explored in Table 12 would have resulted in substantially greater crime reduction. Under the most generous deterrence assumptions—in which a deterrence elasticity of -1.0 reduces offending rates and offender numbers for most of the offending population (i.e., deter low-λ or deter all offenders)55—reductions in violent crimes of more than 65 percent from 1975 levels would have been accompanied by reductions in prison populations as fewer offenders remained active and their offending rates declined.
The near stability in crimes actually committed (which declined by only 1.1% from 1975 to 1989), despite the substantial increase in prison population (up 188.3%), is not compatible with large deterrence effects that reduced the underlying potential level of offending between 1975 and 1989. Furthermore, even in the absence of deterrence, the incapacitation effects from the observed increase in imprisonment would have reduced the number of crimes committed somewhat below the level observed in 1989 (crimes down 13.4% instead of only 1.1%). It is possible, however, that substantial crime control from deterrence and incapacitation actually did occur through a reduction in ''phantom crimes" (i.e., crimes that would have been committed were it not for the deterrent and incapacitation effects associated with the increase in imprisonment sanctions from Q0S0 to Q1S1). Thus, the increased imprisonment between 1975 and 1989 could have contained an otherwise escalating level of offending due to factors independent of sanction levels, such as demographic changes in the population or a worsening of criminogenic factors.
Tables 13 and 14 illustrate such a process for two hypothetical
TABLE 13 Percentage Change in Numbers of Inmates and Crimes Actually Committed Under Alternative Deterrence Scenarios in Which Underlying Potential Levels of Offending for Violent Offenses in the United States Increased Between 1975 and 1989
|
|
Crimes |
Inmates |
|
Observed 1975 count (millions) |
2.9 |
0.1 |
|
Observed percentage change from 1975 to 1989 |
-1.1 |
+188.3 |
|
Expected percent change at new sanction level, Q1S1 in 1989 |
|
|
|
New mean λ0* = 7.5 |
|
|
|
Deter high-λ offenders, elasticity = -1.0 |
+3.8 |
+200.0 |
|
Deter low-λ offenders, elasticity = -0.2 |
+2.1 |
+195.3 |
|
New mean λ0* = 10.0 |
|
|
|
Deter high-λ offenders, elasticity = -1.0 |
+4.5 |
+201.9 |
|
Deter low-λ offenders, elasticity = -0.2 |
+3.5 |
+199.4 |
|
NOTE: The numbers of serious violent offenses committed and inmates held in prison for violent offenses in 1975 and 1989 are obtained as noted in Table 12. The original base level of offending averages λ0 = 2.8 for N0 offenders (Table 10). The hypothesized new higher offending rates result from a shift to greater representation of high-λ offending and a higher average λ0 for high-λ offenders at time t1. Expected changes in crimes committed and in inmate population are relative to levels observed in 1975, and are associated with the changes in sanctions from Q0S0 to Q1S1 observed between 1975 and 1989 (see Table 10). All estimates derive from the model of deterrence and incapacitation specified in equations (2) and (3) and in note 51. |
||

scenarios of increases in the potential level of offending in 1989—one in which the overall mean rate of violent offending increased from λ0 = 2.8 in 1975 to λ0* = 7.5 in 1989, and the other with λ0* = 10.0.56 The results in Table 13 show that both hypothesized distributions of an increase in potential offending in 1989 are capable of reasonably reproducing the observed trends of a near zero change in crimes and a tripling in inmates between 1975 and 1989. We see in Table 14 that the observed offending levels in 1989 might result from very different deterrence scenarios—one involving a substantial deterrence effect of the high-λ offenders, and the other involving only modest deterrence of low-λ offenders but substantial incapacitation from incarceration of the new higher-λ offenders.
Under both scenarios, even if imprisonment sanctions had remained at 1975 levels of Q0S0, the crime reduction from the new potential level of crimes due to incapacitation would be substantial—60 to 69 percent. This reflects the increase in incapacitation associated with higher crime rates. Thus, if sanction levels were to continue at Q0S0, the dramatic increases in underlying offending rates that are explored (up 168% from 2.8 to 7.5, or up 257% from 2.8 to 10.0) would have resulted in just 61 to 66 percent more crimes expected in 1989 than were actually observed.57 Although the relative mix of deterrence and incapacitation effects varies over the alternative deterrence scenarios examined in Table 14, the increase in total crime reduction expected from the increment in sanctions to Q1S1 is only 8 to 15 percentage points above the base-level incapacitation effect.
It is especially noteworthy that the estimated crime reduction under a no-deterrence scenario in Table 14 (e.g., 70% for λ0* = 7.5) is very close to the total crime reduction achieved under either deterrence scenario (e.g., 75% for λ0* = 7.5). The same similarity in total crime reduction is also observed for the most likely deterrence scenarios in Table 11 (no-deterrence and deter high-λ offenders). Although the naive estimate of incapacitation that simply applies new sanctions Q1S1 to the previously prevailing offending level λ0N0 may overstate the actual incapacitation effect when there is substantial deterrence, it nevertheless provides a remarkably good estimate of the total crime reduction associated with a major shift in sanction levels. Prior concerns that incapacitation estimates seriously understate crime reduction when they ignore deterrence effects seem to be unwarranted.58
Remaining Sources of Bias in Deterrence Estimates
The exploratory model of deterrence that we use permits the widest possible deterrence impacts in response to sanction changes. Deterrence effects are assumed to derive equally from changes in either Q or S, and to have the same effects on both offending rates (λ) and the size of the offender population (N). Extensions to this model might selectively reduce the scope of deterrence effects, perhaps differentiating between the effects of changes in certainty and of those in severity, or limiting deterrence effects to changes in either N or λ. Any of these changes would reduce the total deterrence effect estimated above, but would not alter the main results.
A more interesting variant of the deterrence model would permit heterogeneity in deterrence effects across offenders. The model that we use does not vary sanction levels across offenders, but rather permits differential responsiveness of offenders to the same sanction level. We have incorporated such heterogeneity to a limited extent by selectively restricting the deterrent impact to one or another of the main λ subpopulations. The differences in impacts for the "deter high-λ" and "deter low-λ" cases were especially useful for illustrating how the partition between deterrence and incapacitation is influenced by changes in the relative representation of high-λ offenders resulting from deterrence.
Deterrence of high-λ offenders decreases both their mean and their relative representation in the population of offenders, thereby reducing the incapacitative effect below that obtained in the absence of deterrence. When the same deterrence impact is restricted to low-λ offenders, the relative representation of high-λ offenders increases, as does incapacitation's share of total crime reduction. An alternative deterrence model might provide for greater heterogeneity, with the deterrence impact varying as a function of λ. We can anticipate from the above results that cases in which the deterrence impact is a decreasing function of λ will experience the smallest losses in incapacitation effect. Such a scenario seems to be the most likely behavioral outcome, involving greater deterrence effectiveness in reducing offending at the margins (which are dominted by low-λ offenders), rather than among the most active, high-λ offenders.
POLICY CHOICES IN EXPANDING INCARCERATION
The costs and benefits of expanding incarceration beyond current levels are now considered. This is a particularly relevant policy question at a time when there seems to be broad consensus among policy makers and the public in favor of controlling rising crime rates through increased use of incarceration, but when there are serious resource constraints on available prison capacity.
To achieve higher levels of incapacitation, policy makers may increase either Q or S. For example, one option would increase the fraction of convictees who are sentenced to prison, thereby raising Q. Alternatively, the fraction of convictees committed to prison might remain constant, but those going to prison would be sentenced to longer terms, which would increase S. Of course, mixed strategies that simultaneously increase both Q and S are also possible, and the policy choice is then to specify the desired balance between broadening the offender base that goes to prison and lengthening prison terms.
Assessing incapacitation effects by analyzing the criminal histories of a sample of convictees in the Denver area, Petersilia and Greenwood (1978) found some evidence to suggest that a policy of short sentences applied to a large offender base is more efficient than a policy of long sentences applied to a small offender base. For example, they estimated that if all convictees in their sample had been given prison terms of one year, regardless of their prior criminal records, the crimes generated by the cohort would have been reduced by 15 percent at a cost of a 50 percent increase in prison population. In contrast, they found that mandatory minimum prison terms of four years imposed only on convictees who had a prior felony conviction would have resulted in the same reduction in crime, but at a cost of a 150 percent increase in the size of the prison population.
From the perspective of the separate contributions of λ and career termination to total offending, the findings of Petersilia and Greenwood are to be expected. The differential impact of Q and S on incapacitation derives fundamentally from career termination. The value of Q is critical in determining how early in an offender's criminal career incapacitation begins to operate. When Q is very small, offenders can be expected to commit numerous crimes before they are caught and incapacitated, and some offenders may survive their entire careers without a single criminal justice system intervention. As Q increases, the number of crimes before an offender's first conviction declines, so a larger Q results
in earlier incapacitation following the onset of an offender's criminal career.
Incapacitation is also an increasing function of S, with long sentences preventing more crimes than short sentences. Long sentences, however, reduce the efficiency of prison resources. As time served increases, so does the expected fraction of the inmate population whose criminal careers end before they are released from prison. Thus, long sentences add to the size of the prison population, but often at the cost of increasing the number of inmates who are no longer criminally active, thereby reducing the incapacitation gains from the added inmates.
In the face of constraints on available prison resources, the problem for criminal justice policy is how to allocate a finite number of cells among competing offenders. Ideally, one would like to have the worst active offenders occupy those cells. This is precisely the motivation behind incapacitation policies that would deliberately select some offenders for enhanced sentences based on assessments of their future crime potential. Such a selective strategy also has initial appeal as a sensible response to deterrence impacts that are likely to be decreasing functions of λ. By selectively increasing Q and S as λ increases, it might be possible to offset expected declines in deterrence among the most active offenders. However, prevailing difficulties with accurately identifying the worst offenders and predicting when their careers will end, seriously limit the feasibility of such deliberate selective incarceration policies.59
The analysis of offending careers presented here indicates that even uniformly applied imprisonment policies, which make no explicit attempt to distinguish among offenders, will result in disproportionately large portions of high-λ offenders in prison. The resulting stochastic selectivity derives essentially from a form of self-selection in which offenders increase their opportunities for incarceration through the number of crimes they commit. Even if time served on each sentence is relatively short, high-λ offenders will nevertheless spend substantial portions of their careers incarcerated through the many more returns to prison that they experience.
Considerations of likely deterrence effects also favor a policy of uniformly applied imprisonment sanctions. Selection of the most active offenders into prison by explicitly varying QS to be an increasing function of λ may not be optimal. Although high-λ offenders are targeted for increased incarceration, lower QS values for low-λ offenders may have the perverse effect of increasing
their levels of offending (Cook, 1986). Uniform imprisonment sanctions may actually achieve an optimal mix of crime reduction by maximizing the deterrence effects on the much larger population of low-λ offenders merely by maintaining a credible threat of incarceration, while simultaneously maximizing the incapacitative effects of limited prison resources through the naturally occurring stochastic selection of high-λ offenders into prison that results from their much higher rates of offending.
Furthermore, considerations of career termination strongly favor a policy of uniform increases in Q over corresponding changes in S. To illustrate the different impacts of Q and S, we estimated the percentage changes in crime reduction through incapacitation and in the size of the prison population that would result from a 50 percent increase in either Q or S above the base levels prevailing for robbery in the late 1970s (separate deterrence effects are not addressed here). The λ distributions remained the same as those reported in Table 7, and average career lengths continued to be five years. Only the saction variables Q and S were changed from the base values in Table 6. The results are reported in Table 15.
The cost-benefit ratio of changes in prison population relative to changes in crime reduction (in the last row of Table 15) indicates that further reductions in crime do not come cheaply, since prison populations grow at faster rates than crime reductions. Although this imbalance alone does not imply that expanded use of incarceration is unwarranted, it does raise concerns about the relative crime reduction returns of alternative policies. It is evident from Table 15 that increments in Q, the risk of incarceration per crime, are more efficient in enhancing incapacitation than the same increments in S.
The superiority of Q over S as a policy variable derives primarily from the benefit side of incapacitation. The growth in prison population is almost the same whether we increase Q or S. However, twice as much crime is prevented from a 50 percent increase in Q than from the same increase in S. These results strongly contradict the prevailing tendency to increase punitiveness by increasing time served that is evident in the widespread increases in S observed across states and crime types in Table 4.
To a large extent the tendency to increase time-served reflects important political dimensions of the sanctioning process. First, increasing time-served penalties for convicted offenders is readily obtained—at least symbolically, if not in fact—through statutory revisions and does not require improvements in the processing
TABLE 15 Percentage Increase in Crime Reduction from Incapacitation and in the Size of Prison Population Accompanying a 50 Percent Increase in Incarceration Sanctions for Robbery
|
|
Increase in Imprisonment Risk per Robbery, Q |
Increase in Average Years Served per Prison Commitment, S |
||||
|
|
Calif. |
Mich. |
Tx. |
Calif. |
Mich. |
Tx. |
|
Percentage increase in crime reduction from incapacitation, I* |
15 |
10 |
16 |
8 |
5 |
8 |
|
Percentage increase in prison population size, P |
40 |
39 |
41 |
45 |
45 |
46 |
|
Cost-benefit ratio, P/I* |
2.6 |
3.9 |
2.6 |
5.6 |
9.0 |
5.8 |
|
NOTE: Estimates of the crime reduction and prison population increases arising from incapacitation (and ignoring deterrence) assume (1) an average career length of five years, (2) the λ distributions for all offenders reported in Table 7, and (3) the imprisonment sanction levels reported in Table 6. Results are extracted from Canela-Cacho (1990:Tables 7.6 and 7.7). |
||||||
capabilities at various stages of the criminal justice system. Changing the statutes governing time served are a highly visible means of "getting tough on criminals." This also represents a policy that can be adopted with no immediate consequences since costs are delayed until the full impact of longer time served is felt years later in a buildup of the prison population.
Increments in Q, by contrast, are generally very difficult to attain through legislation alone. Q is usually small because the risk of arrest following a crime is low. Only about 5 robberies out of every 100 committed result in arrest. The risk of arrest per burglary is even lower at only three arrests for every 100 burglaries committed. Significant increases in Q would require immediate financial outlays to provide more police and investigation resources, more prosecutors, more criminal court judges, and more pretrial detention space. In the long run, however, greater crime reduction from incapacitation can be achieved at a lower cost by emphasizing the certainty of incarceration rather than its severity.
TABLE 16 Mean Robbery Rates While Free Among Offenders In and Out of Prison
|
|
California |
Michigan |
Texas |
|
Original incarceration levels: |
|||
|
All offenders |
3.2 |
2.9 |
1.3 |
|
Incoming inmates |
44.4 |
41.1 |
14.3 |
|
Resident inmates |
16.2 |
13.7 |
5.0 |
|
Increased incarceration: |
|||
|
Additional resident inmates from 50% increase in Q |
6.1 |
3.5 |
1.9 |
|
Additional resident inmates from 50% increase in S |
2.9 |
1.5 |
0.9 |
|
NOTE: Estimates of mean λ's assume (1) the λ distributions reported in Table 7, (2) an average career length of five years, and (3) the imprisonment sanction levels reported in Table 6 for the original base case. |
|||
Whether changes occur in Q or S, increases in QS will increase incapacitation by raising the prison population. Offender heterogeneity, however, results in decreasing marginal returns from incapacitation as QS increases. Just as the inmate population contains a disproportionately large share of high-λ offenders, the population of free offenders contains a disproportionately large share of low-λ offenders. Thus, as the prison population grows as a result of tougher sentencing policies, it does so by extending incarceration to offenders whose average λ is lower than that of existing inmates.
The decline in λ with increasing incarceration is illustrated in Table 16, which again relies on cases of 50 percent increases in either Q or S. In addition to the mean offending rates for all offenders and for incoming inmates reported in Table 8, Table 16 includes mean λ's for a daily census of resident inmates and for the new inmates who would be added to the prison population from the increase in Q or S.60
We see that as the size of the prison population grows in Table 16, the average number of crimes prevented per inmate declines. In Michigan, for example, whereas resident inmates
under the original sanction policies would commit on average almost 14 robberies per year if they were free, the average λ for inmates who are added to the prison population by a 50 percent increase in Q is less than 4 robberies per year free. When S is increased, which also increases the number of inmates who will terminate offending careers before they are released, new inmates would average only 1.5 robberies per year if they were to remain free. As QS increases, the mean λ for new inmates declines.
The decreasing marginal returns from incapacitation must be explicitly considered when evaluating the potential for further crime reduction from more punitive sentencing policies. In particular, the mean λ found among existing inmates cannot be applied to the new inmates that result from expanding incarceration. Failure to adjust properly for lower λ's found among free offenders will result in gross overestimates of potential additional crime reduction.61
CONCLUSION
This paper has examined the substantial increases in imprisonment policies occurring in the United States from the mid-1970s to the latter 1980s. After three decades of relatively stable incarceration rates, with the national rate of inmates per 100,000 population ranging from 93 to 119 between 1945 and 1974 (Blumstein and Cohen, 1973), the U.S. incarceration rate increased almost 2.5-fold from 112 to 274 between 1975 and 1989.
The increase in incarceration nationally mirrors similar increases that occurred widely across different crime types and states. Analyses of annual offense and incarceration data for six states indicated that rising incarceration rates since the mid-1970s were due primarily to upward trends in imprisonment sanctions over that period. Among six states examined, increases were widespread both in the risk of being committed to prison following arrest (Qi) and in time served by those who enter prison (S), but increases in S were somewhat more likely.62 This was especially so in Michigan, New York, and Pennsylvania, where sentencing reforms to increase penalties for certain offenses were enacted.
Increased reliance on incarceration has resulted in substantially higher costs to society in terms of prison populations. Aside from the retributive (or punitive) functions that may be served by incarceration, it is legitimate to inquire about the magnitude of crime control benefits that have accompanied these sharply rising prison populations. By invoking traditional estimation techniques
in which homogeneous sanction levels are applied to the average offender, the reduction in violent crimes due to incapacitation is estimated to have been very modest—only 5 to 10 percent of potential violent crimes prevented. Strong reasons exist, however, for believing that these crude estimates vastly understate the crime reduction actually achieved by incarceration.
Numerous studies—relying on offender self-reports and official criminal histories—indicate substantial variability in offending rates among individual offenders, with a small group of especially high-rate offenders responsible for a sizable portion of all crimes committed. Through a process of stochastic selectivity that occurs independently of any deliberate attempts to selectively target some offenders for enhanced incarceration, high-rate offenders will be overrepresented among prison inmates. Based on their crime rates alone, high-rate offenders, in effect, self-select for greater incarceration: the more frequently an offender commits crimes during a period of length t, the more likely it is that he will end up in prison sometime during that period and will be incarcerated longer during his lifetime.
This stochastic selectivity occurs when all offenders are subject to the same expected time served for each crime they commit and persists to a considerable extent even when high-rate offenders are subject to a substantially lower risk of incarceration than are low-rate offenders. Only unrealistically large differences in incarceration risk—of a magnitude ruled out by existing empirical evidence—would seriously attenuate or reverse stochastic selectivity of high-rate offenders in prison.63
Consequently, the offending rates of inmates are usually many times higher than the average rate among all offenders, which increases crime reduction from incapacitation beyond that estimated for the average offender. In Michigan from 1975 to 1980, for example, the incapacitation effect for a homogeneous population of robbers is estimated to have been only 7.8 percent of potential robberies averted. In allowing for stochastic selectivity among offenders with heterogeneous offending rates, and the accompanying greater likelihood that high-rate offenders are in fact spending substantial portions of their lifetimes incarcerated, the incapacitation effect from the same size prison population is estimated to have been five times greater (41.3%; see Table 9).
Stochastic selectivity means that the incapacitation effects that prevailed during the period of low incarceration rates in the late 1970s are probably much greater than were previously estimated. The same stochastic selectivity, however, also results in decreasing
marginal returns from incapacitation as increasing numbers of offenders are incarcerated. Just as high-rate offenders are overrepresented among inmates, low-rate offenders are disproportionately found among the offenders who remain free. Under these circumstances, the new inmates that result from expanding incarceration are likely to offend at lower average rates than did previous inmates.
In Michigan during the late 1970s, for example, robbers among resident inmates committed about 15 robberies per year while free, whereas the average annual rate among all robbers—in and out of prison—was only 3 (Table 16). More than doubling the prison population from 50 percent increases in both Q and S increasingly brings into prison less serious offenders whose average annual rate of only 2.4 robberies is substantially below that of robbers in the original smaller prison population.64
Thus, although crime control from incapacitation has undoubtedly increased from an estimated level of 32.9 percent of potential violent offenses prevented nationally in 1975 (Table 11), the marginal gains in crime control do not come close to the almost 200 percent rise in the prison population since then. Based on incapacitation alone, with no changes in individual offending, the near tripling of prison inmates convicted of violent offenses would have increased crime control from incapacitation by only 9 percentage points to 41.9 percent of potential violent crimes averted by 1989 (Table 11). This corresponds to a 13.4 percent reduction from the observed level of violent crimes in 1975 (Table 12). A combination of deterrence and incapacitation effects from rising incarceration levels would have reduced 1989 violent crimes more substantially below 1975 levels and would have resulted in much smaller increases in the prison population (Table 12).
The observation of almost stable levels of violent crimes in 1975 and 1989, in the face of a near tripling of the inmate population, is not compatible with the existence of meaningful crime control effects from deterrence and incapacitation unless the underlying potential level of violent crimes actually increased between 1975 and 1989. In a reasonable scenario, for example, the tripling of prison inmates by 1989 is capable of having prevented a 61 to 66 percent increase in violent crimes above the levels observed in 1975 (Table 14). It is noteworthy that in this scenario, the total crime reduction achieved by a combination of deterrence and incapacitation is not much larger than that estimated for incapacitation alone (Table 14). At least as modeled here—with offsetting trade-offs between incapacitation and deterrence—the
magnitude of the estimated incapacitation effect alone provides a reasonably good estimate of the total combined effects of deterrence and incapacitation.
Aside from decreasing marginal returns of incarceration arising from stochastic selectivity, normal termination of criminal careers also reduces the crime control effects derived from increased incarceration. Short careers inhibit incapacitation in two fundamental ways. First, when careers are short, the odds that an offender is never intercepted by the criminal justice system increase. In the extreme, if offenders' careers are long enough for them to commit only one crime, incapacitation would yield zero crime control benefits.65 Second, even for those offenders who are eventually imprisoned, the expected incapacitation benefits are limited by the possibility that an offender permanently ends offending while in prison. Thus, some of the time that offenders spend incarcerated does not result in crimes prevented, since those inmates would not have engaged in further crimes had they been free.
The effect of career termination in reducing the crime control effects of incapacitation has policy implications for the choice between increasing the certainty of incarceration following a crime (Q) and increasing the severity of prison terms (S). The longer that time served is in relation to the average length of criminal careers, the more likely are offenders to end their careers while still incarcerated. Time that is served in prison after the end of offending is ''wasted" from the perspective of incapacitation because the number of no longer active offenders in prison increases, without further crime reduction from the expenditure of additional prison resources.
Career termination effectively distinguishes between the impacts of Q and S on incapacitation effects, with increases in Q dominating similar increases in S as a more effective sentencing strategy. A greater deterrent effect of certainty over severity of prison terms—as is often posed by deterrence theorists, due in part to time discounting for longer sentences—would similarly favor sentencing policies that emphasize increasing Q over similar increases in S. This policy choice runs counter to prevailing patterns of sentencing reform that have emphasized longer prison terms over more difficult to implement changes to increase the certainty of incarceration following a crime. Although strategically, increases in S are easy to implement in highly visible ways, such a strategy is likely to be less effective in the long run because
the resulting increases in prison population fail to bring about substantial reductions in violent crimes.
NOTES
|
|
treated as suspect and eliminated from the analysis (murder arrests in California during 1981, and in Michigan during 1987 and 1988; New York aggravated assault arrests, 1966 and 1967; all arrests in New York, 1978, and in Texas, 1977 and 1978). |
|
5. |
Data on total prison inmates in the United States are from Flanagan and Maguire (1990:Table 6.43). Adjustments to population rates use annual population estimates by age available in Bureau of the Census (1974, 1982, 1984, and 1986). |
|
6. |
Figure 4 presents the percentage serving time for (top) robbery and (bottom) for drug offenses among resident inmates and among new commitments to prison. The relationship between these two measures provides an immediate indication of how time served for the graphed offense compares to the overall average time served by all inmates. When the percentage of commitments for an offense type exceeds the percentage for the same offense among resident inmates, time served for that offense is below the average for all offense types combined. Conversely, a higher percentage among resident inmates than among prison commitments indicates longer-than-average time served for an offense type. In the case of robbery the percentage found among resident inmates is generally higher (by 20 to 65%) than the corresponding percentage among commitments to prison (except in New York). This indicates that time served for robbery is typically longer than the overall average time served by all inmates. For drug offenses, by contrast, the two percentages are only slightly higher among commitments to prison for most of the time period, especially in California, Michigan, and New York, and time served for drug offenses in those states is similar to the average time served by all inmates combined. Toward the end of the 1980s, sharp increases in drug offenses as a percentage of all commitments to prison were not matched by similar increases in percentages among resident inmates for the same years. If this differential between commitments and residents were to continue into the future, it would indicate a decline in average time served for drug offenses compared to time served for other crime types. If, however, time served for drug offenses does not decline, the increases in commitments for drug offenses observed during the late 1980s would foreshadow important increases in the representation of drug offenses among the resident population of prison. |
|
7. |
The similarities in incarceration rates across states and crime types were evident in simple bivariate correlations among the yearly incarceration rates for state-by-crime subgroups. In |
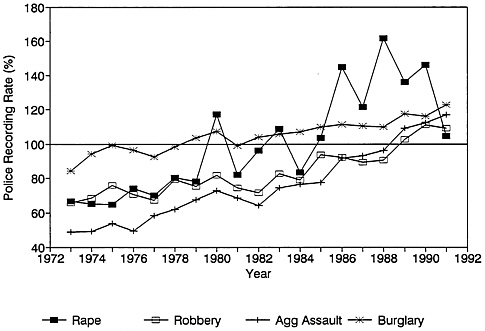
|
|
of variations in offending for different crime types by age. Race is another population attribute of interest because much higher offense rates in violent crimes and robbery are typically found among blacks than among whites. The differences between black and white crime rates are sufficiently large that even small increases in the fraction of the population who are black can produce important increases in total population rates for violent crimes (Blumstein et al., 1991). |
|
13. |
These crime-type differences in age of offending are reflected in individual states by the adult fraction of crimes reported in Table A-1. The adult fraction is very high for violent offenses, averaging 0.90 for murder, 0.82 for rape, and 0.83 for aggravated assault. It was also high for drug offenses, with an average of 0.82. The two crimes involving theft of property have the lowest average adult fractions—0.71 for robbery and 0.54 for burglary. These latter two crime types also experienced the largest increases in the adult fraction of crimes over the study period, for example, up from 0.76 to 0.88 for robbery in Texas, and from 0.42 to 0.70 for burglary in Florida. |
|
14. |
Throughout this analysis, we distinguish crimes by adults from total reported crimes since, with rare exception, only adults are eligible for incarceration in state prisons. The number of crimes by adults is estimated by applying the adult fraction found among arrests to total reported crimes. The annual adult fraction was obtained separately for each crime type and state in the analysis. The adult fraction of arrests is undoubtedly somewhat different from the same fraction among reported crimes. In particular, to the extent that juveniles are more likely to commit crimes as part of a group or are more vulnerable to arrest, their representation among arrestees will overstate the proportion of crimes that are committed by juveniles. Nevertheless, the error in the adjustment that we make in estimating crimes by adults is probably smaller than the distortions that would be introduced by ignoring the changes in the adult fraction during the study period and treating all reported crimes as if they were equally vulnerable to imprisonment. The adult fraction of arrests should at least capture the direction of changes over time in the adult fraction of crimes. |
|
15. |
Even if there were no change in the risk of commitment to prison per crime, a rise in the number of offenders would increase the number of persons who are eligible for incarceration, whereas growth in individual offending frequencies would increase the risk of incarceration per offender. |
|
16. |
Values of qa in Table A-2 that exceed 1.0 for murder primarily reflect the upward bias from failing to include multiple offenders per crime incident. Although the arrest count may include more than one person arrested for the same homicide, only one crime incident is included in the crime count. |
|
17. |
S is a traditional stock-over-flow estimate of time served. In steady state, this ratio provides a reasonable estimate of the average total time served per commitment to prison on a new sentence. The ratio, however, is very sensitive to large year-to-year variations in the rate of new commitments to prison. Based on a stochastic model, we developed an alternative measure of time served (S*) that removes the influence of large yearly changes in the number of commitments, and relies instead on the size of the prison population that remains in prison from year to year. A detailed analysis of S and S* (Canela-Cacho and Cohen, 1991) reveals that the two measures differ mainly in magnitude, with S on average being somewhat lower than S*. The lower average values for S generally result from unusually large increases in the number of commitments to prison in some years. Nevertheless, the patterns of change in S and S* over time are very similar. For this reason we are reasonably confident about the robustness of the results for S that are reported here. |
|
18. |
The available data generally do not distinguish new commitments from recommitments within the resident inmate population, nor do they provide counts of the number of recommitments who enter prison each year. Thus, it is not possible to apportion total time served between terms served following the original commitment and those served on recommitments for the same conviction. It is also not possible to trace the impact on the size of prison populations of changes in conditional release and recommitment policies. Data that are available for California, however, indicate that parole revocation has been a major factor contributing to rising prison populations in that state. As the revocation rate for parolees increased from 3.5 to 33 percent between 1977 and 1988, parole violators returned to prison increased from 8 percent of total prison admissions in 1978 to 47 percent in 1988. In 1989, parole violators comprised 16 percent of the resident inmate population in California state prisons (see California, 1990). |
|
19. |
The result regarding increases in Qi agrees with that of Langan (1991), but the finding of widespread increases in time served since 1977 using state-level data is at odds with Langan's (1991:1569) conclusion from national data that time served by |
|
|
released inmates declined after 1973. Langan, however, includes only time served until first release from prison on a sentence, whereas the state data used here refer to total time served, including any time following returns to prison from conditional release. Such returns to prison—resulting from either technical violations of release conditions or new offenses—have become an increasing factor in inmate populations. Starting in 1975 with 10 percent recommitments from conditional release among total prison admissions nationally, returns to prison increased steadily, and by 1988, 27 percent of all admissions to prison in the United States involved recommitments from some form of conditional release (see Prisoners in State and Federal Institutions and Correctional Populations in the United States , both published annually by the U.S. Department of Justice, Bureau of Justice Statistics). The increases in recommitments to prison accompanied a substantial increase in conditional releases from prison, involving some form of postrelease supervision in the community, which rose from 54 percent of all releases in 1975 to 75 percent in 1988. The increase in conditional releases derived mainly from expansion of mandatory supervised release, which rose from only 5 percent of total releases from prisons in 1975 to 28 percent in 1988. The corresponding increase in mandatory supervised releases among conditional and unconditional releases was from 6 to 30 percent. Over this same period, parole releases declined modestly from 50 to 38 percent among total releases from prisons, but were a significantly declining fraction of conditional and unconditional releases, falling from 72 percent in 1977 to 40 percent in 1988 (Langan, 1991). Parole release usually involves discretionary early release from prison terms based on some assessment of the risk posed by the offender. Mandatory supervised release, by contrast, automatically follows release from prison and need not involve early release from the sentence imposed in court. Under the determinate sentence provisions in California, for example, sentenced prisoners must serve the term imposed in court minus any authorized reductions granted for good behavior, and upon release from prison, all former inmates are subject to an additional three years of supervision in the community. To some extent, rising numbers of recommitments to prison may be an expected result of the increased numbers of conditional releases. As the population of offenders under some form of supervised release (mandatory or parole) increased, simply maintaining the same revocation and recommitment policies would |
|
|
Franklin County, Ohio reported in Conrad (1985); Hamparian et al. (1978); Miller et al. (1982); and Van Dine et al. (1979). |
|
28. |
The results from the study of violent offenders by Miller et al. (1982:55) illustrate the relative occurrence of the various violent offenses. That study was based on the criminal records of 1,591 offenders arrested at least once for murder, rape, aggravated assault, or robbery in Columbus, Ohio during 1950-1976. These offenders generated a total of 12,527 arrests, of which 23.6 percent were for violent offenses and one-half of these were the originally sampled violent offenses. Robbery and aggravated assault accounted for 73 percent of total violent crimes, with homicide and rape each contributing almost equally to the remaining 27 percent. |
|
29. |
The estimated robbery offending rates were 3.4 in Washington, D.C and 4.7 in Detroit (Cohen, 1986). These higher estimates of λ in part reflect inclusion of unarmed robberies that are not included in the rates estimated by Chaiken (1980). Additionally, the estimated rates apply to arrestees; thus they are not representative of all offenders, and, as we explain later, high-rate offenders are overrepresented in criminal justice samples. |
|
30. |
Here, the risks of imprisonment following a crime represent the risk that each offender faces for any robbery he commits, regardless of the number of offenders involved in any crime incident and whether or not the crime is reported to the police. These risks are lower than the corresponding probabilities obtained by simply multiplying the mean values of qa and Qi reported for robbery in each state in appendix Table A-2. As we noted earlier, the values of qa reported in Table A-2 overstate by about fourfold the actual arrest risk per crime committed for robbery. If appropriate adjustments are made to qa for crimes that are not reported to the police and for multiple offenders involved in the same crime incident, the two estimates of imprisonment risk per crime committed become comparable in magnitude. |
|
31. |
The Avi-Itzhak and Shinnar model relies on a number of parametric assumptions typical of queuing network models. They assume that each individual offender commits crimes according to a Poisson process with a constant rate λ—represented by the average value for the overall offender population—and that the length of time served in prison, S, is distributed as an exponential random variable. In addition, a crime leads to imprisonment with probability Q in a Bernoulli fashion. |
|
|
levels. Later we explore the potential moderating effects of deterrence on estimated incapacitation levels. |
|
41. |
The percentage increases correspond to an increase of about three crimes added to every seven already committed, or four crimes added to every six already committed, as calculated from the ratio of prevented crimes to committed crimes (.278/.722 = .385; .301/.699 = .431; .431/.587 = .704). |
|
42. |
The average time served by robbers actually sentenced to prison is considerably longer at 3.6 to 3.9 years (Table 6). The very low risk of incarceration for any robbery committed (from 7 to 20 commitments per 1,000 crimes) substantially reduces the expected time served associated with each robbery that is committed. |
|
43. |
The risk of imprisonment per offender is itself a function of the risk per crime and number of crimes that are committed and, thus, will vary across offenders. |
|
44. |
The corresponding figures for the 1958 cohort are 60.0, 75.2, 73.2, and 65.1 percent, respectively (Weiner, 1989:Table 2.16). |
|
45. |
Marital violence, especially wife battering, offers an interesting example of how general offending affects the incapacitation of a particular form of violence. As Fagan and Browne (in Volume 3) note, although wife battering is often a serious and chronically recurring violent crime, it seldom results in incarceration of the perpetrator. However, studies by Flynn (1977), Walker (1979), and White and Strauss (1981) (also see Fagan and Browne in Volume 3) report that wife batterers also commit other serious crimes against strangers for which they do spend time in prison. Obviously, while they are incarcerated for other offenses, wife batterers are also unable to victimize their spouses. |
|
46. |
Cook (1986) poses a sanction process in which increased imprisonment sanctions are reserved for only the most criminally active offenders, while sentences are reduced for low-rate offenders. In this case, a negative deterrence effect, by which rising sanctions reduce crimes for high-rate offenders, is accompanied by the reverse effect of increasing offending when sanctions decline for low-rate offenders. Although Cook focuses on the potential perverse effects of these countervailing forces for selective incapacitation policies, the reverse crime-enhancing effects of deterrence would apply generally whenever sanction rates decrease. |
|
47. |
We emphasize once again that I* is a relative measure of the proportional reduction from the potential level of crime; so high values of I* do not necessarily imply low crime rates, and vice versa. Large deterrent effects may lead to low values of I* |
|
|
assault are estimated from annual data from the National Crime Survey. The NCS crime count includes all crime incidents, whether or not they are reported to police. The NCS crime count is augmented by the annual UCR count of homicides known to the police, to yield a total of 2,944,500 violent crimes in 1975 and 2,937,500 in 1989. To properly represent the incarceration risk faced by all offenders for the crimes they commit, the NCS crime count is doubled to reflect an average of two offenders per crime incident (Reiss, 1980). The resulting ratios of inmates to total offender crimes are applied homogeneously to all active offenders. |
|
54. |
The prevailing expected level of crimes is 67.1 percent (100-32.9 crimes prevented) of λ0N0 potential crimes at Q0S0. Tripling imprisonment sanctions corresponds to a proportionate crime reduction when expected crimes are reduced to no more than one-third this level, or 22.4 percent of potential crimes (i.e., a total crime reduction of D + I2* ≥ 77.6 in Table 11). |
|
55. |
Recall that an elasticity of -1.0 represents a 1 percent reduction in crimes associated with a 1 percent increase in imprisonment sanctions. The marginal returns in terms of proportional reductions in crimes decrease with proportional increases in sanctions greater than 1 percent. For K = Q1S1/Q0S0, and a change in λ or N such that a proportional change in sanctions of K - 1 (e.g., for K = 1.5, the proportional change in sanctions is +0.5, or a 50% increase) is associated with a proportional change in λ or N of r - 1 = Kb - 1 ≤ K-1 when b < 0. So, for example, if b = -1.0, a 50 percent increase in sanctions (K = 1.5) is associated with a 33 percent decrease from λ0 and N0 (r - 1 = Kb - 1 = 1.5-1 - 1 = -0.33). |
|
56. |
The two scenarios result from slight modifications to the distribution of offending presented in Table 10 that increase the representation of high-λ offenders. The percentage distribution is changed to 85, 13, and 2 percent for low-, medium-, and high-λ offenders, respectively. Also the mean λ for high-rate offenders is increased from 239 to 259 for an overall mean λ0* of 7.5, and to 384 for λ0* = 10.0. The selected increases in potential crimes reflected in λ0* are hypothetical. They are used here for illustrative purposes to show how the observed small change in crimes between 1975 and 1989, while prison inmates nearly tripled, nevertheless, might be compatible with deterrent effects associated with the substantial increase in sanction risks. |
|
57. |
Under sanction level Q0S0 applied to the offending distribution in Table 10, offenders are expected to commit an average of 1.87 of 2.79 potential crimes (i.e., λ0* [1 - I1*] = 2.79[1 - I1*] = 2.79[1 - 0.329] = 1.87 from Table 11). If the offending distribution shifts to the larger shares and increased means for high-λ offenders described in note 56, offenders will commit an average of 3.01 crimes (λ0*[1 - I1 *] = 7.5 [1 - 0.599]) or 3.10 crimes (λ0*[1 - I1*] = 10.0[1 - 0.690]) (from Table 14) under the same Q0S0 sanction levels, representing a 61 to 66 percent increase over the 1.87 crimes committed in the base case scenario. Such an increase is certainly a possibility. A total increase of 60 percent over 15 years corresponds to an average annual increase of about 3 percent in observed crimes, and is very close to the total increase in violent crimes from 1,039,710 in 1975 to 1,646,040 in 1989 reported by police in the FBI's Uniform Crime Reports program (Federal Bureau of Investigation, 1985, 1990a). |
|
58. |
At least with respect to the model of deterrence examined here, total crime reduction is reasonably well estimated even when the mix between deterrence and incapacitation effects is seriously in error. Since the assumptions of the present model are quite generous with respect to the range of possible deterrence effects, we are reasonably confident that this finding will also generalize to other formulations of deterrence. |
|
59. |
See the report of an earlier National Research Council panel on criminal careers for a review of predictive accuracy (Blumstein et al., 1986). Farrington and Tarling (1985) and Gottfredson and Tonry (1987) also provide comprehensive treatments of prediction issues in criminal justice applications. |
|
60. |
The number of resident inmates represents the number of inmates found in prison on any day. This resident population reflects the buildup in prison population associated with time served and includes disproportionately more offenders serving long prison terms than are found in an incoming cohort. |
|
61. |
Such overestimates are evident in Zedlewski (1987) and Abel (1989); also see Zimring and Hawkins (1988) for a critique of these estimates. |
|
62. |
The risk of arrest following a crime, qa, remained reasonably constant over the same time period. |
|
63. |
For example, consider a population of offenders comprised of two subpopulations, one low-λ and the other high-, who together commit an average of three offenses per offender annually while they are free (similar to robbers in California and Michigan |
|
|
in Table 8). The risk of commitment to prison per crime (Q) for low-rate offenders would have to exceed 100 times the same risk for high-rate offenders before reversing the overrepresentation of high-rate offenders among incoming inmates. Such a differential far exceeds the variations in sanction levels that have been observed within offending populations. (See discussion of the relationship between λ and Q earlier in this paper.) |
|
64. |
Fifty percent increases in Q and S in Michigan are estimated to increase the prison population by 39 and 45 percent, respectively, for a total increase of 102 percent (1.39* 1.45 = 2.02 from Table 15). The weighted average offending rate of these added prisoners is estimated from Table 16 to be 2.4 = (0.464*3.5) + (0.536*1.5). |
|
65. |
In general, offenders are vulnerable to incarceration only after they commit a crime, so the first crime they commit is not subject to incapacitation. Only a policy of preventive incapacitation that incarcerates nonoffending individuals based on the expectation that they will eventually commit crimes could prevent the first crime an offender commits. |
REFERENCES
Abel, R.B. 1989 Beyond Willie Horton. The battle of the prison bulge. Policy Review 47(4):32-35.
Ahn, C.W., A. Blumstein, and M. Schervish 1990 Estimation of arrest careers using hierarchical stochastic models. Journal of Quantitative Criminology 6(2):131-152.
American Correctional Association 1989 Vital Statistics in Corrections. Laurel, Md.: American Correctional Association.
Avi-Itzhak, B., and R. Shinnar 1973 Quantitative models in crime control. Journal of Criminal Justice 1:185-217.
Beck, A.J., and B.E. Shipley 1989 Recidivism of Prisoners Released in 1983. Bureau of Justice Statistics. Washington, D.C.: U.S. Department of Justice..
Blumstein, A., and J. Cohen 1973 A theory of the stability of punishment. Journal of Criminal Law and Criminology 64:198-207.
1979 Estimation of individual crime rates from arrest records. Journal of Criminal Law and Criminology 70:561-585.
1985 Estimating the duration of adult criminal careers. Proceedings of International Statistical Institute Annual Meeting. Amsterdam: International Statistical Institute.
Blumstein, A., and J. Cohen (with P. Hsieh) 1982 The Duration of Adult Criminal Careers. Final Report submitted to the National Institute of Justice, August 1982. School of Urban and Public Affairs, Carnegie-Mellon University.
Blumstein, A., J. Cohen, and D. Nagin, eds. 1978 Deterrence and Incapacitation: Estimating the Effects of Criminal Sanctions on Crime Rates. Panel on Research on Deterrent and Incapacitative Effects, Committee on Law Enforcement and the Administration of Justice, Assembly of Behavioral and Social Sciences, National Research Council. Washington, D.C.: National Academy of Sciences.
Blumstein, A., J. Cohen, S. Martin, and M. Tonry, eds. 1983 Research on Sentencing: The Search for Reform, 2 vols. Panel on Research on Sentencing, Committee on Law Enforcement and the Administration of Justice, Commission on Behavioral and Social Sciences and Education, National Research Council. Washington, D.C.: National Academy Press.
Blumstein, A., J. Cohen, J. Roth, and C.A. Visher, eds. 1986 Criminal Careers and ''Career Criminals," 2 vols. Panel on Research on Criminal Careers, Committee on Research on Law Enforcement and the Administration of Justice, Commission on Behavioral and Social Sciences and Education, National Research Council. Washington, D.C.: National Academy Press.
Blumstein, A., J. Cohen, and C.A. Visher 1989 Linking the Crime and Arrest Process to Measure Individual Crime Rates: Variations in Individual Arrest Risk per Crime. Working paper, School of Urban and Public Affairs, Carnegie-Mellon University.
Blumstein, A., J. Cohen, and A. Golub 1990 A Comparison of Termination Rates of Adult Criminal Careers Across Offender Characteristics and Jurisdictions. Paper presented at the annual meeting of American Society of Criminology, Baltimore, Md., November.
Blumstein, A., J. Cohen, and R. Rosenfeld 1991 Effects of Demography and Criminality on Crime Rates. Working paper, School of Urban and Public Affairs, Carnegie-Mellon University .
1992 The UCR-NCS relationship revisited: A reply to Menard. Criminology 3(1):115-124.
Blumstein, A., J.A. Canela-Cacho, and J. Cohen 1993 Filtered sampling from populations with heterogeneous event frequencies. Management Sciences 39(7):886-899.
Bureau of the Census 1969 Estimates of Population of States by Age, 1965 to 1967 with Provisional Estimates for July 1, 1968. Current Population Reports, Series P-25 Number 420. Washington, D.C.: U.S. Department of Commerce.
1970 Estimate of the Population of States by Age, 1968. Current Population Reports, Series P-25 Number 437. Washington, D.C.: U.S. Department of Commerce.
1974 Estimates of the Population of the U.S. by Age, Race, and Sex . Current Population Reports, Series P-25 Number 519. Washington, D.C.: U.S. Department of Commerce.
1980 Estimates of the Population of States by Age, July 1, 1971 to 1979. Current Population Reports, Series P-25 Number 875. Washington, D.C.: U.S. Department of Commerce.
1982 Preliminary Estimates of the Population of the U.S. by Age, Sex, and Race, 1970-1981. Current Population Reports, Series P-25 Number 917. Washington, D.C.: U.S. Department of Commerce.
1984 Projections of the Population of the U.S. by Age, Sex, and Race: 1983-2080. Current Population Reports, Series P-25 Number 952. Washington, D.C.: U.S. Department of Commerce.
1986 Estimates of the Population of the U.S. by Age, Sex, and Race 1980-85. Current Population Reports, Series P-25 Number 985. Washington, D.C.: U.S. Department of Commerce.
1988 State Population and Household Estimates with Age, Sex, and Components of Change 1981-87. Current Population Reports, Series P-25 Number 1024. Washington, D.C.: U.S. Department of Commerce.
1989 State Population and Household Estimates with Age, Sex, and Components of Change 1981-88. Current Population Reports, Series P-25 Number 1044. Washington, D.C.: U.S. Department of Commerce.
Bureau of Justice Statistics 1979 Profile of State Prison Inmates: Sociodemographic Findings from the 1974 Survey of Inmates of State Correctional Facilities. Washington, D.C.: U.S. Department of Justice.
1988 Profile of State Prison Inmates, 1986. Washington, D.C.: U.S. Department of Justice.
1990a Prisoners in 1989. Washington, D.C.: U.S. Department of Justice.
1990b Criminal Victimization 1989. Washington, D.C.: U.S. Department of Justice.
1991 Criminal Victimization in the United States: 1973-88 Trends. Washington, D.C.: U.S. Department of Justice.
California 1990 Report of the Blue Ribbon Commission on Inmate Population Management . Sacramento, Calif.: California Prison Industry Authority.
Callahan, M. 1986 Historical Corrections Statistics in the United States, 1850-1984 . Bureau of Justice Statistics. Washington, D.C.: U.S. Department of Justice.
Canela-Cacho, J.A. 1990 Incapacitative Effect and Prison Population Under Offender Heterogeneity. Unpublished Ph.D. dissertation, School of Urban and Public Affairs, Carnegie-Mellon University, Pittsburgh.
Canela-Cacho, J.A., and J. Cohen 1991 Measuring Time Served in State Prisons. Working paper, School of Urban and Public Affairs, Carnegie-Mellon University.
Chaiken, J.M. 1980 Models for estimating crime rates. In M. Peterson and H. Braiker (with S. Polich) Doing Crime: A Survey of California Inmates. Santa Monica, Calif.: RAND Corporation.
Chaiken, J.M., and M. Chaiken 1982 Varieties of Criminal Behavior. Report R-2814-NIJ. Santa Monica, Calif.: RAND Corporation.
1984 Offender types and public policy. Crime and Delinquency 30(2):195-226.
Clarke, S.H. 1974 Getting 'em out of circulation: Does incarceration of juvenile offenders reduce crime? Journal of Criminal Law and Criminology 65(4):528-535.
Cohen, J. 1978 The incapacitative effect of imprisonment: A critical review of the literature. In A. Blumstein, J. Cohen, and D. Nagin, eds., Deterrence and Incapacitation: Estimating the Effects of Criminal Sanctions on Crime Rates. Panel on Research on Deterrent and Incapacitative Effects, Committee on Research on Law Enforcement and Criminal Justice, National Research Council. Washington, D.C.: National Academy of Sciences.
1983 Incapacitation as a strategy for crime control: Possibilities and pitfalls. In M. Tonry and N. Morris, eds., Crime and Justice: An Annual Review of Research, Vol. 5. Chicago: University of Chicago Press.
1984 Selective incapacitation: An assessment. University of Illinois Law Review 1984(2):253-290.
1986 Research on criminal careers: Individual frequency rates and offense seriousness. Appendix B in A. Blumstein, J. Cohen, J. Roth, and C.A. Visher, eds., Criminal Careers and "Career Criminals," Vol. 1. Panel on Research on Criminal Careers, Committee on Research on Law Enforcement and the Administration of Justice, Commission on Behavioral and Social Sciences and Education, National Research Council. Washington, D.C.: National Academy Press.
Conrad, J.P. 1985 The Dangerous and the Endangered. Lexington, Mass.: Lexington Books.
Cook, P.J. 1977 Punishment and crime: A critique of recent findings on the preventive effects of punishment . Law and Contemporary Problems
(winter):164-204; pp.137-180 in R. Andreano and J. Siegfried, eds., The Economics of Crime. New York: John Wiley & Sons.
1980 Research in criminal deterrence: Laying the groundwork for the second decade. In N. Morris and M. Tonry, eds., Crime and Justice: An Annual Review of Research, Vol. 2. Chicago: University of Chicago Press.
1986 Criminal incapacitation effects considered in an adaptive choice framework. In D. Cornish and R. Clarke, eds., The Reasoning Criminal . New York: Springer-Verlag.
Dunford, F.W., and D.S. Elliott 1984 Identifying career offenders using self-report data. Journal of Research in Crime and Delinquency 21:57-87.
English, K. 1990 Measuring Crime Rates in Colorado: 1988-89. Paper presented at the annual meeting of the American Society of Criminology, Baltimore, Md., November.
Farrington, D.P. 1978 The family background of aggressive youths. In L. Hersov, M. Berger, and D. Shaffer, eds., Aggression and Anti-Social Behavior in Childhood and Adolescence. Oxford: Pergamon Press.
1982 Longitudinal analysis of criminal violence. In M.E. Wolfgang and N.A. Weiner, eds., Criminal Violence. Beverly Hills, Calif.: Sage Publications.
Farrington, D.P., and R. Tarling, eds. 1985 Prediction in Criminology. Albany: State University of New York Press.
Federal Bureau of Investigation annual Uniform Crime Reports: Crime in the United States. Washington, D.C.: U.S. Department of Justice.
1976 Crime in the United States—1975. Washington, D.C.: U.S. Department of Justice.
1985 Crime in the United States—1984. Washington, D.C.: U.S. Department of Justice.
1990a Crime in the United States—1989. Washington, D.C.: U.S. Department of Justice.
1990b Age-Specific Arrest Rates and Race-Specific Arrest Rates for Selected Offenses 1965-1988. Washington, D.C.: U.S. Department of Justice.
Flanagan, T.J., and K. Maguire 1990 Sourcebook of Criminal Justice Statistics 1989. Bureau of Justice Statistics. Washington, D.C.: U.S. Department of Justice.
Flynn, J.D. 1977 Recent findings related to wife abuse. Social Case Work 58:17-18.
Geerken, M.R., and W.R. Gove 1975 Deterrence: Some theoretical considerations. Law and Society Review 9:497-513.
Gibbs, J.P. 1975 Crime, Punishment, and Deterrence. New York: Elsevier.
1986 Deterrence theory and research. In G.B. Melton, ed., The Law as a Behavioral Instrument: Nebraska Symposium on Motivation. Lincoln: University of Nebraska Press.
Gottfredson, D.M., and M. Tonry 1987 Prediction and Classification: Criminal Justice Decision Making . Chicago: University of Chicago Press.
Gottfredson, M.R., and T. Hirschi 1990 A General Theory of Crime. Stanford, Calif.: Stanford University Press.
Greenberg, D. 1975 The incapacitative effect of imprisonment: Some estimates. Law and Society Review 9:541-580.
Greene, M.A. 1977 The Incapacitative Effect of Imprisonment Policies on Crime. Unpublished Ph.D. dissertation, School of Urban and Public Affairs, Carnegie-Mellon University.
Greenwood, P.W., and S. Turner 1987 Selective Incapacitation Revisited: Why the High-Rate Offenders are Hard to Predict. Report R-3397-NIJ. Santa Monica, Calif.: RAND Corporation.
Hamparian, D.N., R. Schuster, S. Dinitz, and J.P. Conrad 1978 The Violent Few. A Study of Dangerous Juvenile Offenders. Lexington, Mass.: Lexington Books.
Horney, J., and I.H. Marshall 1991 Measuring lambda through self-reports. Criminology 29(3):471-496.
Isikoff, M. 1990 Florida's crime crackdown is freeing felons early. Washington Post, December 28.
Jencks, C. 1991 Is violent crime increasing? American Prospect (winter):98-109.
Klepper, S., and D. Nagin 1989 The deterrent effect of perceived certainty and severity of punishment revisited. Criminology 27(4):721-746.
Langan, P. 1991 America's soaring prison population. Science 25:1568-1573.
Miller, S.J., S. Dinitz, and J.P. Conrad 1982 Careers of the Violent. Lexington, Mass.: Lexington Books.
Miranne, A.C., and M.R. Geerken 1991 The New Orleans inmate survey: A test of Greenwood's predictive scale. Criminology 29(3):497-578.
Mullen, J. (with K. Carlson and B. Smith) 1980 American Prisons and Jails, Vol I. National Institute of Justice. Washington, D.C.: U.S. Department of Justice.
National Conference of State Legislatures 1989 State Legislatures and Corrections Policy: An Overview. Denver, Colo.: National Conference of State Legislatures.
National Prisoner Statistics 1976 Survey of Inmates of State Correctional Facilities, 1974. National Criminal Justice Information and Statistics Service. Washington, D.C.: U.S. Department of Justice.
Paternoster, R. 1987 The deterrent effect of perceived certainty and severity of punishment: A review of the evidence and issues. Justice Quarterly 42:173-217.
Pennsylvania Commission on Crime and Delinquency 1988 Trends and Issues in Pennsylvania's Criminal Justice System. Harrisburg: Pennsylvania Commission on Crime and Delinquency.
Petersilia, J., and P.W. Greenwood 1978 Mandatory prison sentences: Their projected effects on crime and prison population. Journal of Criminal Law and Criminology 69(4):604-615.
Peterson, M.A., and H.B. Braiker (with S. Polich) 1981 Who Commits Crime. Cambridge, Mass.: Oelgeschlager, Gunn, and Hain Publishers. (Also available in 1980 publication Doing Crime: A Survey of California Prison Inmates, Report R-2200-DOJ. Santa Monica, Calif.: RAND Corporation.)
Piper, E.S. 1985 Violent recidivism and chronicity in the 1958 Philadelphia cohort. Journal of Quantitative Criminology 1(4):319-344.
Reiss, A.J., Jr. 1980 Understanding changes in crime rates. In S.E. Fienberg and A.J. Reiss, eds., Indicators of Crime and Criminal Justice: Quantitative Studies. Bureau of Justice Statistics. Washington, D.C.: U.S. Department of Justice.
Shane-Dubow, S., A.P. Brown, and E. Olsen 1985 Sentencing Reform in the United States: History, Content, and Effect. National Institute of Justice. Washington, D.C.: U.S. Department of Justice.
Shannon, L.W. 1982 Assessing the Relationship of Adult Criminal Careers to Juvenile Careers. Iowa City: Iowa Urban Community Research Center, University of Iowa.
1988 Criminal Career Continuity: Its Social Context. New York: Human Sciences Press.
Shinnar, R., and S. Shinnar 1975 The effect of the criminal justice system on the control of crime: A quantitative approach . Law and Society Review 9:581-612.
Tittle, C.R. 1980 Sanctions and Social Deviance: The Question of Deterrence. New York: Praeger.
Tracy, P.E., M.E. Wolfgang, and R.M. Figlio 1990 Delinquency Careers in Two Birth Cohorts. New York: Plenum Press.
Van Dine, S., J.P. Conrad, and S. Dinitz 1979 Restraining the Wicked. The Incapacitation of the Dangerous Criminal. Lexington, Mass.: Lexington Books.
Visher, C.A. 1987 Incapacitation and crime control: Does a "lock `em up" strategy reduce crime? Justice Quarterly 4(4):514-543.
Walker, L.E. 1979 The Battered Woman. New York: Harper and Row.
Weiner, N.A. 1989 Violent criminal careers and "violent career criminals." In N.A. Weiner and M.E. Wolfgang, eds., Violent Crime, Violent Criminals . Newbury Park, Calif.: Sage Publications.
White, S.O., and M.A. Strauss 1981 The implications of family violence for rehabilitation strategies. In S.E. Martin, L. Sechrest, and R. Redner, eds., New Directions in the Rehabilitation of Criminal Offenders. Washington, D.C.: National Academy Press.
Williams, K., and R. Hawkins 1986 Perceptual research on general deterrence: A critical review. Law and Society Review 20(4):545-572.
Wolfgang, M.E., R.M. Figlio, and T. Sellin 1972 Delinquency in a Birth Cohort. Chicago: University of Chicago Press.
Zedlewski, D.W. 1987 Making Confinement Decisions. National Institute of Justice. Washington, D.C.: U.S. Department of Justice.
Zimring, F.E., and G.J. Hawkins 1973 Deterrence. Chicago: University of Chicago Press.
1988 The New Mathematics of Imprisonment. Working paper No. 8, Earl Warren Legal Institute, School of Law, University of California, Berkeley.
TABLE A-1 Descriptive Statistics for Offending Variables
|
|
Reported Crimes per 100,000 Populationa (CRT) |
Adult Fraction of Crimesb (ADT) |
||||
|
Crime Type and State |
n |
Mean |
SD |
n |
Mean |
SD |
|
Murder |
|
|
|
|
|
|
|
California |
23 |
9.413 |
2.584 |
23 |
0.891 |
0.019 |
|
Florida |
21 |
11.900 |
1.599 |
21 |
0.930 |
0.019 |
|
Michigan |
20 |
9.551 |
2.384 |
20 |
0.901 |
0.022 |
|
New York |
23 |
9.812 |
2.451 |
23 |
0.895 |
0.036 |
|
Pennsylvania |
21 |
5.229 |
1.044 |
21 |
0.873 |
0.057 |
|
Texas |
9 |
14.075 |
1.923 |
9 |
0.916 |
0.016 |
|
Rape |
|
|
|
|
|
|
|
California |
24 |
41.658 |
9.696 |
24 |
0.859 |
0.034 |
|
Florida |
23 |
37.293 |
15.026 |
23 |
0.817 |
0.050 |
|
Michigan |
22 |
41.325 |
16.762 |
22 |
0.812 |
0.050 |
|
New York |
23 |
24.819 |
7.237 |
23 |
0.824 |
0.046 |
|
Pennsylvania |
21 |
17.776 |
5.878 |
21 |
0.790 |
0.047 |
|
Texas |
9 |
46.696 |
3.545 |
9 |
0.889 |
0.020 |
|
Robbery |
|
|
|
|
|
|
|
California |
24 |
271.505 |
78.001 |
24 |
0.754 |
0.055 |
|
Florida |
23 |
235.886 |
85.813 |
23 |
0.753 |
0.052 |
|
Michigan |
22 |
267.332 |
63.825 |
22 |
0.697 |
0.098 |
|
New York |
23 |
462.591 |
141.094 |
23 |
0.649 |
0.102 |
|
Pennsylvania |
21 |
129.545 |
41.438 |
21 |
0.642 |
0.057 |
|
Texas |
9 |
206.934 |
22.719 |
9 |
0.839 |
0.029 |
|
Aggravated assault |
|
|
|
|
|
|
|
California |
24 |
333.190 |
119.661 |
24 |
0.831 |
0.038 |
|
Florida |
23 |
422.622 |
139.843 |
23 |
0.843 |
0.024 |
|
Michigan |
22 |
276.383 |
93.965 |
22 |
0.774 |
0.076 |
|
New York |
21 |
310.615 |
92.158 |
21 |
0.848 |
0.045 |
|
Pennsylvania |
21 |
125.923 |
41.206 |
21 |
0.782 |
0.069 |
|
Texas |
9 |
300.022 |
39.893 |
9 |
0.886 |
0.018 |
|
Burglary |
|
|
|
|
|
|
|
California |
24 |
1841.936 |
310.668 |
24 |
0.564 |
0.081 |
|
Florida |
23 |
1827.666 |
431.777 |
23 |
0.492 |
0.113 |
|
Michigan |
22 |
1480.715 |
312.157 |
22 |
0.510 |
0.129 |
|
New York |
23 |
1422.106 |
301.340 |
23 |
0.593 |
0.109 |
|
Pennsylvania |
21 |
733.388 |
182.121 |
21 |
0.532 |
0.065 |
|
Texas |
9 |
1879.704 |
186.837 |
9 |
0.636 |
0.060 |
|
Drug offensesc |
|
|
|
|
|
|
|
California |
24 |
519.247 |
265.595 |
24 |
0.808 |
0.071 |
|
Florida |
21 |
238.553 |
141.086 |
21 |
0.806 |
0.088 |
|
|
Reported Crimes per 100,000 Populationa (CRT) |
Adult Fraction of Crimesb (ADT) |
||||
|
Crime Type and State |
n |
Mean |
SD |
n |
Mean |
SD |
|
Michigan |
22 |
175.690 |
105.093 |
22 |
0.807 |
0.085 |
|
New York |
23 |
298.523 |
176.242 |
23 |
0.869 |
0.058 |
|
Pennsylvania |
21 |
105.363 |
51.907 |
21 |
0.814 |
0.086 |
|
Texas |
9 |
334.005 |
32.468 |
9 |
0.901 |
0.038 |
|
NOTE: SD = standard deviation. a The crime rate is estimated from the ration of the number of crimes reported by police to the total population in each state. Data on reported crimes in each state were obtained from the Federal Bureau of Investigation (annual) Uniform Crime Reports. Annual population estimates for each state were obtained from Bureau of the Census (1969, 1970, 1980, 1988, and 1989). b The adult fraction of crimes (adult %) is estimated from the adult fraction of arrests in each state obtained from unpublished supplementary tables of statewide arrest counts from the FBI annual Uniform Crime Reports program. c Independent data are not available on the number of crimes committed for drug offenses, and the "crime rate" reported here is the number of arrests per 100,000 population. |
||||||
TABLE A-2 Descriptive Statistics for Sanction Risk Variables
|
|
Arrest Risk per Reported Crime, qaa |
Incarceration Risk per Arrest, Qib |
||||
|
Crime Type and State |
n |
Mean |
SD |
n |
Mean |
SD |
|
Murder |
|
|
|
|
|
|
|
California |
23 |
1.070 |
0.114 |
22 |
0.372 |
0.073 |
|
Florida |
21 |
0.769 |
0.122 |
21 |
0.765 |
0.211 |
|
Michigan |
20 |
0.915 |
0.156 |
20 |
0.433 |
0.070 |
|
New York |
23 |
0.789 |
0.095 |
23 |
0.628 |
0.129 |
|
Pennsylvania |
21 |
0.983 |
0.119 |
12 |
0.671 |
0.128 |
|
Texas |
9 |
0.810 |
0.070 |
9 |
0.625 |
0.051 |
|
Rape |
|
|
|
|
|
|
|
California |
24 |
0.356 |
0.033 |
23 |
0.107 |
0.043 |
|
Florida |
23 |
0.351 |
0.065 |
21 |
0.261 |
0.091 |
|
Michigan |
22 |
0.358 |
0.037 |
21 |
0.268 |
0.113 |
|
New York |
23 |
0.454 |
0.060 |
23 |
0.097 |
0.039 |
|
Pennsylvania |
21 |
0.613 |
0.085 |
12 |
0.152 |
0.021 |
|
Texas |
9 |
0.278 |
0.028 |
9 |
0.341 |
0.097 |
|
Robbery |
|
|
|
|
|
|
|
California |
24 |
0.340 |
0.062 |
23 |
0.116 |
0.031 |
|
Florida |
23 |
0.254 |
0.039 |
23 |
0.336 |
0.071 |
|
Michigan |
22 |
0.188 |
0.028 |
21 |
0.304 |
0.062 |
|
New York |
23 |
0.241 |
0.033 |
23 |
0.186 |
0.043 |
|
Pennsylvania |
21 |
0.404 |
0.039 |
12 |
0.135 |
0.020 |
|
Texas |
9 |
0.213 |
0.021 |
9 |
0.322 |
0.051 |
|
Aggravated assault |
|
|
|
|
|
|
|
California |
24 |
0.477 |
0.041 |
23 |
0.026 |
0.008 |
|
Florida |
23 |
0.343 |
0.077 |
23 |
0.055 |
0.019 |
|
Michigan |
22 |
0.291 |
0.035 |
21 |
0.059 |
0.010 |
|
New York |
21 |
0.419 |
0.043 |
21 |
0.022 |
0.004 |
|
Pennsylvania |
21 |
0.507 |
0.044 |
12 |
0.032 |
0.006 |
|
Texas |
9 |
0.299 |
0.013 |
9 |
0.059 |
0.009 |
|
Burglary |
|
|
|
|
|
|
|
California |
24 |
0.165 |
0.010 |
23 |
0.049 |
0.023 |
|
Florida |
23 |
0.133 |
0.019 |
23 |
0.220 |
0.086 |
|
Michigan |
22 |
0.116 |
0.024 |
21 |
0.139 |
0.027 |
|
New York |
23 |
0.108 |
0.019 |
23 |
0.071 |
0.041 |
|
Pennsylvania |
21 |
0.182 |
0.022 |
12 |
0.073 |
0.012 |
|
Texas |
9 |
0.108 |
0.009 |
9 |
0.237 |
0.019 |
|
Drug offensesc |
|
|
|
|
|
|
|
California |
24 |
1.000 |
0.000 |
23 |
0.020 |
0.014 |
|
Florida |
21 |
1.000 |
0.000 |
21 |
0.073 |
0.064 |
|
|
Arrest Risk per Reported Crime, qaa |
Incarceration Risk per Arrest, Qib |
||||
|
Crime Type and State |
n |
Mean |
SD |
n |
Mean |
SD |
|
Michigan |
22 |
1.000 |
0.000 |
21 |
0.063 |
0.074 |
|
New York |
23 |
1.000 |
0.000 |
23 |
0.028 |
0.011 |
|
Pennsylvania |
21 |
1.000 |
0.000 |
12 |
0.025 |
0.003 |
|
Texas |
9 |
1.000 |
0.000 |
9 |
0.050 |
0.021 |
|
NOTE: SD = standard deviation. a The arrest risk per crime (qa) is estimated from the ratio of adult arrests (>18 years of age) in each state to the estimated number of adult crimes reported by police. Adult crimes in each state are estimated from the product of adult % and crime rate (see Table A-1). Arrest data by state were obtained from unpublished supplementary tables from the FBI Uniform Crime Reports program. The arrest risk per crime reported here overstates the actual risk of arrest per crime by about threefold for rape, fourfold for robbery, and fivefold for aggravated assault (see discussion of qa in the main text.) Appropriate adjustments for crimes that are not reported to police and for multiple offenders per crime incident will have similar impacts in reducing qa for burglary and drug offenses. b The incarceration risk per arrest (Qi) is estimated from the ratio of annual commitments to prison on a new conviction to the number of adult arrests in each state. Arrest data for each state were obtained from unpublished supplementary tables from the FBI Uniform Crime Reports program, and data on the number of commitments to prison are from annual published reports of the corrections department in each state. c Separate crime and arrest data are not available for drug offenses. Annual arrest counts are used in the crime rate variable (Table A-1), and the arrest risk per crime is set to 1.0. |
||||||
TABLE A-3 Descriptive Statistics for Average Time (years) Served in Prisona
|
|
Mean Time (years) Served per Prison Commitment, Sb |
||
|
Crime Type and State |
n |
Mean |
SD |
|
Murder |
|
|
|
|
California |
22 |
5.04 |
0.88 |
|
Florida |
13 |
4.50 |
0.65 |
|
Michigan |
12 |
5.70 |
1.23 |
|
New York |
23 |
5.02 |
1.39 |
|
Pennsylvania |
9 |
7.29 |
1.18 |
|
Texas |
9 |
4.83 |
0.54 |
|
Rape |
|
|
|
|
California |
23 |
4.18 |
1.22 |
|
Florida |
13 |
3.89 |
0.48 |
|
Michigan |
13 |
2.96 |
0.55 |
|
New York |
23 |
4.57 |
1.35 |
|
Pennsylvania |
9 |
5.36 |
0.68 |
|
Texas |
9 |
3.76 |
1.00 |
|
Robbery |
|
|
|
|
California |
23 |
3.95 |
1.39 |
|
Florida |
15 |
2.83 |
0.56 |
|
Michigan |
13 |
3.10 |
0.66 |
|
New York |
23 |
2.88 |
0.76 |
|
Pennsylvania |
9 |
4.24 |
1.17 |
|
Texas |
9 |
3.92 |
0.43 |
|
Aggravated assault |
|
|
|
|
California |
23 |
2.80 |
0.77 |
|
Florida |
15 |
1.79 |
0.46 |
|
Michigan |
13 |
2.22 |
0.35 |
|
New York |
21 |
2.30 |
0.33 |
|
Pennsylvania |
9 |
2.60 |
0.54 |
|
Texas |
9 |
1.56 |
0.12 |
|
Burglary |
|
|
|
|
California |
23 |
2.64 |
1.06 |
|
Florida |
15 |
1.57 |
0.29 |
|
Michigan |
13 |
1.89 |
0.39 |
|
New York |
23 |
2.36 |
0.66 |
|
Pennsylvania |
9 |
2.99 |
0.96 |
|
Texas |
9 |
1.84 |
0.15 |
|
|
Mean Time (years) Served per Prison Commitment, Sb |
||
|
Crime Type and State |
n |
Mean |
SD |
|
Drug offenses |
|
|
|
|
California |
22 |
2.71 |
1.30 |
|
Florida |
13 |
1.36 |
0.21 |
|
Michigan |
13 |
1.51 |
0.28 |
|
New York |
23 |
2.13 |
0.36 |
|
Pennsylvania |
9 |
1.72 |
0.17 |
|
Texas |
9 |
1.27 |
0.37 |
|
NOTE: SD = standard deviation. a Average time served in prison (years) is the total time served from the original commitment from court on a new conviction until an inmate is unconditionally released, including time served until first release from prison and any time served following parole revocation. Data on commitments to prison and resident inmates were obtained from annual published reports of the corrections department in each state. b The measure of time served (S) is obtained from the ratio of the number of resident inmates (available from a daily census of prison populations) to the number of new commitments to prison each year. This stock-over-flow measure is reasonable when commitments to prison and time served are stable over time, but is vulnerable to error when there are large variations in these data from year to year. |
|||
An alternative measure of time served, S*, incorporates data from several years on the number of inmates remaining in prison at the end of a year, thus smoothing unusual changes in the annual number of commitments to prison (Canela-Cacho and Cohen, 1991). Although differing somewhat in magnitude—with S generally lower than S* due to unusually large increases in commitments to prison in some years—the two estimates nevertheless change similarly over time.
TABLE A-4 Descriptive Statistics for Imprisonment Variables
|
|
Incarceration Rate per 100,000 Populationa |
Expected Time Served (person-years) per 100 Arrests, QiSb |
||||
|
Crime Type and State |
n |
Mean |
SD |
n |
Mean |
SD |
|
Murder |
|
|
|
|
|
|
|
California |
23 |
17.094 |
7.242 |
23 |
193.16 |
59.89 |
|
Florida |
13 |
34.053 |
6.965 |
12 |
373.49 |
103.85 |
|
Michigan |
12 |
23.294 |
6.334 |
12 |
244.63 |
57.32 |
|
New York |
23 |
21.841 |
10.355 |
23 |
313.64 |
102.92 |
|
Pennsylvania |
9 |
23.447 |
4.975 |
9 |
509.34 |
153.12 |
|
Texas |
9 |
30.951 |
2.047 |
9 |
302.04 |
41.14 |
|
Rape |
|
|
|
|
|
|
|
California |
24 |
5.423 |
2.520 |
24 |
42.30 |
14.19 |
|
Florida |
14 |
15.272 |
4.821 |
14 |
113.26 |
28.41 |
|
Michigan |
13 |
16.160 |
10.343 |
13 |
98.50 |
38.13 |
|
New York |
23 |
4.284 |
2.778 |
23 |
43.20 |
19.27 |
|
Pennsylvania |
9 |
8.770 |
2.709 |
9 |
81.20 |
20.69 |
|
Texas |
9 |
14.399 |
5.564 |
9 |
125.38 |
46.46 |
|
Robbery |
|
|
|
|
|
|
|
California |
24 |
27.766 |
5.466 |
24 |
42.89 |
10.08 |
|
Florida |
15 |
49.109 |
6.670 |
15 |
90.99 |
23.80 |
|
Michigan |
13 |
36.597 |
7.178 |
13 |
95.84 |
28.00 |
|
New York |
23 |
37.749 |
18.131 |
23 |
53.03 |
16.23 |
|
Pennsylvania |
9 |
24.867 |
5.006 |
9 |
53.42 |
11.27 |
|
Texas |
9 |
45.696 |
4.607 |
9 |
125.15 |
17.07 |
|
Aggravated assault |
|
|
|
|
|
|
|
California |
24 |
9.143 |
4.129 |
24 |
7.22 |
2.39 |
|
Florida |
15 |
12.852 |
2.258 |
15 |
8.00 |
1.27 |
|
Michigan |
13 |
9.506 |
3.891 |
13 |
12.65 |
3.10 |
|
New York |
21 |
5.326 |
1.436 |
21 |
5.06 |
1.45 |
|
Pennsylvania |
9 |
6.184 |
2.336 |
9 |
8.61 |
2.31 |
|
Texas |
9 |
7.297 |
1.450 |
9 |
9.13 |
0.99 |
|
Burglary |
|
|
|
|
|
|
|
California |
24 |
20.704 |
11.496 |
24 |
12.12 |
5.80 |
|
Florida |
15 |
43.941 |
10.128 |
15 |
27.30 |
4.10 |
|
Michigan |
13 |
24.762 |
7.579 |
13 |
26.71 |
7.65 |
|
New York |
23 |
14.752 |
9.225 |
23 |
16.12 |
8.44 |
|
Pennsylvania |
9 |
17.597 |
3.581 |
9 |
21.60 |
5.88 |
|
Texas |
9 |
55.826 |
4.581 |
9 |
43.79 |
5.46 |
|
|
Incarceration Rate per 100,000 Populationa |
Expected Time Served (person-years) per 100 Arrests, QiSb |
||||
|
Crime Type and State |
n |
Mean |
SD |
n |
Mean |
SD |
|
Drug offenses |
|
|
|
|
|
|
|
California |
24 |
17.132 |
11.840 |
24 |
6.00 |
7.32 |
|
Florida |
13 |
16.671 |
3.588 |
13 |
6.09 |
0.88 |
|
Michigan |
13 |
8.788 |
3.566 |
13 |
5.15 |
2.26 |
|
New York |
23 |
15.835 |
14.446 |
23 |
5.90 |
2.02 |
|
Pennsylvania |
9 |
5.089 |
2.354 |
9 |
4.20 |
0.60 |
|
Texas |
9 |
17.717 |
4.649 |
9 |
5.82 |
0.94 |
|
NOTE: SD = standard deviation. a The incarceration rate is obtained from the ratio of the number of resident inmates in a daily census of prison populations each year to the total population of each state. Inmate data were obtained from annual published reports of the corrections department in each state. Annual population estimates for each state were obtained from Bureau of Census (1969, 1970, 1980, 1988, and 1989). b The expected time served per arrest (QiS) reflects the number of person-years served in prison per 100 adult arrests in a year. It is obtained from the ratio of the number of resident inmates from a daily census of prison populations to the number of arrests of adults. Inmate data were obtained from annual published reports of the corrections department in each state. Arrest data by state were obtained from unpublished supplementary tables from the FBI Uniform Crime Reports program. |
||||||


