
4
Hazards to Space Operations from Debris
The hazard to space operations from debris is a function of the nature of those operations and the orbital region in which they take place. The orbital region is important because the debris flux encountered by a spacecraft varies greatly with orbital altitude and, to a lesser extent, orbital inclination. The nature of the operations is a factor because the same piece of debris that could cause serious damage to one type of spacecraft might do little harm to a spacecraft with a different configuration or orbital attitude.
The first step in determining the hazard to a spacecraft from orbital debris is to estimate the debris flux for the spacecraft's orbital region. This information can then be combined with information on the spacecraft's configuration and orbital attitude, and with experimental data and models of the damage caused by hypervelocity impacts, to predict the likelihood that debris will cause damage to the spacecraft during its functional lifetime. The accuracy of such a prediction will depend on (1) the degree to which estimates of the debris flux are correct, and (2) the validity of models used to predict impact damage from debris. As discussed in Chapters 2 and 3, the debris flux in any particular orbital region cannot be determined with a great degree of accuracy because of the uncertainty in current assessments of the debris population (particularly the small, medium-sized, and high-altitude populations). As discussed in Chapter 5, the accuracy of damage predictions for debris impacts is also uncertain. Because both of these factors contain uncertainties, any predictions of the debris hazard to spacecraft will also incorporate a significant degree of uncertainty.
CHANCE OF DEBRIS IMPACT
The probability that debris will collide with a given spacecraft depends on the spacecraft's size and the debris flux through its orbital region. The effect of spacecraft size on the likelihood of being struck is simple; the chance of impact is directly proportional to the spacecraft's cross-sectional area relative to the debris flux and the amount of time exposed to the environment. The relationship between the probability of collision and the orbital region is far more complex, varying significantly with altitude and to a lesser degree with inclination.
Low Earth Orbit
Although Figure 4-1 oversimplifies the nature of the LEO debris population, it provides a starting point for estimating the debris impact probability for spacecraft in LEO by showing how the flux of debris varies with debris size. The main oversimplification is the grouping of data
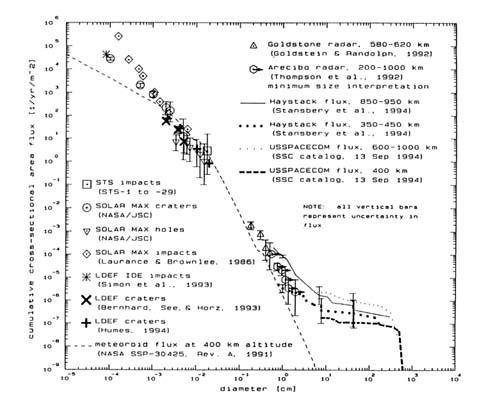
FIGURE 4-1 Approximate debris flux in LEO by object size.

FIGURE 4-2 Flux of LEO cataloged objects, 1994 (assumed velocity 10 km/s).
SOURCE: Prepared by Kaman Sciences Corporation based in part on U.S. Space Command data.
acquired at a variety of altitude regimes at different times during a seven-year period. The uncertainty of debris population estimates is, however, reflected by the error bars in the figure.
Figure 4-1 predicts the average number of collisions with different sizes of debris that a spacecraft in a ''typical" low Earth orbit will experience in a 10-year orbital lifetime. For example, the probability that a spacecraft in LEO with a cross-sectional area of 10 square meters will collide with an object larger than about 1 cm in diameter over its 10-year functional lifetime can be seen to be somewhere between one in a hundred and one in a thousand. The figure also predicts that the same spacecraft will be struck by about one 1-mm- to 1-cm-diameter particle and somewhere between 100 and 1,000 particles with diameters between 0.1 mm and 1 mm during this time period.
The chances of a spacecraft in LEO being struck by debris can vary significantly from those estimates, depending on the spacecraft's particular orbit. Figure 4-2 shows the variation in flux for cataloged objects in LEO as a function of altitude. While this figure does not show the uncataloged debris flux, the Haystack data have shown that uncataloged debris as small as 0.7 cm in diameter follow a similar distribution to the cataloged flux throughout much of LEO (as discussed in Chapter 3). Figure 4-3 shows an estimate by NASA's EVOLVE model of the flux of large
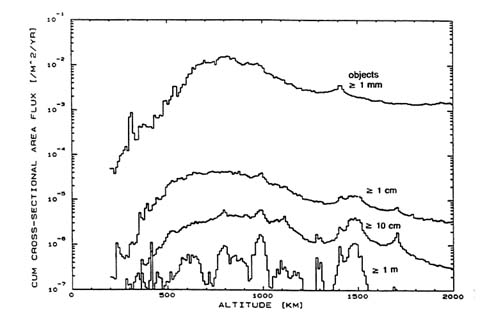
FIGURE 4-3 One model’s prediction of the LEO debris hazard. SOURCE: NASA/Reynolds.
and medium objects in LEO. There are some differences between these measurements and predictions, but they all show large variations in the LEO flux (and thus the probability that a spacecraft in LEO will be struck) with altitude. For example, at a typical Space Shuttle orbital altitude of 300 km, the flux of both medium and large debris is about 50 times lower than if it were in an orbit at 1,000-km altitude. (At this altitude, the collision probability will also vary by more than a factor of two due to solar activity.) Since data on the altitude variation of the small debris population do not exist and model predictions vary significantly depending on the sources of these smaller particles, it is unclear whether the chance of being struck by small debris also exhibits such a large variation with altitude.
Collision probability also varies with orbital inclination, although to a much lesser extent than it varies with altitude. The variation with inclination is relatively small because, to a first approximation, two circular orbits at the same altitude will intersect twice per revolution, irrespective of their inclinations. More detailed examinations of the variation of collision probability with inclination (e.g., Kessler, 1981) indicate that collision probability for an orbiting object increases to its maximum value
when there are objects in orbits with supplementary inclinations. For example, objects in orbits with inclinations near 80 degrees have a higher collision probability due to the large number of objects in Sun-synchronous orbits with inclinations near 100 degrees. (Similarly, objects in those orbits have higher collision probabilities due to the objects in orbits with inclinations near 80 degrees.) Since there are very few objects in orbits with inclinations greater than 120 degrees, objects with inclinations less than about 60 degrees do not experience a similar rise in collision probability.
Figure 4-4 shows the "average" variation in collision probability with inclination for all altitudes below 1,000 km based on the cataloged population. Because the orbital inclination distribution varies slightly with both time and altitude, this variation in collision probability with inclination will also change as a function of time and altitude. In addition, since measurements made with the Haystack radar suggest that the medium-sized debris population is less concentrated in the higher inclinations than the large debris population (see Chapter 3), the increase in collision
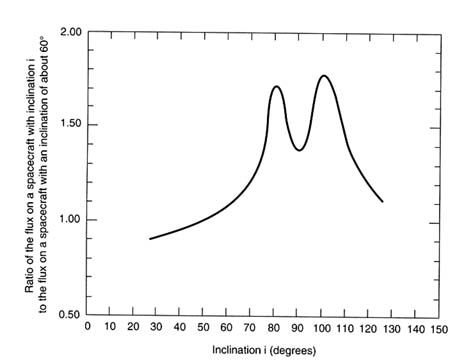
FIGURE 4-4 Average collision probability variation with orbital inclination for cataloged LEO objects. SOURCE: National Aeronautics and Space Administration, based on data from the 1988 U.S. Space Command Catalog.
|
BOX 4-1 The Meteoroid Environment Meteoroids revolve about the Sun and steadily rain upon the Earth and on objects in Earth orbit. About 40,000 (±20,000) metric tons of meteoroids enter the Earth's atmosphere each year (Love and Brownlee, 1993). The intensity of this natural environment is often used to establish a threshold of concern for the orbital debris environment. The onset of space exploration, particularly human space flight, prompted efforts to assess the potential hazard posed to spacecraft by the natural meteoroid environment. Numerous measurements conducted during the 1960s, including the large-area meteoroid detectors deployed by three Pegasus spacecraft in 1965, revealed that the threat of colliding with a meteoroid capable of inflicting significant damage to a spacecraft was remote. (The probability that a square meter of exposed surface in LEO will be struck by a 1-cm-diameter meteoroid during a year in space is about one in a million.) Simple design features are capable of protecting spacecraft against the predominately small and light (average meteoroid density is about 0.5 g/cm3) particles. Figure 4-5 shows the estimated meteoroid flux that will be experienced at 500-km altitude. The meteoroid flux varies slowly with altitude due both to shielding by the Earth (which can decrease the flux by as much as a factor of two at low altitudes) and to the Earth's gravity field (which can increase the flux near the Earth by as much as a factor of two) (Kessler, 1972). Just above the Earth's atmosphere, the average velocity of a meteoroid is about 17 km/s; at lunar distances, the average velocity is about 15 km/s. Average meteoroid collision velocities with orbiting spacecraft would be higher by a few kilometers per second, depending on the orbit of the spacecraft (Kessler, 1969). |
probability with medium-sized objects at high inclinations may not be as great as the estimated increase shown (for cataloged objects) in Figure 4-4.
High Earth Orbits
Estimates of collision probabilities in high Earth orbits are less accurate than LEO collision probability estimates due to the sparse information available on the HEO debris population. (As described in Chapter 2, there are no measurements above LEO of the small debris population, the medium-sized debris population, or even the smaller objects in the large debris population.) It is certain, however, that the chance of collision with cataloged objects is generally much lower in HEO than it is in LEO. As shown in Figure 3-3, the average spatial density of cataloged objects in even the relatively densely populated semisynchronous and geosynchronous orbits is about 100 times lower than the average spatial density of cataloged objects in LEO. In less densely populated high Earth orbits, the spatial density of cataloged objects is often 1,000 times lower
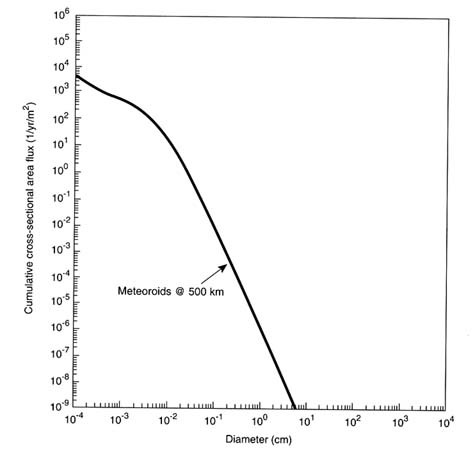
FIGURE 4-5 Meteoroid environment at 500 km altitude.
SOURCE: Grün et al., 1985.
than the average LEO spatial density. Although it is unclear how well the distribution of the uncataloged large and medium-sized debris population correlates with the tracked population, it is likely (considering the known sources and perturbing forces) that the average spatial density of these populations is also much lower in HEO than in LEO.
For GEO spacecraft, the chance of collision with cataloged objects decreases sharply with the distance from the geostationary orbit. Figure 4-6 shows how the cataloged space object flux (and thus the probability of collision with a cataloged object) in the GEO region varies as a function of altitude above and below GEO. The flux drops by almost a factor of ten about 50 km above or below the exact geostationary orbit and is approximately two orders of magnitude lower only 500 km above or
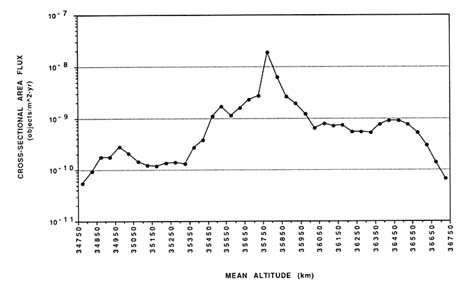
FIGURE 4-6 GEO cross-sectional area flux (0 ± 5 degree latitude, 50-km bins). SOURCE: Kaman Sciences Corporation.
below GEO. Spacecraft in an inclined GEO experience about the same flux as shown in Figure 4-6 because spacecraft in such orbits pass through the relatively crowded equatorial geostationary band twice a day, no matter what their inclination.
Because of the difficulty of detecting objects smaller than about a meter in diameter in GEO or even of detecting breakups that could produce smaller objects, the collision hazard from uncataloged debris in GEO is not well known. However, by using the assumption that debris sources in GEO are similar to debris sources in LEO, one model (Kessler, 1993) has predicted that the meteoroid environment will present a greater hazard than the debris environment over the small and medium-sized ranges even if numerous breakups occur. Figure 4-7 illustrates the results of that model.
Space objects in highly elliptical orbits experience different collision probabilities in different parts of their orbit. Objects in Molniya-type orbits experience a very low debris flux through most of their orbit but can spend a small portion of their orbit traveling at high velocities through the relatively intense LEO debris flux. Objects in Molniya orbits will never pass through GEO, and because of the large perigee changes they may experience, many no longer pass through LEO after several
years in orbit. However, objects in geostationary transfer orbits will experience the LEO debris flux at the perigee of their orbit as well as the GEO debris flux near their orbit's apogee when the precession of their orbit causes it to pass through GEO. (Figure 4-8 depicts the average time an object in a 27.5 degree inclination GTO will spend in LEO over its orbital lifetime.) Objects in GTO will spend much less time in geostationary orbit than in LEO because orbital precession causes them to pass through the narrow geostationary band only infrequently. This is fortunate because objects in GTO pass through GEO at about 2 km/s, much higher than typical GEO collision velocities.
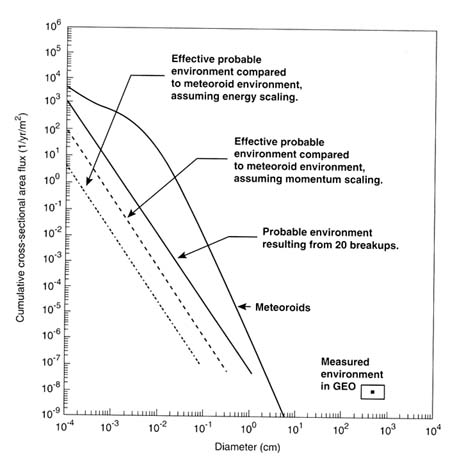
FIGURE 4-7 Estimated orbital debris environment in GEO resulting from satellite breakups. SOURCE: Kessler, 1993.
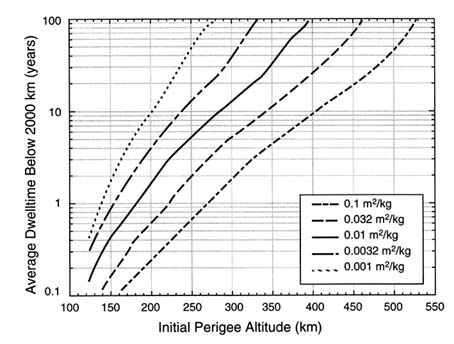
FIGURE 4-8 Average time spent in LEO for GTO, inclination 27.5 degrees.
Random choice for initial argument of perigee and right ascension of ascending node of orbit plane. SOURCE: National Aeronautics and Space Administration.
EFFECTS OF DEBRIS IMPACT
Impact Conditions
The damage caused by debris impact depends on the size and velocity of the impacting debris, the configuration and composition of the spacecraft being struck, the component(s) impacted, and the angle at which the impactor strikes the spacecraft. To protect their spacecraft against the debris hazard, designers can calculate typical collision velocities and impact angles and then, if necessary, modify their spacecraft design to protect the areas most likely to be struck by debris. While not perfect, analyses of typical collision velocities and impact angles are based on the known debris population, so they have less uncertainty than many of the other elements factored into debris hazard predictions.
Collision velocities vary with orbital altitude and inclination (see Box 4-2). In LEO, collision velocities vary from almost 0 km/s to greater than 15 km/s. Figure 4-9 shows the calculated proportion of collisions (with cataloged objects) at various velocities as a function of a LEO object's
|
BOX 4-2 Determining Collision Velocities Orbital velocities are directly related to altitude—objects in lower-altitude orbits move faster than objects in higher orbits. Orbital velocity for circular LEO orbits varies from almost 8 km/s (skimming the top of the atmosphere) to about 7 km/s (at 2,000 km). In GEO, orbital velocity is about 3 km/s. The velocity of objects in elliptical orbits varies throughout their orbits. At their perigee, they are moving faster than the local circular orbital velocity, and at apogee, they are moving slower than the local circular orbital velocity. Impact velocities for objects in circular orbits can vary from nearly 0 km/s for an object striking another object in virtually the same orbit to twice the orbital velocity for a head-on collision. (Collisions with objects in elliptical orbits can occur at even higher velocities.) As the angle at which the two objects' orbits intersect increases toward 180 degrees, so does the collision velocity. If the orbits of the two objects intersect with an angle of greater than 60 degrees, the relative collision velocity will be larger than the objects' orbital velocity. The impact velocity distribution of the debris flux on a space object is thus influenced by its orbital altitude, eccentricity, and inclination, as well as the eccentricity and inclination distribution of objects in intersecting orbits. |
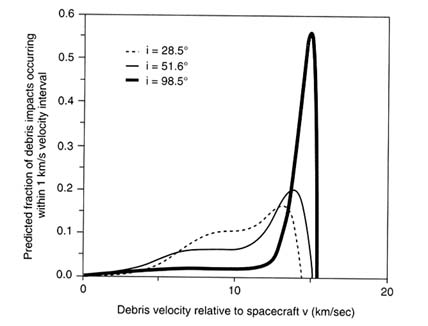
FIGURE 4-9 Calculated collision velocity distribution versus inclination for cataloged objects in LEO (averaged over all LEO altitudes).
SOURCE: Calculated from Kessler et al., 1989.
inclination. Clearly, the proportion of high-velocity collisions increases for objects in higher-inclination orbits. If the calculations incorporate the population of objects detected by the Haystack radar in addition to the cataloged population, the plotted variation of collision velocity with altitude looks similar to Figure 4-9, but with slightly lower average collision velocities at all inclinations. In a 51.6-degree-inclination orbit, for example, the predicted average collision velocity with cataloged objects is 10.8 km/s, but the predicted average collision velocity with objects detected by Haystack is 9.2 km/s.
In semisynchronous orbits, orbital velocity is only about 3.9 km/s, so the maximum collision velocity is 7.8 km/s. In practice, however, because most spacecraft in these orbits operate in constellations with inclinations near 60 degrees, the average collision velocity is closer to 4 km/s. In GEO, collision velocities are lower still, both because of the low orbital velocities and because the spacecraft and rocket bodies in GEO are traveling in the same direction and have only minor inclination differences (as discussed in Chapter 3). The long-term average GEO collision velocity due to the various differences in inclination is about 0.5 km/s, much less than the average LEO collision velocity (but still about the speed of a rifle bullet).
The angle at which debris is likely to strike a spacecraft is important for spacecraft designers interested in protecting sensitive components. Figure 4-10 predicts the directions from which debris would impact the
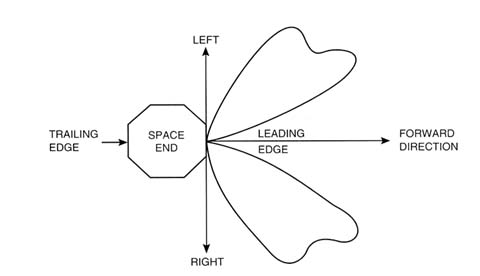
FIGURE 4-10 Direction of orbital debris impact predicted for the LDEF.
SOURCE: M&D SIG NASA Model (Chobotov, 1991).
LDEF in its 28.5 degree-inclination LEO orbit, based on the same calculations as Figure 4-9 and with the assumption that the relative velocities in that figure are due to circular orbits. For the same reasons that typical collision velocities change with inclination, the distribution of probable impact angles will be more tightly grouped around the direction of travel for spacecraft in higher-inclination LEO orbits and will be more widely distributed in GEO, where inclination differences between space object orbits are typically small. Debris in highly elliptical orbits may impact the sides and rear of a spacecraft more frequently than debris in circular orbits; such impacts were detected on the rear surfaces of LDEF.
Breakups Due to Debris Impact
Certain high-energy collisions may not just incapacitate a spacecraft, but actually fragment it into many small pieces. Although this distinction may not be important to a spacecraft designer, it is (as discussed in Chapter 8) very important for the future evolution of the debris population. As discussed in Chapter 2, models of such breakups are based on sparse data and contain large uncertainties. Current estimates indicate that complete breakup will occur if the ratio of the impactor's relative kinetic energy to the mass of the object with which it collides is greater than about 40 J/g (McKnight, 1993). For example, a 0.1-kg piece of debris impacting at 10 km/s would probably not completely fragment the Japanese Astro-D spacecraft (420 kg), but a 0.5-kg piece of debris impacting at the same velocity probably would. Of course, the particular geometry of
|
BOX 4-3 Breakup of Space Objects Containing Radioactive Materials Approximately 55 space objects containing radioactive materials currently orbit the Earth. Although no new spacecraft with nuclear power sources are currently planned for Earth orbit, it is possible that nuclear-powered spacecraft already in orbit may break up as a result of debris impact. Although many such spacecraft were designed so that their nuclear fuel would survive a launch pad explosion relatively intact, all are vulnerable to breakup if involved in a sufficiently high-energy collision. Radioactive fragments from such a breakup would not interfere with observations by astronomers (only operating reactors produce detectable amounts of x rays or gamma rays), but might reenter the atmosphere sooner than they would have if the spacecraft had remained intact. These small fragments would burn up in the atmosphere, potentially resulting in a slight increase in the background health risk. |
an impact is also important, because if the impactor struck a spacecraft's solar panel, for example, it would probably destroy only the panel, rather than the entire spacecraft (although it might cause the spacecraft to start spinning).
Breakup models also predict the number and mass of fragments produced in a catastrophic collision. The mass distribution is also related to the ratio of the impacting object's kinetic energy to the mass of the target space object; as this ratio increases, the number of large fragments produced also increases. For the example above (a 420-kg spacecraft struck by a 0.5-kg piece of debris at 13 km/s), models predict that 50 to 100 fragments with masses of greater than 0.5 kg—massive enough to cause a similar catastrophic breakup—would be produced. Though the total quantity of smaller fragments created in such a collision is more difficult to predict, the number of fragments would increase with decreasing fragment size, totaling millions of medium-sized particles.
These fragments will be ejected at a wide range of velocities, which will place them into a range of new orbits. In general, smaller fragments will be ejected with a wider range of initial velocities than larger ones and thus will be sent into a wider range of new orbits. The velocity of ejected fragments, however, is the most uncertain parameter predicted by breakup models. Figure 4-11 shows an estimate of how the maximum ejection velocities of debris produced in a collision are expected to vary as a function of particle size (Johnson, 1985).
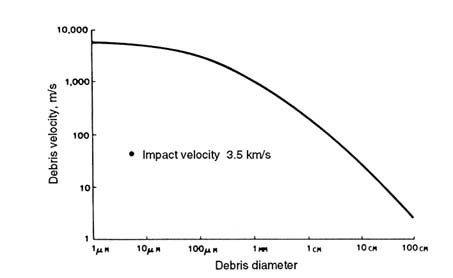
FIGURE 4-11 Maximum ejection velocities of debris as a function of particle diameter. SOURCE: Johnson, 1985.
Structural and Component Damage Caused by the Impact of Debris
In LEO, the impact of medium-sized debris can severely damage or destroy smaller spacecraft or major systems of large spacecraft. Box 4-4 illustrates the destructive force of medium-sized debris traveling at typical LEO collision velocities. In GEO, typical collision velocities are much lower—they are comparable to speeds involved in a midair aircraft collision—so only the largest medium-sized GEO particles are probably capable of causing serious damage.
Hypervelocity impact can cause various modes of damage to spacecraft, including craters, spallations, perforations, and petaled holes and cracks, depending on impact conditions and the configuration of the impacted spacecraft; this damage may result in different failure modes depending on the nature of the spacecraft and the location of the impact. When a piece of medium-sized debris strikes a spacecraft, it can either penetrate the spacecraft's skin or leave a crater on the surface. The impact can cause damage even if it does not penetrate the spacecraft's skin; reflection of the impact's shock wave can cause small particles to spall from the back of the impacted wall. These particles can travel at nearly the velocity of the impacting object, potentially causing serious damage to components inside the spacecraft.
If the impacting debris penetrates the spacecraft's outer skin, its often fragmented or liquefied remnants will travel into the spacecraft and deposit over an area typically significantly larger than the impact hole. The momentum of the impact can cause impulsive damage including buckling and bending of structural components and the transmission of a traveling shock wave through the spacecraft's structure and components. Table 4-1 shows NASA's 1970 assessment of the vulnerability of a spacecraft's subsystems to various modes of hypervelocity impact damage.
The effects of the impact of a 1-cm-diameter aluminum sphere on a
|
BOX 4-4 Energy of High Velocity Objects The kinetic energy of an object increases with the square of its velocity. The energy of an object moving at 13 km/s (a typical impact velocity in LEO) is roughly equivalent to the energy released by the explosion of 40 times its mass of TNT. For example, a 1-cm-diameter aluminum sphere (which has a mass of about 1.4 grams) moving at 13 km/s has a kinetic energy equivalent to the energy released by the explosion of 56 grams of TNT (about 0.24 MJ); for a 10-cm aluminum sphere, the equivalent is 56 kg of TNT (about 236 MJ). |
TABLE 4-1 Potential Failure Modes of Subsystems as a Result of Debris Impact
|
|
Subsystems |
|||||
|
Probable Critical Types of Failure |
Pressure Cabins |
Tanks |
Radiators |
Windows |
Electronics |
Special Surfaces |
|
Catastrophic Rupture |
x |
x |
|
x |
|
|
|
Detached Spalling |
x |
x |
x |
|
x |
|
|
Secondary Fractures |
|
|
x |
|
x |
|
|
Leakage |
x |
x |
x |
|
|
|
|
Shock Pulse |
x |
|
|
x |
x |
|
|
Vapor Flash |
x |
|
|
|
|
|
|
Deflagration |
|
x |
|
|
|
|
|
Deformation |
|
|
x |
|
x |
|
|
Reduced Residual Strength |
x |
x |
x |
x |
|
|
|
Fluid Contamination |
|
x |
x |
|
|
|
|
Thermal Insulation Damage |
x |
x |
|
|
|
|
|
Obscuration |
|
|
|
x |
|
|
|
Erosion |
|
|
|
x |
|
x |
|
x, Subsystem is vulnerable to damage mode SOURCE: NASA, 1970. |
||||||
|
BOX 4-5 Hazards to Crewed Missions Penetration of the pressure wall of a crewed spacecraft can lead to the loss of cabin pressure, secondary spall impacts on the interior, a light flash, and a pressure pulse. In addition, cracks created by the impact exceeding the critical crack length for a pressurized module can, under some conditions, lead to catastrophic fracture or the uncontrolled mode of crack propagation known as ''unzipping." Astronauts or cosmonauts engaging in extra-vehicular activities are particularly vulnerable to the impact of small debris. On average, debris 1 mm in diameter is capable of perforating current U.S. space suits (Cour-Palais, 1991). |
0.5-cm-thick aluminum spacecraft wall at 10 km/s are illustrative of the damage that can be caused by debris impact. Such a collision would fully melt and partially vaporize the impactor and would create a perforation in the spacecraft wall with an outer diameter of approximately 3.3 cm and an inner hole diameter of approximately 2.7 cm. The peak impact stress caused by the expanding liquid projectile and wall material on a component located 2.5 cm behind the perforated wall would be approximately 450 kbar, well above the yield strength for most typical spacecraft structural materials. The peak impact stress decreases with the cube of the distance from the wall, so that the loading on a component 15 cm behind the wall would only be about 2 kbar (still close to the yield strength of commonly used aluminum alloys).
Even small impactors can cause component failures. For example, a particle as small as 0.75-mm diameter impacting 0.5-cm-thick aluminum housing covering a component such as a solar array pointing/steering motor could result in the spallation of the internal housing wall, potentially damaging or jamming the motor. At collision velocities of 10 km/s, particles as small as 1 mm in diameter can perforate a radiator with thin-walled heat pipes (such as those used for space nuclear reactor cooling). If (as is the case with some proposed space nuclear reactor designs) the coolant loop is not designed to allow shutdown of perforated radiator coolant pipes, a loss of coolant could occur.
Surface Degradation Caused by the Impact of Debris
Even if the impacts of smaller debris do not cause structural or component damage, the craters, spallations, and perforations they produce in impacted materials can degrade spacecraft surfaces. (Figure 4-12 shows the surface degradation resulting from an impact into LDEF.) In lami-
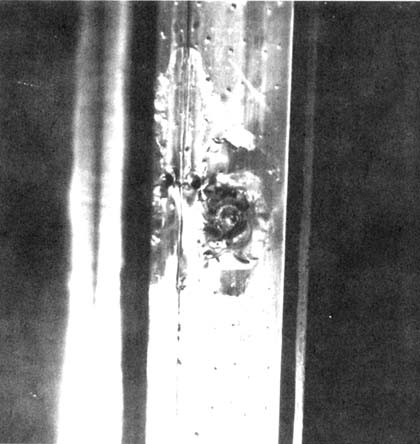
FIGURE 4-12 The largest impact crater on LDEF. The central crater measures 5.2 mm in diameter, but ejecta from the crater are spread out over a much larger area. Most experts believe this crater was formed as a result of an impact with orbital debris.
SOURCE: National Aeronautics and Space Administration.
nated or multilayered materials, the impact shock can cause delaminations and remove surface coating material far beyond the diameter of the crater. In brittle materials, the impact can initiate cracks extending far beyond the diameter of the crater or perforation. Small debris impacts may also create localized plasmas, which can cause discharges and failures in some components such as electronics or solar arrays. In addition, impact damage may combine with other space environmental effects (such as those caused by atomic oxygen and ultraviolet light) to cause more damage to surfaces than each effect could cause individually.
The spacecraft surface degradation caused by the impact of small orbital debris particles can lead to deterioration of spacecraft performance. With few exceptions, though, performance deterioration models do not exist, and those that do exist are not standardized. One problem is that performance losses are not always directly related to the extent of physical damage caused by debris impact (or to the size of the impacting particles). The effect of surface degradation from debris impact must thus be addressed on a case-by-case basis to evaluate changes in component and system performance.
Optical surfaces are the spacecraft component perhaps most threatened by surface degradation due to debris impact. Impacts by small particles (tens to hundreds of microns in diameter) can significantly increase the light scattered from an optic (Watts et al., 1994). This is particularly important for imaging optics, which usually require very low levels of optical scatter. Small debris impacts into telescope tubes or optical baffles can also degrade optical components by releasing large amounts of particulates (which can temporarily confuse or blind optical sensors) or contaminants (which can affect the scattering of an optical sensor).
Impacts into thermal control components can affect the total available surface area, potentially affecting thermal conduction and radiation and exposing protected areas to the space environment. On LDEF, cratering damage removed approximately 0.26 percent of exposed paint, but the impact-associated front surface spalls increased the total material
|
BOX 4-6 The Effect of Debris on Tethers Tethers are just beginning to be used in space operations but have a great deal of promise for future applications. Tethers are particularly vulnerable to even small debris because, due to their extremely long and thin shapes, they have large surface areas yet can be severed by a sufficiently large debris impact anywhere along their length. Based on estimates of the flux of small debris and meteoroids, it has been predicted that a 1-mm-diameter, 20-km-long, single-strand aluminum tether at 500 km will be severed by either meteoroids or debris in an average of three weeks (Kessler, 1984). Either increasing the thickness of the tether or using multiple strands will increase this time. Meteoroid impacts are the primary hazard to tethers thinner than a few millimeters in diameter; tethers thicker than a few millimeters in diameter face a greater danger from orbital debris. The 20-km-long, 0.75-mm-thick polyethylene fiber SEDS-2 tether, which was launched into a 540-km circular orbit by a Delta vehicle in 1994, was severed five days after launch, probably by a micrometeoroid. |
removal to as much as 5 percent of the exposed paint areas (Coombs et al., 1992). Such loss of thermal control area is probably a minor issue, however, because it can be handled easily through oversizing in design. (Oversizing and other operational protection schemes are discussed in Chapter 6.) Perforation of thermal control blankets can also damage thermal control systems by delaminating layers and exposing protected components to the space environment (Allbrooks and Atkinson, 1992; Meshishnek et al., 1992).
Finally, small debris impacts can damage spacecraft solar power systems. Effects of debris impact can range from localized damage to cover glasses and solar cells to failure of strings of cells. Impacts can perforate or break exposed spacecraft cabling (including power cables), causing short circuits or failures. In addition, even small debris impacts can create plasmas, which can couple into solar arrays, causing failures (Krueger, 1993). Because of the phenomena associated with perforation through thin (compared to the impacting particle's diameter) films, however, the newer thin-film solar cell technologies are less susceptible to large-scale damage from small impacts.
FINDINGS
Finding 1: The probability that a spacecraft will be struck by debris is dependent on the spacecraft's orbital altitude and, to a lesser extent, its orbital inclination. The orbital regions where impact with medium or large debris is most likely are those between about 750- and 1,000-km altitude and those around 1,500-km altitude. Spacecraft in semisynchronous orbits or GEO are, on average, probably about 100 times less likely to be struck by debris than most LEO spacecraft, and spacecraft not in any of the heavily used orbital regions (LEO, semi-synchronous orbit, or GEO) are even less likely to collide with debris.
Finding 2: Current models indicate that a collision in orbit will result in complete breakup if the ratio of the impactor's relative kinetic energy to the mass of the object with which it collides is greater than about 40 J/g. In LEO, debris as small as 0.1% of a space object's mass can cause the object to break up into many fragments. A typical LEO catastrophic collision involving a spacecraft may eject tens or hundreds of fragments large enough to cause a breakup if they collide with another spacecraft. At higher altitudes, where collision velocities are slower, a much larger impactor would be needed to cause catastrophic breakup.
Finding 3: Impacting space objects not large enough to break up a spacecraft can still cause significant damage through a variety of mechanisms,
including perforation, spallation, and impulsive loading. The effect of debris impact on a particular spacecraft is strongly dependent on the spacecraft's design; an impact that could cause a poorly protected spacecraft to fail might do no damage to a well-protected spacecraft. Some spacecraft components (such as tethers) may, however, be very difficult to protect effectively.
Finding 4: Small debris impacts can degrade spacecraft surfaces and components. This degradation might have no effect on a spacecraft's capabilities, might reduce its functional lifetime, or might even cause the failure of components, depending on the impacted component and the energy of the impact. Although the mechanisms for some failures are obvious (e.g. a fluid leak caused by a hole or the consequences of a wire being severed), other damage-causing mechanisms and the associated effects on component performance are not well understood.
REFERENCES
Allbrooks, M., and D. Atkinson. 1992. The Magnitude of Impact Damage on LDEF Materials. NCR-188258. Houston, Texas: National Aeronautics and Space Administration Johnson Space Center.
Bernhard, R.P., T.H. See, and F. Horz. 1993. Projectile compositions and modal frequencies on the "Chemistry of Micrometeoroids" LDEF experiment. Pp. 551–573 in NASA Conference Publication 3194, LDEF–69 Months in Space: Proceedings of the Second LDEF Post-Retrieval Symposium, A.S. Levine, ed. Hampton, Virginia: NASA Langley Research Center.
Chobotov, V.A. 1991. The Space Debris Problem and Preliminary LDEF Results. M&D Sig NASA Model. Paper presented to the fourth ISCOPS Conference, Kyoto, Japan, November 17–20.
Coombs, C.R., D.R. Atkinson, M.K. Allbrooks, A.J. Watts, C.J. Hennessy, and J.D. Wagner. 1992. Damage areas on selected LDEF aluminum surfaces. P. 595 in NASA Conference Publication 3194, Part 2, Proceedings of the Second LDEF Post-Retrieval Symposium, A.S. Levine, ed. Hampton, Virginia: NASA Langley Research Center.
Cour-Palais, B.G. 1991. Meteoroid and Debris Shield Analysis. NASA Contract No. NAS 9-18200. Task order no. C91KC-033-R2. St. Louis, Missouri: McDonnell Douglas Space Systems.
Goldstein, R.M., and L.W. Randolph. 1992. Rings of Earth. IEEE Transactions on Microwave Theory and Techniques 40(6):1077–1080 .
Grün, E., H.A. Zook, H. Fechtig, and R.H. Giese. 1985. Collisional balance of the meteoritic complex. Icarus 62:244–272 .
Humes, D.H. 1994. Small craters on the meteoroid and space debris impact experiment. NASA Conference Publication 10120, Third LDEF Post-Retrieval Symposium Abstracts. Hampton, Virginia: NASA Langley Research Center.
Johnson, N.L. 1985. History of consequences of on-orbit break-ups. Advances in Space Research: Space Debris, Asteroids, and Satellite Orbits 5(2):11–19 .
Kessler, D.J. 1969. Average relative velocity of sporadic meteoroids in interplanetary space. AIAA (American Institute of Aeronautics and Astronautics) Journal 7(12):2337–2338 .
Kessler, D.J. 1972. A Guide to Using Meteoroid-Environment Models for Experiment and Spacecraft Design Applications. NASA TN D-6596, March. Houston, Texas: NASA Johnson Space Center.
Kessler, D.J. 1981. Derivation of the collision probability between orbiting objects: The lifetime of Jupiter's outer moons. Icarus 48:39–48 .
Kessler, D.J. 1984. Tether Sever Rate from Meteoroids and Debris. NASA Memorandum SN3-84-217 August 21. Houston, Texas: National Aeronautics and Space Administration Johnson Space Center.
Kessler, D.J. 1993. Orbital debris environment. Pp. 251–262 in Proceedings of the First European Conference on Space Debris, Darmstadt, Germany, 5–7 April 1993. Darmstadt: European Space Operations Center.
Kessler, D.J., R.C. Reynolds, and P.D. Anz-Meador. 1989. Orbital Debris Environment for Spacecraft Designed to Operate in Low Earth Orbit. NASA TM 100-471. Houston, Texas: National Aeronautics and Space Administration Johnson Space Center.
Kessler, D.J., R.C. Reynolds, and P.D. Anz-Meador. 1994. Space Station Program Natural Environment Definition for Design, International Space Station Alpha. NASA SSP 30425, Revision. B. Houston: National Aeronautics and Space Administration Space Station Program Office.
Krueger, F.R. 1993. Hypervelocity impact physics—Plasma discharge phenomena on solar generators. The Behavior of Systems in the Space Environment, NATO ASI Series E: Applied Sciences 245:273–290 .
Love, S.G., and D.E. Brownlee. 1993. A direct measurement of the terrestrial mass accretion rate of cosmic dust. Science 262:550–553 .
McKnight, D.S. 1993. Collision and Breakup Models: Pedigree, Regimes, and Validation/Verification. Briefing presented to the National Research Council Committee on Space Debris Workshop, Irvine, California, November 18.
Meshishnek, M.J., S.R. Gyetvay, K.W. Paschen, and J.M. Coggi. 1992. Long Duration Exposure Facility (LDEF) Experiment M0003 Meteoroid and Debris Survey. P. 357 in NASA Conference Publication 3194, Proceedings of the Second LDEF Post-Retrieval Symposium, A.S. Levine, ed. Hampton, Virginia: NASA Langley Research Center.
NASA (National Aeronautics and Space Administration. 1970). Meteoroid Damage Assessment. NASA Space Vehicle Design Criteria. NASA SP-8042. Washington, D.C.: NASA.
Simon, C.G., J.D. Mulholland, J.P. Oliver, W.J. Cooke, and P.C. Kassel Jr. 1993. Long-term microparticle flux variability indicated by comparison of interplanetary dust experiment (IDE) timed impacts for LDEF's first year in orbit with impact data for the entire 5.77-year orbital lifetime. Pp. 693-703 in NASA Conference Publication 3194, Proceedings of the Second LDEF Post-Retrieval Symposium, A.S. Levine, ed. Hampton, Virginia: NASA Langley Research Center.
Stansbery, E.G., D.J. Kessler, T.E. Tracy, M.J. Matney, and J.F. Stanley. 1994. Haystack Radar Measurements of the Orbital Debris Environment. JSC-26655 May 20. Houston, Texas: National Aeronautics and Space Administration Johnson Space Center.
Thompson, T.W., R.M. Goldstein, D.B. Campbell, E.G. Stansbery, and A.E. Potter, Jr.1992. Radar detection of centimeter-sized orbital debris: Preliminary Arecibo observations at 12.5-cm wavelength. Geophysical Research Letters 19(3):257–259 .
U.S. Space Command. 1994. U.S. Space Command Satellite Catalog. Cheyenne Mountain Air Force Base, Colorado: U.S. Space Command.
Watts, A.J., D.R. Atkinson, L. Crowell, B. Tritz, and S. Rieco. 1994. Impact Effects on Optics Survivability: Induced Optical Scatter. PL-TR-94-1046. Kirtland Air Force Base, New Mexico: Phillips Laboratory (in publication).


