
5
DOD's PRIORITYSETTING
INTRODUCTION
The objective of the Department of Defense Priority Model (DPM) is to aid in the ranking of sites according to their relative threat to human health and the environment. According to DOD (1991b),
The DPM relies on site data gathered during the preliminary assessment/site inspection (PA/SI) and remedial investigation/feasibility study (RI/FS) phases described in the National Contingency Plan (40 CFR 300). The product of the DPM is a normalized score from 0 to 100 that is an indication of the relative risk posed by that site to human health and the environment. It is DOD's policy to accomplish site cleanups on a worst case basis, and the DPM has been used to establish this priority order.
The DPM is a mathematical algorithm or model used to compute a numerical score from 0 to 100 that represents the relative potential threat to human health and the environment posed by a contaminated site. Like EPA's Hazard Ranking System, the DPM is a structured-value model. Us-
ing quantitative data and qualitative estimates, the DPM calculates separate subscores for effects on human and ecological receptors via surface water and groundwater pathways and air and soil pathways for volatiles and dust. The subscores are then combined into an overall site score.
Part of the committee's task was to prepare an interim report evaluating the methods, assumptions, and constraints of the DPM. The results of the committee's analysis presented in that report (NRC, 1992) are reflected in this chapter. After completing its analysis, the committee learned that DOD had decided not to use the DPM to aid in ranking sites.
BACKGROUND AND HISTORY
The DPM is an outgrowth of the Hazard Assessment Rating Methodology (HARM) developed by the Air Force in the early 1980s. The HARM included surface water and groundwater pathways and considered contaminants present at a site and the potential for exposure of receptors to these contaminants. The HARM relied on the aggregation of subscores for the pathway-receptor combination by simple averaging. With the subsequent development of the EPA Hazard Ranking System (FIRS) (discussed in Chapter 4) to establish eligibility for the National Priorities List (NPL), the HARM was revised to improve the scoring for the surface water and groundwater pathways (e.g., by including floodwater transport, depth to groundwater, and infiltration potential); to improve the use of toxicity information to specifically address the relative potency of each significant contaminant; and to obtain better separation of scores by using a root-mean-square algorithm. The resulting modified model, named HARM II, was developed and first tested in 1986 (Barnthouse et al., 1986). In 1987, HARM II was adopted for DOD-wide use and was renamed the
Defense Priority Model. In response to comments regarding the DPM, it was further modified (Federal Register, 1989). The first computerized version of the DPM, known as the automated DPM, was developed in 1988 for use on personal computers running under the DOS operating system. This version was released as DPM Version 2.0 in June 1989. A revised version of the DPM was released in June 1991 and is known as the FY 92 version. A rationale document for the DPM was provided to the committee in October 1991 (DOD, 1991c). Throughout this chapter, references are made to the DPM User's Manual for the FY 92 version (DOD, 1991b).
THE DPM STRUCTURE
Overview
The DPM uses a combination of quantitative data and qualitative approximations intended to rank sites according to their potential threats to human health and the environment. Unlike EPA's HRS, which is used for initial screening, the DPM is used after a remedial investigation and feasibility study (RI/FS) has been conducted and the significance of the contamination at a site has been characterized in detail (see Figure 5-1). Contaminant mass, the number of chemicals and their mobility and toxicity, exposure-pathway assumptions, proximity of receptors, and allowable exposure criteria appear to be the important variables that determine the overall ranking of a site. These factors are combined to mimic risk assessment and yield an overall score. The overall scoring method of the DPM is based on a set of product algorithms that account for the exposure pathway, contaminant hazard, and receptors (human, animal, or plant), similar to the HRS (see Chapter 4):
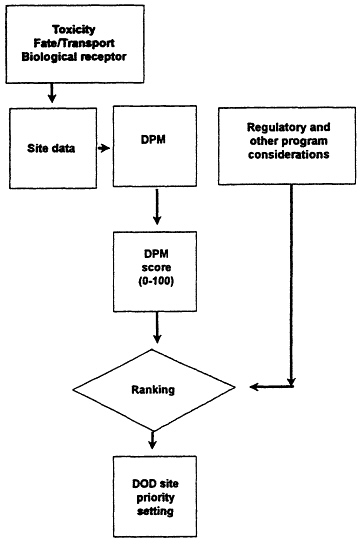
A schematic illustration of the DPM structure, which describes the above components of the DPM, is given in Figures 5-2a and 5-2b and Table 5-1. The final normalized DPM score represents the relative potential threat that a contaminated site poses to human health and the environment. The scores do not constitute the full process of setting priorities for remediation, but they are intended to be one important factor in priority setting (Figure 5-1). The scores can be used by DOD decision-makers with regulatory considerations, program efficiencies, additional risk information, and other factors to determine the relative priority of sites for remedial action (DOD, 1991b).
Data Requirements
The DPM input data requirements are summarized in Table 5-2; the preference is for site-specific data. The information available for DPM application includes data collected as part of the PA and SI and RI/FS activities. To incorporate a measure of uncertainty in the scoring during the quality assurance (QA) assessment, the DPM uses the concept of confidence factors. These confidence factors, which range from a value of 0 (uncertain) to 1 (certain), are multiplied by the maximum possible score for each factor (DOD, 1991b).
Model Documentation and Software
The main documentation describing the DPM is the DPM
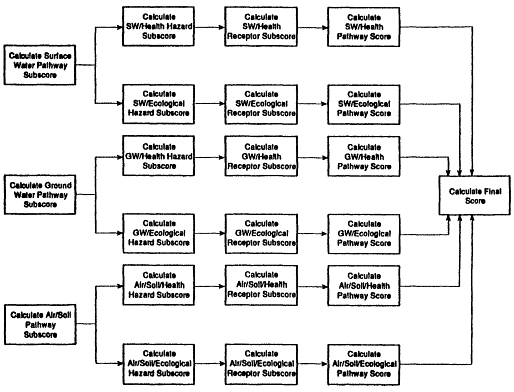
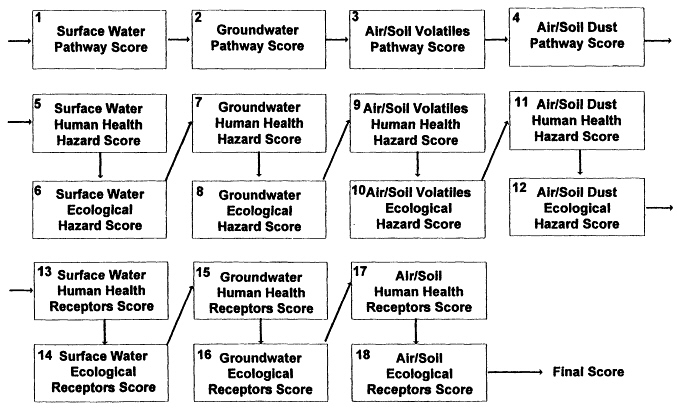
TABLE 5-1 Combining scores in the DPM
|
Surface water human health score |
= |
Surface water pathway score |
× |
Surface human health hazard score |
× |
Surface water human receptor score |
/10,000 |
|
Surface water ecological score |
= |
Surface water pathway score |
× |
Surface water ecological hazard score |
× |
Surface water ecological receptor score |
/10,000 |
|
Groundwater human health score |
= |
Groundwater pathway score |
× |
Groundwater human health hazard score |
× |
Groundwater human receptor score |
/10,000 |
|
Groundwater ecological score |
= |
Groundwater pathway score |
× |
Groundwater ecological hazard score |
× |
Groundwater ecological receptor score |
/10,000 |
|
Air/soil volatiles1 human health score |
= |
Air/soil volatiles pathway score |
× |
Air/soil volatiles human health hazard score |
× |
Air/soil volatiles human receptor score |
/10,000 |
|
Air/soil volatiles ecological score |
= |
Air/soil volatiles pathway score |
× |
Air/soil volatiles ecological hazard score |
× |
Air/soil volatiles ecological receptor score |
/10,000 |
|
Air/soil dust1 human health score |
= |
Air/soil dust pathway score |
× |
Air/soil dust human health hazard score |
× |
Air/soil dust human receptor score |
/10,000 |
|
Air/soil dust2eecological score |
= |
Air/soil dust pathway score |
× |
Air/soil dust ecological hazard score |
× |
Air/soil dust ecological receptor score |
/10,000 |
|
1 The higher of these two scores is used in the final Computation. 2 The higher of these two scores is used in the final computation. Source: DOD, 1991c. |
|||||||
TABLE 5-2. Summary of DPM Data Requirements
|
Data Category |
Specific Data Needs |
|
General Site |
Site location, name and number |
|
Information |
Distance to nearest installation boundary |
|
|
Distance to nearest residential, industrial, or commercial land use |
|
|
Type of waste site, size of waste site (area and depth), type of waste and concentration of contaminant in waste, physical form of waste, waste quantity, and waste containment information |
|
|
Mean summer temperature, soil porosity, average wind speed, soil bulk density |
|
Pollutant Field Data |
Have non-volatile (vapor pressure less than 10-3 mm Hg) or volatile pollutants detected or releases been observed in the ambient air? (For observed releases to air identify contaminants and measure or calculate maximum concentration levels; for non observed releases to air but observed releases in surface soil, identify contaminants and the maximum observed concentrations |
|
|
Have volatile or non-volatile pollutants been observed in the surface soil? (For observed releases of non-volatile pollutants determine (via measurements or appropriate models) the maximum concentration levels in air and surface soil for each contaminant. For non observed releases of non-volatile pollutants to air but observed releases in surface soil, identify contaminants and determine (via appropriate models) the maximum concentration levels in air and soil) |
|
|
Have pollutants been observed in ground water? (For observed releases identify contaminants and determine maximum observed concentrations) |
|
Data Category |
Specific Data Needs |
|
Pollutant Field Data |
Have pollutants been observed in surface water? (For observed surface water contamination, identify contaminants and determine (maximum observed) concentrations). |
|
Climate |
Net precipitation and representative rainfall intensity east and west of the Mississippi River |
|
|
Days per year with precipitation greater than 0.25 mm |
|
|
Flooding potential |
|
|
Annual average wind velocity |
|
Soil Data |
Soil porosity |
|
|
Soil permeability |
|
|
Erosion potential |
|
|
Neutralization capacity (based on soil chemistry) |
|
|
Organic content |
|
|
pH |
|
|
Average summer soil temperature |
|
Groundwater |
Depth (seasonal high) |
|
|
"Short circuit potential" (i.e., presence of faults, cracks, etc.) |
|
|
Distance (downgradient) from waste to supply wells, surface water, habitat or natural areas. |
|
|
Hydraulic conductivity of aquifer, effective porosity of soil, hydraulic gradient |
|
Surface Water |
Distance from waste site to nearest surface water |
|
|
Water use of the nearest surface water bodies |
|
Population and Ecological Information |
Sensitive ecosystems located within 4 miles downstream or 1.5 miles radius |
|
|
Presence of critical environments (e.g., habitat or endangered species, nature preserve, wilderness area, important natural resource, etc.) |
|
|
Population downstream that obtains drinking water from potentially affected surface water or groundwater |
|
|
Population within 1/2 mile of the site and population within a 4 mile radius |
|
|
Land use |
|
Source: Material from DOD, 1991b. |
|
User's Manual (DOD, 1991b) which provides instructions on how to run the DPM but does not explain the science or rationale for the various model algorithms. DPM documentation does not detail the whole modeling process (objectives, assumptions, intended use, environment, etc.), or its product. Thus, it is unclear why and how DPM's scores for potential threats are combined with the threat's magnitude, immediacy, and probability. The above information is necessary for evaluating whether a particular type of risk is being quantified consistently and checking whether the model's default values are chosen consistently with some explicitly stated policy.
The DPM software is well conceived, and it can be used with relative ease. The DPM has some internal checks to prevent the input of unrealistic data, such as entering negative numbers where only positive numbers apply, but it does not check for overall physical consistency of the data prior to execution.
PATHWAY SCORING
Overview
The pathway portion of the DPM rates the potential for waste-site contaminants to enter surface water, groundwater, and the air and soil. The pathway scoring methodology is based on various concepts of contaminant transport and fate. Contaminant transport and fate are modeled qualitatively in the DPM, with-the exception of the air and soil pathways. Thus, for the surface water and groundwater pathways, the algorithm does not consider the magnitude of the pollutant release rates or concentrations at the receptor site in arriving at the pathway scores.
Environmental Transport And Fate
The phrase "environmental transport and fate of chemicals" denotes the set of physicochemical and biological processes in nature that determine the exposure pathways, rates, and concentrations from contaminant source to receptor. Verified mathematical algorithms that link source and receptor are derived on the basis of multimedia chemical mobility and reaction phenomena in nature. Aspects of transport and fate are embedded in the DPM, specifically in the exposure pathway and contaminant-hazard factors.
A detailed review of the DPM revealed that the algorithms used for the surface water, groundwater, and air and soil pathway factors are not entirely consistent with accepted theory. The pathway algorithm uses a summation formula, whereas theory suggests that a multiplicative formula or summation on a logarithmic scale would be the preferable approach for scoring the pathway potential.
The DPM makes use of pathway algorithms that attempt to qualitatively capture the dependence of the contaminant concentration, at a given distance from the source, on various physicochemical and transport parameters. The DPM method for scoring the volatiles in the soil and air pathways is discussed below, followed by an alternative example illustrating that scoring algorithms can be developed along a defensible, theoretical approach. This example is then compared with the DPM approach.
The intention of the soil and air pathway analysis is to assess the potential of a pathway link via air from source to receptor. The three types of sources to consider are volatiles from soil surfaces, volatiles from surface impoundments (water surfaces), and dust from surface soils. The transport phenomena characteristics describing each are different. Any one taken alone should generate a potential score. All three together should have an equal or
higher score than any one pathway. If contaminants have been detected in air and volatile compounds found in surface soil or impoundments, the assigned normalized score is the maximum score of 10. If contaminants have not been detected, the scoring is assigned through pathway characteristics (see Figure 5-3). The factors listed in Table 5-3 are used in the soil and air volatiles pathway algorithm.
In the DPM, the following scoring algorithm is used:
in which the individual scores for each contaminant (designated with the superscript s) vary with the pathway factors as given below:
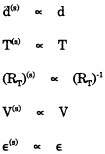
The main difficulty with the above approach is that the rationale for the coefficients in Equation 5.2 and the assigned maximum possible scores is unclear. Moreover, the algorithm does not seem to be based on a recognized physical description of contaminant volatilization.
Various alternatives can be based on a physical description of
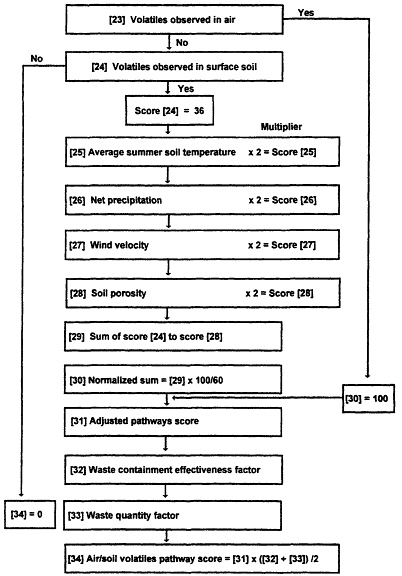
TABLE 5-3 Factors Used in the Soil and Air Volatiles Pathway Algorithm for the Defense Priority Model
|
Factor |
Maximum Possible Score |
|
Average soil temperature, T, ºC |
6 |
|
Net precipitation, RT, mm H2O |
6 |
|
Wind velocity, V, mile/hr |
6 |
|
Soil porosity, fraction of air space, ∈, unitless |
6 |
|
Degree of detected contamination in surface soil, d, unitless |
36 |
|
Waste containment effectiveness factor, Wc |
1 |
|
Waste quantity factor, Wq |
1 |
|
Source: Material from DOD. 1991b. |
|
transport phenomena. An illustration of a scoring algorithm that can be based on a simple treatment of transport phenomena follows. As a starting point, the development of a pathway potential model should focus on the probability of delivering a quantity of contaminated air (i.e., contaminant concentration) from all sources on the site. Concentration, C (g/cm3), is generated by a flux, F (g/cm2), from a source of area, A (cm2), with a wind velocity, V (cm/s), through a boundary-mixing height, H (cm), and site width, W (cm). From a simple mass balance, the chemical concentration in the air phase can be approximated as
(5.3)
Pathway characteristics in this algorithm that do not appear in the DPM User's Manual are the source surface area A, and its width, W. The flux, F, will be different for each source type. In the case of surface-soil volatiles, the flux can be estimated from
where K is the transport coefficient and Cs is the concentration of chemical in the surface soil. Substituting Equation 5.4 into Equation 5.3 yields the soil-volatiles algorithm,
The scores in each case are assigned so that they are directly proportional to the pathways factors. A summation algorithm could be devised by working in a logarithmic scale (such as taking the natural log of each side of the equation). Of course, the appropriate mathematical lower limit for the scores should be set to be consistent with the use of a logarithmic scale. Also, waste containment and quantity factors can be added as indicated in Equation 5.2.
Equation 5.5 represents a physically realistic approximation of the dependence of concentration on the pertinent variables. The characteristics of some of the variables in Equation 5.5 are functions of the mode of contaminant volatilization, as described below.
For volatilization from soils, the gas-phase mass-transfer coefficient K is proportional to the wind speed to the 0.8 power (Thibodeaux, 1979). With the wind velocity in the denominator (Equation 5.5), the net effect is C ~ V-0.2- a somewhat weak, but correct effect, in that dispersion at low wind speeds will result in a higher concentration of contaminants at the receptor site (provided that the wind is blowing toward the receptor). If winds are high, dilution occurs, and more of the chemical will migrate upward from the surface and less will migrate laterally to a downstream receptor. The DPM approach predicts a reverse dependence on wind speed.
The concentration of volatiles in air at the soil and atmosphere interface, Cs, can be obtained from a solution of the diffusion equation where the functional dependence of Cs on temperature can be assessed (Ryan and Cohen, 1989). In the limiting case, when the contaminant concentration is high (i.e., saturated phase), a conservative estimate of the void-space concentration can be obtained from knowledge of the saturation vapor pressure (DOD, 1991b, p. I-8). In this case, vapor pressure is an exponential function of temperature (Reid et al., 1977) where, for most volatile chemicals, the natural log of vapor pressure is inversely proportional to the absolute temperature. Thus, it might be more appropriate to construct an exponential scale of 1/T with the scores assigned at selected ranges. Alternatively, if a logarithmic scale for scoring Equation 5.5 is selected, then a scale inversely proportional to temperature can be set. The surface area of the source, A, the width of the source, W, and the mixing height, H, should be included as characteristic variables and scored accordingly.
In the case of volatiles from surface impoundments, the flux relationship is also given by Equation 5.4, where Cs represents the interfacial concentration. In this case, K is proportional to wind velocity; thus, C in Equation 5.3 is directly proportional to V. It should be noted that evaporation of contaminants from solutions is not directly proportional to the chemical vapor pressure. This is especially important for aqueous waste containing sparingly water soluble organics; Cs in the case of aqueous waste could be set to the interfacial, liquid-side concentration. This concentration is a function of the bulk chemical concentration in the aqueous phase, mass transfer coefficients for the liquid side and gas side, Henry's Law constant for the chemical, and the bulk air-phase concentration of the chemical. Finally, the characteristics A, H, and W are identical with those for volatiles from surface soils.
Although Equation 5.2 considers net precipitation as a factor, there is no justification for using net precipitation in the soil-vola-
tiles algorithm. Evidence, based on both theory and data, suggests that under some conditions the presence of moisture in soils can lead to an increase in volatilization of some contaminants from the soil. Moisture and porosity are such transient characteristics that obtaining a physically realistic score for their effect on volatilization, given the present state of the art, is highly doubtful. Although the incorporation of precipitation in the groundwater and surface water pathways is appropriate, it should not be incorporated into the soil-volatiles algorithm because it will negate, in part, the scoring for the groundwater pathway.
In summary, the above analysis demonstrates that use of a physical basis for the air-soil volatiles pathway can lead to a scoring algorithm that is very different from the one used in the DPM. This example emphasizes that, whenever possible, the algorithms for pathway scoring should be based on the functional equations for either contaminant flux or for the concentration of the contaminant in the exposure medium.
CONTAMINANT-HAZARD SCORING
Overview
The DPM methodology rates human health hazards and ecological hazards for specific chemicals on the basis of effects benchmarks. In media in which contamination has been detected, the hazard-scoring method is based on chemical intake by human receptors relative to an acceptable daily contaminant intake. For media in which a contaminant has not been detected, but whose presence in the site has been detected in other media, the contaminant-hazard score is based on toxicity factors and bioaccumulation factors. Of the three pathways-surface water, groundwater, and air and soil, the DPM calculates contaminant
concentrations with a model only for the air and soil pathway when contaminants have not been observed. For surface water and groundwater, it is assumed that if contamination has been detected in other media, hazard scoring can proceed without knowledge of the contaminant concentration in them.
The contaminant-hazard score is assigned based on the values of hazard quotients defined as (1) the daily intake or acceptable daily intake of the contaminant or (2) the ratio of measured concentration or ecological effects benchmark.
Reference Dose
The reference dose (RfD) of a toxicant is incorporated into the DPM for the ranking of chemicals by degree of chemical hazard. RfD is defined as the amount of a substance to which an individual can be exposed on a daily basis over an extended period (usually a lifetime) without appreciable risk of deleterious noncancer effects (DOD, 1991c). Although that is a common approach, the ranking would be considerably modified if the contribution of other sources of a particular chemical were taken into account in addition to the site-delivered dose. For example, about 70% of the RfD of cadmium is found in a normal human diet. For other toxicants, the dietary percentage contribution to the RfD is considerably less. The harm posed by chemicals from a site is more closely related to the RfD minus contribution from other sources, such as diet, than to the RfD alone.
Bioaccumulation Factors and Health Effects Benchmarks
The use of bioaccumulation factors (BFs) in the determination
of health-hazard quotients for observed releases in surface water and groundwater might produce profound distortions in the estimate of true health risk from chemical contamination of these media.
The list of BFs, which range from 10-1 to 104, is based on ratios of contaminant concentration in an organism to contaminant concentration in water. When empirical data are unavailable, a BF is derived from the chemical properties of the contaminant. The health-hazard quotient is derived from the combination of the BF and the oral health-effects benchmark (HB) and is supposed to indicate the severity of the health risk. The HB represents the toxicity of the contaminant.
BFs derived from measured fish and water concentrations vary widely for a given chemical because the steady-state concentration of a contaminant in a fish is almost never achieved as a result of exposure to the contaminant in water alone, but results from the combined effects of aqueous phase, food-chain, and sediment inputs to the fish. BFs for the same chemical vary widely, depending on different habitats. For example, bottom-dwelling fish, such as eels, accumulate more contaminants than non-bottom-dwelling fish, even though the exposure through water contaminants is the same for both species.
BFs derived from chemical properties, such as the ability to accumulate in fat as estimated by the octanol-water partition coefficient (Kow), must be used cautiously since the DPM procedure does not consider biological responses to contaminants that greatly affect uptake and site of storage. In general, essential nutrients such as manganese, zinc, copper, and selenium are actively taken up from trace amounts in the environment until physiologically appropriate concentrations are reached. Toxic nonessential chemicals, in contrast, might be unregulated and accumulate to an undetermined extent by dissolution in fat or as a substitute for essential elements, such as calcium. PCBs and chlorinated hydrocarbon pesticides accumulate in fat; lead and strontium accumulate
in bone, because of their chemical similarity to calcium. Excess exposure to nutrients is usually accompanied by increased metabolism and excretion, so concentrations are maintained within a relatively narrow range. Excretion of toxic substances can be nearly complete, as in the case of some volatile organic chemicals, or nearly absent, as in the case of lead and cadmium.
Toxic substances such as benzo[a]pyrene (BaP) and PCBs can have similar chemically predicated BFs (104 for both in the DPM User's Manual, Appendix B; DOD, 1991b), but BaP is metabolized and excreted to a much greater extent than PCBs. Biological mechanisms that result in specific storage sites in an animal create uncertainty about the interpretation of bioaccumulation with respect to human health effects and thus might lead to very poor correspondence between the predicted and actual relationship of bioaccumulation to human health. For example, cadmium accumulates in the liver and kidney but not in muscle tissue. Therefore, if only fish filets are consumed, there is much less risk from cadmium than from contaminants such as mercury, which accumulates in muscle.
Although there is considerable uncertainty in the derivation of some HBs, it does not approach the level of difficulty imposed by ignoring fundamental biological processes, as in the derivation of the BFs. The potential for misranking contaminants at wastes sites due to the use of ill-considered BFs is illustrated by a comparison of zinc (Zn) and cyanide. The calculation of a health-hazard quotient in Column 9 for the surface water hazard with observed releases (DPM User's Manual, Appendix A; DOD, 1991b) involves a division of the total human daily intake by the HB. The measure of toxicity (the HB) for Zn is 10 times that for cyanide. The higher the HB, the less the toxicity. Therefore, for Zn and cyanide, the HBs truly reflect the greater toxicity of cyanide. A problem arises with the consideration of the bioaccumulation potential. Zn has a BF 100,000 times greater than that of cyanide. The origin of the factors is not given in the DPM manual or other
supporting documents, but the large difference might be due to Zn being an essential nutrient and reaching much higher concentrations in tissue than in external water because of physiological requirements. Zn is not likely to concentrate in tissues beyond a physiologically appropriate point. Therefore, contaminated environments will not result in the predicted bioaccumulation of Zn if more than trace concentrations are present.
Consider a hypothetical contamination situation in which Zn at 5 ppm (5 mg/L, 5,000 μg/liter) is found in the surface water of Site A, cyanide at 5 ppm is found in the surface water of Site B, and the surface water at each site is a source of drinking water, as is assumed in the DPM. The cyanide contamination would be much more serious because it constitutes a lethal dose for children (Ellenhorn and Barceloux, 1988). The Zn would constitute about the normal daily dietary intake and therefore does not present a problem. However, because of their different BFs, the effect of the total human daily intake for Zn is greatly magnified by the DPM relative to that of cyanide. The result is that the health-hazard quotient is 32 for Zn and 7 for cyanide. Thus, the DPM treats the Zn contamination at Site A as about 5 times as threatening as the cyanide contamination at Site B, whereas the cyanide would be lethal and the Zn would represent no more adverse exposure than that in the normal daily diet.
A more mysterious aspect of the DPM approach is the inclusion of the "bioaccumulation fish factor" in the Groundwater Hazard Worksheet (Observed Releases). Fish are not found in groundwater per se and surface water is considered separately, so there is no reason to consider bioaccumulation in the groundwater pathway. The only human exposure would be through drinking water and other water uses.1
The committee finds that the inclusion of the BF in the calculation of the surface water and groundwater observed release health-hazard quotients could produce an index of hazard less accurate than the use of the HB alone. Except for certain pesticides, PCBs, mercury, a few radio-nuclides, and sometimes cadmium, bioaccumulation has seldom been a problem in environmental contamination episodes. The formulaic application of measured and derived BFs to hundreds of contaminants probably decreases the overall reliability of the ranking. It would be better to select the few substances that are known to present an increased health risk through bioaccumulation (e.g., those with log BF greater than 3 or log Kow>3.5) and have the presence of these substances trigger a more derailed procedure of the ranking system.
Ecotoxicological Concerns
The current ecological scoring process emphasizes aquatic receptors and is relatively unresponsive to broader environmental threats to vegetation and terrestrial ecosystems. For ecotoxicological concerns, the hazard scores for all but 45 chemicals are greater for human beings than for all other species. Of the 45, only 7 differ by more than 1 unit in favor of ecological receptors. Only 51 chemicals have scores over 1 for ecology, whereas approximately 68 chemicals score 1 or more for health. These figures suggest that there is a systematic bias in toxicity factors that practically ensures that even the most critical ecologically scored sites will not necessarily have a score meriting priority consideration.
Some chemicals are not included but should be in light of known properties and past uses. For example, the absence of 2,4,5-trichlorophenoxyacetic acid and its derivatives gives the im-
pression that these chemicals are not present in military installations. The wide range of triaryl and mixed aryl-alkyl phosphate esters (used as brake fluids, flame retardants, insulating agent in fabric on wiring, etc.) is covered by a single entry for "tricresyl phosphate." Only a few pesticides are listed, although all military installations had formal discretionary use authority through federal preemption of state and local regulations. Many items that were on the Air Force list of chemicals of concern in an Request for Proposal put out by AFOSR in 1989 do not appear in Appendix B of the DPM User's Manual (DOD, 1991b).
The treatment of terrestrial ecological effects in the DPM is deficient. The only water-quality resource is an outdated compilation in Water Quality Criteria, 1972 (NRC, 1973). For plants, the PHYTOTOX database (DOD, 1991b, p. H-12) is recommended for its high quality and currency; however, there is no indication that relatively sensitive avian species are considered. Instances in which terrestrial species (especially mammals) are more susceptible or more readily affected than their prey species might be ignored by assessors as for mink with PCBs (Foley et al., 1988). Mitigating factors in the consideration of ecotoxicological effects are the generally higher resistance of mammals than of other vertebrates and certain invertebrates to acute toxic insult, the general absence of better compilations of data, and the historical imperative that 98% of environmental research funded by the federal government has been devoted to aquatic issues. It is hard to hold the DPM developers wholly accountable for not considering the seven basic ecotoxicologic features (Neuhold and Ruggerio, 1976) in the massive screening and scoring exercise that DOD undertakes.
Within ecological risk assessment, a number of concerns can emerge and require attention. For example, loss of economic or highly visible species (such as rainbow trout and largemouth bass) is more likely to attract action than a shift in benthic communities from a diverse mixture of amphipods and gastropods to large numbers of a few species of tubificid worms, although that shift is now widely recognized as constituting important deterioration.
However, since health risk scores are weighted preferentially relative to ecological risks, any differences between health and ecological risks are practically irrelevant. Other detailed concerns raised by the committee regarding the treatment of ecological risks in the DPM are described in a separate report (NRC, 1992).
RECEPTOR SCORING
Human Receptor
The DPM contains an informed bias for a large population that is using a water source contaminated by a site dose to the installation boundary (DOD, 1991b, pp. 77-79). For example, the high scores for a population near the site could be reduced substantially if, on discovery of the contamination, an alternative water supply were provided. Selectively assigning a lower remediation score to a site in which a particular corrective action (interim remedial measures) has been taken raises a question of its fairness. Obviously, provision of an alternative water supply only accounts for the consideration of human health risk and ignores needs for environmental restoration.
The land use and zoning factor used in the DPM seems redundant with respect to the example above. This factor also neglects the higher probability of contact by agrarian populations. Indeed, the contribution of pollution by a local industrial or commercial complex might be higher than that of the site itself. About the only feature this factor adds is the transient population of workers and customers who might be exposed in the commercial and industrial category. However, as a zoning measure, the level of that activity is not evaluated. Without any data, the reversal of the agricultural category and the commercial and industrial category should be considered.
Ecological Receptors
Of the seven features of altered ecosystem function cited by Neuhold and Ruggerio (1976)-primary productivity, secondary productivity and growth, reproduction and development (including sex ratios and age and size class structure of the population), nutrient cycling, community diversity and structure, keystone species (a species that determines the character or nature of an ecosystem), and valuable species (including, but not limited to, endangered species and their habitats)-only the last-named feature is designated as a receptor, and then only to the extent that it is officially recognized or designated as such by other agencies.
That habitat once suitable for an endangered or threatened species has been degraded by toxic releases appears to be of no consequence to the scoring exercise. The restoration of the species, or even a reduced rate of degradation, is apparently not meritorious enough. Should a habitat be scored for its overall biotic potential for supporting threatened and endangered species?
The size of the potential critical environment is scored higher for extent than for the actually more critical "patchiness" of such environments. For some species with large territories (e.g., mink and bald eagle), extirpation has proceeded in spite of opportunity for immigration. For nonmobile species and many rare plants, adequate habitats might be scattered, yet very vulnerable to disturbance by released chemicals. As stated in the scoring box (DOD, 1991b, p. 80), an area of irrigated farm land larger than 100 acres would receive a higher score than an area of patchy natural wetlands and forest smaller than 100 acres, even though the latter might have greater biotic diversity (including species classified as lower than the highest category of endangered). Should the score take cognizance of this critical ecological parameter?
The aesthetic and recreational values of minimally managed areas are specifically excluded from scoring. For example, there
may be merit in including wilderness as a scorable attribute. One means might be, as suggested above, to develop an additional factor based on the inversion of the land use and/or zoning factor in the DPM.
Many military reservations create valuable habitat, particularly in buffer zones or other areas held in nonuse for long periods. That adds a complex feature to the scoring exercise. If the land were to be decontaminated and land use altered to civilian status, such as residential development, the ecological value of the area would be degraded, so assigning a high ecological score to the site (and consequently a high priority for remediation) might have the long-term result of ecological degradation. Until a transfer to civilian status occurs, protection of such habitat within the boundaries of the installation would be important because it is unlikely that such a habitat is specifically recognized or federally designated as critical. For example, Rocky Mountain Arsenal probably has some 40 acres of undisturbed tall grass prairie and large areas of land that have been out of cultivation for over 50 years. Clearly, the ecological score should express the ecological value or potential value of on-base lands.
Terrestrial habitats of threatened species or of species not otherwise designated as endangered score 0, an unusual score for an air and soil receptor. Because the air and soil pathways are generally applied only to plant species, it would not be anticipated that a critical coastal environment less than 1 mile away would score 13 but a critical freshwater environment the same distance away would score only 6. The above treatment is unusual given that there is no specific information in the literature implying that the sensitivity of a coastal environment is twice as great as a freshwater environment with respect to these pathways.
SOCIOECONOMIC ISSUES
Socioeconomic Impacts of Site Remediation
The DPM model is deficient in its treatment of the important social and economic dimensions of receptor impacts. It is not dear whether DOD addresses these limitations through considerations external to DPM. The major shortcomings are
-
the arbitrariness of the choice of categories for population densities, distances from sites, and land-use characteristics of the pathways;
-
the lack of justification for attaching greater weight, and hence greater importance, to human impacts than ecological ones by a factor equal to the square root of 5; and
-
the absence of attention to economic and social impacts of contaminated sites and to the cost-effectiveness of risk reduction.
The population and distance parameters built into the DPM tend to underweight very sparsely and very densely settled areas. Too much weight is given to moderate density sites. By using arbitrary classifications of land use (completely remote, agricultural, commercial-industrial, and residential), the DPM model ignores a key potential decision-making variable: the value of land and existing structures if a site were remediated. In other words, important opportunity costs are not considered.
The scheme of human and ecological weighting, if used too rigidly, influences the final ranking in favor of funding cleanup of human settlements. For example, impact on the population of a logging village would be scored higher than impact on the forest, although a population might depend on the forest for jobs. The weighting might also fail at the other extreme: the importance of
protecting population could be underweighted by use of a ratio of only the square root of 5 to 1 in the case of a very large city.
Unless the current and potential value of property is estimated, it will not be possible to choose the most cost-effective method of cleanup. An example is choosing to cleanup a site because it is inexpensive to remediate, rather than cleaning up one whose remediation would be more expensive but have great economic value to the community.
Socioeconomic Information in the DPM
The DPM process requires scoring for the number of people living and working within 1,500 feet, 2 miles, and 4 miles from the site and the installation and scoring for land use and zoning within 2 miles. The DPM rationale does not explain or justify why 1,500 feet is relevant to contaminated waters, 2 miles is relevant to other water exposures, and 4 miles is relevant to air pollution. If the population data were to be used for air emissions, one would have expected the data could be disaggregated into four to 16 cardinal compass zones and the potential exposure to the population estimated with a wind rose.
The DPM FY 90 Scoring Quality Assurance Program Report (DOD, 1990a) indicates that most of the population data were "estimated using personal knowledge of the scorer." Although the report noted that it applied to a model earlier than Version 3.0 (DOD, 1990b), it added that the scorers had to estimate the location of the population and that data sources were documented in only 12% of cases. In addition, as stated in the DPM Manual (DOD, 1991b), "several of the scorers entered smaller populations for larger areas." In the DPM, the land-use and zoning data are divided into four categories: completely remote, agricultural, commercial and industrial, and residential. The thinking behind the weights attached to the four categories is not explained. Nor is
there an explanation of the dichotomy between distance to commercial-industrial land and distance to national or state parks, forests, wildlife reserves, and residential areas.
DOD sites (more so than civilian sites) tend to be on large tracts of land wholly controlled by military installations. Yet, it may be a mistake to assume that social and economic impacts are irrelevant for employees and residents on those installations.
SCORING METHODOLOGY AND AGGREGATION
Overview
The mathematical operations of the DPM are straightforward; they involve substituting values into formulas and, in some cases following logical branching. Although the mathematics is clear, the choices of particular operations for combining quantities appear to be somewhat arbitrary. For example, some scores are combined by a root-mean-square operation, and the result is an implied square-root-of-5 weighting of human-health subscores versus ecological subscores (DOD, 1991b). Also, the transformation of quantities via multipliers from continuous values to ordinal values or from descriptive phrases to numerical values appears to be arbitrary and without explanation (DOD, 1991b). The aggregation of several risk elements or other criteria into a single priority-setting index involves subjective values, as well as scientific judgments. But there are systematic and tested techniques for aggregating scores like this (NRC, 1992).
Final Aggregation
In the DPM, a final site score is obtained by aggregation of the
eight subscores for pathway-receptor combinations (DOD, 1991b). The given aggregation formula uses a root-mean-square combination of the subscores as is also done in EPA's Hazard Ranking System (see Chapter 4). Apparently that choice was made because, compared with the arithmetic mean, it permits "individually higher subscores to have a greater effect on the overall score." The rationale for the above approach is unclear. For example, it would be even more true for roots of higher powers, such as the root-mean-cube. The reasons why root-mean-square is common in statistical and engineering calculations seem irrelevant here; perhaps a larger exponent would yield a spread of site scores more helpful for allocating resources.
The given aggregate formula implicitly treats the scores to be combined as independent. The assumption is that there are neither significant interactions (e.g., a health insult through one pathway exacerbating the health impact of some intake via another pathway) nor significant double counting. In the present version of the DPM, volatiles and dust are treated separately for air and soil transport. But for human and ecological receptors, only the larger of the two resulting scores is entered into the aggregation, the other being dropped entirely (DOD, 1991b). This exemplifies the failure of the DPM approach to aggregate the effect of two contaminant release sources that could lead to a higher potential threat than the individual sources alone.
Clear justification for various multipliers in scoring algorithms is not provided. Thus, it appears that the individual pathway scores and their aggregation cannot be analyzed along a systematic theoretical basis that might enable one to check the rationale in the scoring methodology and to propose revisions. Of particular concern is the transformation of continuous or cardinal datum (e.g., distance to nearest surface water) to an ordinal score (e.g., 0, 1, 2, 3) for which the rationales for the threshold levels used in the cardinal-to-ordinal transformation are not given. As noted in Chapters 3 and 4, the lack of a rigorous, testable basis for deter-
mining such factor scores is a problem common to structured-value models such as the HRS and DPM.
VALIDATION
Model validation encompasses the soundness and accuracy of the model as a means of establishing priorities for remedial action, as well as the mathematical and numerical aspects of the model computer code. The DPM has not been validated, even though validation is recognized as critical in the development and application of models for use in policy and regulatory decisions (Naylor and Finger, 1967; Chapra and Reckhow, 1983; Reckhow et al., 1990; Arula, 1987; Shaeffer, 1980; ASTM, 1984; EPA, 1989b; NRC, 1990b). A broad validation can be performed fully only in the context of the intended model use; that is, does the model give good advice in establishing priorities for remedial action? The direct output of the model, the DPM score, is intended to provide a measure of relative site risk or threat, which is intended to be used in the setting of priorities for resource allocation. Validation efforts need to address not only the relative measure of risk provided by the output scores, but also the quality of the rankings that result. Possibilities for the latter might involve classifying the sites simply into groups (e.g., high, medium, or low priority for remediation) as a result of the scoring or making a finer detailed ranking of the site scores.
An appropriate validation study-comparing model results with what they should be-would involve perhaps 10 to 30 sites and the comparison of scores and rankings from the DPM with those from another approach, assumed a priori more likely to yield the right answer. Ideally, the sites used would be authentic ones, perhaps including some already selected for rapid cleanup outside the DPM framework, but they could also include hypothetically de-
signed sites. The purported right answers could be based on the results of independent risk analyses performed according to well-established procedures or on the judgment of experts who can give those sites intense consideration. Similar comparisons have been made for the EPA Hazard Ranking System models (Dory and Travis, 1990). For authentic sites that have advanced to later stages of investigation, the right answers could be based on experience involving the manifestation of a hazard or the benefits realized through remediation. A record of the validation study's procedures and results should become part of the DPM's documentation.
SENSITIVITY AND UNCERTAINTY ANALYSES
An important step in evaluating the performance and reliability of priority-setting models is to determine through sensitivity and uncertainty analyses the magnitude of uncertainties in the model site scores and the implications of the uncertainties for site ranking.
Detailed sensitivity and uncertainty analyses are yet to be performed on the direct model output (the DPM score) and on the resulting site rankings or priorities. The latter can be examined by determining how uncertainties in DPM scores affect an overall ranking and inclusion on the short list of sites identified for highest-priority consideration. Uncertainties in model output can be derived from assumed uncertainties in model inputs (or structure) or evaluated directly by analyzing how site scores vary among different analysts.
To illustrate the potential impacts of uncertainties in the DPM model results on ranking, a preliminary analysis was recently conducted (NRC, 1992) based on the available set of FY 1991 DPM
scores (M. Read, DOD, pers. comm., July 1991). In this analysis, the uncertainty in the composition of the list of FY 1991 sites that had the 50 highest scores was evaluated. The changes in scores that resulted from the FY 1991 DOD quality-assurance (QA) review were used to scale the uncertainty in site scores.
The uncertainty assumed for the scores was based on the magnitude of the changes that occurred for the 50 sites for FY 1991 that underwent the QA correction. This uncertainty was superimposed on the full set of 284 sites scored in the DPM by DOD in FY 1991. The DPM scores for FY 1991 ranged from 1 to 64, with the distribution shown in Figure 5-4. Because all the scores that will ultimately be used for DOD priority setting will already have undergone QA, an additional analysis was performed on the assumption that the uncertainty in site scores is only one-fourth
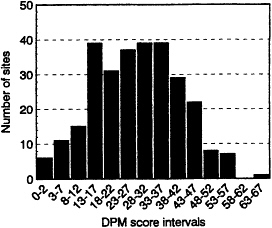
FIGURE 5-4. Grouped frequency distribution of DPM scores for 284 sites in Fiscal Year 1991. Of 284 sites scored, 15 have DPM scores in an interval from 8 to 12. Highest-ranked site is Rocky Mountain Arsenal, which has a score of 64. Two sites, Riverbank Army Ammunition Plant E/P Ponds and Richards Gebaur Hazardous Waste Drum Storage Site 923, have a low DPM score of 1.
that reflected in the QA corrections. Although this change in assumption did significantly reduce the variation in rankings, in both cases the composition of the group of sites with the highest rankings proved subject to considerable variation.
To implement the analysis, fifty simulations were performed by adding random-error values with the properly scaled variance to the FY 1991 DPM scores. The modified scores and overall ratings were determined for the 284 sites. The results of the analysis are summarized in Figure 5-5, which presents the uncertainty in the composition of the top-50 list for the two cases. It shows the probability, or fraction, of simulations in which each of the 284 FY 1991 sites is included among the top-50 ranked sites. As shown in Figure 5-5a, the variation in the full-QA-uncertainty case is quite large. Sites with baseline scores as low as 12 have a nonzero chance of being included among the top-50 sites (corresponding to a least one simulation in which the site was among the top-50 scores). Fully 219 of the 284 sites were included among the top 50 sites in at least one simulation. Furthermore, the top baseline site with a score of 64 was included among the top-50 sites only 84% of the time (corresponding to 42 of the 50 simulations). If the magnitude of site-score uncertainty is in fact comparable with that reflected in the FY 1991 QA modifications, then decisions based on the DPM ranking (e.g., to begin remediation with the top 50 sites) are subject to considerable uncertainty.
The variation in the top-50 list for the one-fourth-QA-uncertainty case is shown in Figure 5-5b. The impact of site-score uncertainty is shown to be greatly reduced. Sites with baseline scores above 50 are virtually assured of being on the list, whereas sites with baseline scores below 30 are virtually assured of being left off the list. The number of sites included in the top-50 list at least once is reduced to 107, compared with 219 in the full-QA-variability case. Site rankings and remediation decisions are thus more robust with this lower level of site-score uncertainty.
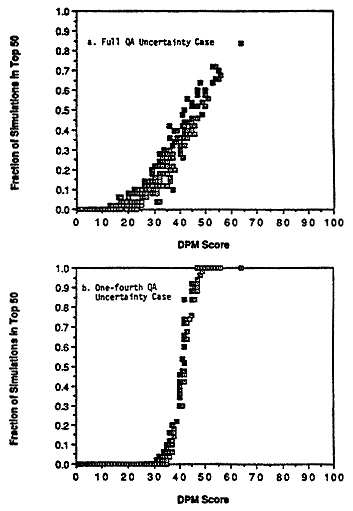
The analysis presented in Figure 5-5 can be extended to focus attention on sites that warrant additional study and effort. For example, in the case of one-fourth QA uncertainty, sites with scores above 50 are so likely to belong to the top-50 list, and sites with scores below 30 so unlikely to belong, that they require little additional study to reduce the uncertainty in their scores. The composition of the top-50 list is sensitive only to uncertainties in sites with scores of 30 to 50. It is those transition sites that should be targeted for further study to reduce their site-score uncertainty. The uncertainty analysis thus provides a mechanism for focusing further data collection and study efforts.
This analysis illustrates the kinds of sensitivity and uncertainty evaluation that could be performed. The uncertainty in site scores is shown to have a considerable impact on the composition of the top-50 list, although this impact is sensitive to the magnitude of the assumed site-score uncertainty. The analysis demonstrates that the uncertainty in DPM scores could potentially limit the use of the model for setting priorities among sites for remediation. It is essential that uncertainty evaluation of this type be performed for priority-setting models in the context of their intended use.
SUMMARY
The DPM is structured as a user-friendly model, and QA/QC approaches are used in its application. The DPM approach of using the product of pathway potential, hazard, and receptor is one reasonable approach to defining an overall site score. A detailed review of the DPM, however, reveals that the some of the transport and fate algorithms, toxicologic and exposure assumptions, and methods embedded in the DPM have weak theoretical foundations. For example, the fate algorithms used for the surface water, groundwater, and air and soil characteristics do not have an acceptable theoretical basis.
The pathway algorithms in the DPM use a summation formula to reflect the combined effect of the various pathway parameters, whereas theory suggests that a product of characteristics or a sum on a logrithmic scale would be the preferred approach to score the pathway potential.
The DPM does not appear to explicitly address social and economic impacts on site characterization, and it is not clear whether DOD addresses these issues through an evaluation process external to the DPM.
The DPM scoring scale is linear, and results of DPM site scores reveal that the score intervals for the FY 1990 and FT 1991 sites are small. Thus, based on the above results, it appears that the DPM may have a limited capability to discriminate between sites (NRC, 1992). Score compactness on the 0-100 score interval and factors in the pathway summation algorithms that mitigate against discrimination on pathway potential suggest that model algorithms should be restructured to produce a logarithmic scoring scale. Spreading out the numerical scores with alternate algorithms to combine scores, such as product algorithms (see NRC, 1992), might allow better discrimination between site scores. A simple sensitivity analysis for 50 highest DPM scoring sites (NRC, 1992) demonstrated that uncertainties can have large effects on the composition of the top-50 list.
To provide a summary evaluation of the tools used in DOD's priority-setting process, the criteria identified in Chapter 2 for effective model development and application and for the specific technical desired features are examined with primary focus on the DPM model. Given that the DPM was undergoing development when the committee performed its analysis, the comments given below should be viewed as committee recommendations of needs for such future efforts, rather than as evaluative of a completed product.
General Issues in DPM Model Development and Application
Defined Purpose: The DPM has a well-defined purpose within DOD's overall priority setting process. It is responsive to the stated DOD policy of giving site-cleanup priority to sites which present the greatest potential threat to human health and the environment.
Credibility and Acceptability: The extensive scientific peer review, public participation, and public comments that are needed for establishing credibility and acceptability of a model to be used in priority-setting have not yet been conducted with the DPM.
Appropriate Logic and Implementation of Mathematics: The calculation methods used in DPM are fairly straightforward. However, the logic of the choices made for particular operations and for combining quantities appears somewhat arbitrary. The basis for combining and weighting is not clear from the information which was provided to the committee.
Model Documentation: The documentation for the model was limited at the time the committee performed its analysis. That which was available to the committee does not adequately explain why the model is designed as it is. More extensive documentation is needed to describe the whole modeling process, as well as its product. For example, many of DPM's features, instead of being self-evidently correct, appear to be choices among many possible options. Such choices call for explanation and support. Documentation is also needed for evaluation of whether some particular kind of risk is being quantified consistently and whether the model's default values were chosen to be consistent with some explicitly stated policy.
Model Validation: The DPM has not yet been validated. Complex models such as this need to be checked carefully to determine whether in fact they perform sufficiently well for their intended
purpose. The question is whether or not the DPM gives good advice in establishing priorities for remedial action. This has not yet been adequately determined.
Model Sensitivity and Uncertainty Analysis: There are many uncertainties in the data collected from a site for use in priority setting models. The effect of such uncertainties in model outcome and the priorities that sites receive should be known. An adequate sensitivity and uncertainty analysis for the DPM model is needed.
Specific DPM Technical Features
Applicability to All Waste Sites: The DPM is broadly applicable to essentially all DOD sites for which the model might be used.
Allowance for Dynamic Tracking: The DPM has not been developed as a tool for dynamic tracking.
Discrimination between Immediate and Long-Term Risk: The purpose of the model is to address primarily the longer-term risks. Immediate risks will be addressed as a first priority of the DOD and will not be subjected to priority-setting through the DPM.
Inclusion of Cost Estimates of Remediation: The DPM does not consider cost issues or timing with respect to remediation.
Transparency: The DPM is a highly transparent model. The mathematical formulation used are well described, and the procedures used for weighing of health and environmental risks are readily apparent. Model transparency and simplicity in use are major advantages of this model.
User-Friendliness: The DPM scoring procedures are straightforward and are described in an easy-to-follow procedure.
Appropriate Security: It is not clear at the moment how security issues will be addressed.
DOD Priority-Setting Process
Unlike the EPA's HRS, the DPM is used later in the priority-setting process after a more detailed site characterization, representative of a remedial investigation and feasibility study (RI/FS), has been completed. The DPM is not intended for use in ranking of all contaminated sites at DOD facilities. Apparently, sites posing imminent threats from hazardous or toxic substances will receive top priority for cleanup, and will not become part of the DPM evaluation. In addition, DOD plans to place higher priority on cleanup of sites on DOD installations that are subject to closure. Up until recently, site cleanup has not been restricted by a lack of funds. However, with increasing number of sites with detailed characterization completed, competition for funds is expected to become evident soon. The DPM does not explicitly evaluate the social and economic effects often associated with hazardous waste sites. It is intended only to provide a relative ranking of sites based upon their relative threat to human health and the environment. The ranking provided by DPM is to be used "along with additional risk information and other factors such as regulatory requirements and program efficiencies" to establish cleanup priorities among the DOD sites. The process by which other factors will be considered in setting priorities is not known to the committee, thus the committee is unable to comment on how well the overall priority-setting process will address the several features and technical issues noted above.


