
6
DOE's PRIORITYSETTING
For over 45 years, the U.S. Department of Energy (DOE) and its predecessor agencies have operated a large number of laboratories, chemical processing and metal manufacturing plants, nuclear reactors, and testing grounds for the primary purpose of producing nuclear materials and weapons for national defense. As a result of these operations, DOE facilities are now faced with contamination problems associated with radioactive and hazardous chemical wastes and mixtures of those wastes. These environmental problems, which exist at nearly 100 facilities and sites in some 30 states and territories, must be evaluated in order to determine the appropriate remedial responses.
To help manage the environmental cleanup and waste management activities, DOE has proposed an Environmental Restoration Priority System (ERPS) to "explain, document, and defend its budget request in discussions with OMB," and "to allocate [appropriated funds] among field offices, programs, and installations." (DOE, 1991a). After completing its analysis, the committee learned that
DOE had decided not to use ERPS for the foreseeable future. Although it is not currently in use, ERPS provided the committee with the opportunity to assess a model designed to explicitly address social, economic, political impacts, and cost consideration in addition to health risk impacts.
In this chapter, the background and history of ERPS is discussed, and the logic of the model is described. Special attention is paid to its technical underpinnings, as well as to issues that must be addressed to ensure its successful implementation. Before making this presentation, the committee notes that the description, analysis, and critique of the ERPS model is not as thorough as for the DOD and EPA counterparts in Chapters 4 and 5. There are three reasons for this difference. First, the committee was asked by DOD to conduct a detailed evaluation of DOD's DPM. It was not asked to perform a detailed evaluation of ERPS. Hence, in carrying out the study, the committee obtained much more documentation for the DPM than ERPS. For example, the committee had a computerized version of DPM and had an opportunity to run the model. A similar opportunity was not available for ERPS.
Second, ERPS is less than 5 years old. DOE was the last of the three federal agencies to develop a formal model to assist in priority setting. Consequently, there was much less published material available about ERPS upon which to base our analysis and critique than, for instance, on EPA's HRS. The committee was able to understand EPA's logic and to study in detail the data and equations used. A similar opportunity was not available for ERPS.
Third, ERPS is more comprehensive than DPM and HRS by explicitly including social, economic, and political impacts; cost considerations; and uncertainty in the model. However, the data base supporting these and other components of this complex model appear to be limited, and a considerable number of subjective judgments have to be made to run the model. The model has
numerous scales (e.g., 1 to 4, 1 to 5, 1 to 7) and other calculations requiring squaring and taking square roots that are untested against actual cases. Some of the values and equations make sense, but they are at best educated guesses. To its credit, DOE has made these judgments explicit to decision-makers by building them into the model. In other words, ERPS allows more of the decision-making process to be built into the model rather than relying on an external process that is not open to scrutiny.
Because of these three factors, this chapter is more descriptive and less analytical than the chapters on the DPM and HRS. Although the committee presented criteria to evaluate DPM, HRS, and ERPS in Chapter 2, it feels that it had insufficient information with which to make a credible evaluation of ERPS. Information on health risk can be provided to ERPS through various alternatives. One of them is DOE's Multimedia Environmental Pollutant Assessment System (MEPAS). This chapter and Chapter 8 provide some evaluative information on MEPAS.
BACKGROUND AND HISTORY
Until the mid-1980s, DOE and its predecessor agencies took the position that DOE was essentially self-regulating with respect to environmental issues under the Atomic Energy Act. This interpretation was overthrown by a lawsuit. DOE now recognizes that its environmental restoration program is governed primarily by three major environmental statutes: (1) the Comprehensive Environmental Response, Compensation, and Liability Act (CERCLA), as amended, (2) the Resource Conservation and Recovery Act (RCRA), as amended, and (3) the National Environmental Policy Act (NEPA). In order to centralize and coordinate the efforts required by these statutes, DOE created the Office of Environmental Restoration and Waste Management (EM) in
1989, whose basic goal is to bring both active and inactive DOE facilities into compliance with applicable local, state, and federal laws and regulations. EM now oversees all DOE waste management and cleanup activities, including
-
Waste management operations: minimizing, treating, storing, and disposing of wastes generated by activities at active facilities. This can be characterized as the RCRA component of DOE activities.
-
Environmental restoration: assessing, cleaning up, and dosing inactive sites and surplus facilities. This can be characterized as the Superfund component of DOE activities.
-
Technology development: managing and implementing research and development related to DOE waste disposal operations and cleanup.
The DOE priority-setting system discussed in this chapter was developed initially for use with the environmental restoration program only. Another system for DOE's waste management operations, known as the Resource Allocation Support System has gone through the early stages of development. However, DOE completely suspended work on this system in 1992 and the committee did not review this approach at all.
In 1989, EM published its first five-year plan for cleaning up DOE's nuclear-related waste sites and for bringing its operating facilities into compliance with current environmental laws and regulations with the intention to revise this plan every year. The 1989 plan included the following four priority categories that were applied to environmental restoration and waste operations.
Priority 1. Activities necessary to prevent near-term adverse impacts to workers, the public, or the environment.
Priority 2. Activities required to meet the terms of agreements (in place or in negotiation) between DOE and local, state, and
federal agencies. These agreements represent legal commitments to complete activities on the schedule agreed to by DOE. (See Chapter 1.)
Priority 3. Activities required for compliance with external regulations that were not included in Priority 1 or Priority 2.
Priority 4. Activities that are not required by regulation but would be desirable (DOE, 1990).
A categorization system based on these four priorities was recognized as an interim approach to establishing priorities for future environmental restoration activities.
In the June 1990 executive summary of the EM Five-Year Plan for Fiscal Years 1992-1996, DOE reported that in consultation with interested parties, it was developing a risk-based priority-setting system for its environmental restoration program. The goals, in part, were "to support DOE budget formulation and allocation; measure the relative priority of program elements against a comprehensive set of program objectives, and explicitly identify the tradeoff among objectives," among others (DOE, 1990). According to the report, the approach was intended to be "a formal analytical decision-aiding tool addressing health and safety risks as well as social, technical, economic, and policy issues" (DOE, 1990).
Work on ERPS by DOE did not begin until 1989. From the start, efforts were made to solicit the views of interested and affected parties, both public and private. Involved parties are the State and Tribal Governmental Working Group (STGWG) and the Priority System External Review Group (PSERG), as well as technical groups. The members of STGWG include representatives of states and tribes that have negotiated Environmental Compliance Agreements and Orders with DOE that contain explicit near- and long-term milestones and schedules for cleanup and other environmental activities. Along with representatives from states and tribes, PSERG also has representatives from
national environmental groups and EPA. In addition, broader public reaction was sought by seeking comments through a Federal Register notice on September 6, 1991, and by holding other such as a national workshop.
The initial publication on priority-setting system development (DOE, 1990) was followed by a more complete description (DOE, 1991a). Through a Federal Register announcement on September 6, 1991, DOE publicly sought comments on the priority-setting system (Federal Register, 1991). Fourteen organizations and individuals submitted comments. DOE published these comments and its detailed responses to them in a document entitled "Priority System Comment-Response Document." DOE also published a summary of the issues raised and DOE's response to them in the Federal Register (1992b).
In addition to these open review opportunities, DOE asked that a special ad hoc peer review committee evaluate the April 1991 report. This Technical Review Group (TRG), often called the Parker Committee after its Chairman, Dr. Frank Parker, published a report presenting the results of their deliberations (Technical Review Group of the Department of Energy, 1991). The TRG concluded that a formal prioritization system is preferable to an informal system. This methodology represents the state of the art. However, it has major limitations in what it can accomplish even with perfect input. Even with its current limitations, the system can play an important role in ordering priorities, but it is inappropriate for determining the budget for environmental restoration."
THE ENVIRONMENTAL RESTORATION PRIORITY SYSTEM
One of the objectives that is used for setting priorities in ERPS
is the reduction of health risks. In order to measure the achievement of this objective, the priority-setting system recommends that formal risk assessments of specific sites be used. If a formal risk assessment has not been conducted, then the use of Risk Information Systems (RIS), output is suggested as an alternative for estimating population and individual risk estimates and for estimating risk urgency and timing. RIS outputs are summary risk indicators generated using a computer model known as Multimedia Environmental Pollutant Assessment System (MEPAS).
Since health risks play an important role in the determination of the priorities generated by the ERPS, the use of the MEPAS model deserves further comment. The MEPAS model was originally developed in 1988-89, and is based on a method known as the Remedial Action Priority System (see Michel (1992) and references therein for more background).
The MEPAS computer model was developed to specifically focus only on potential adverse health impacts, not on ecological or other types of impacts. Although MEPAS is not widely known outside the DOE community, it uses many elements that are better known than the model itself. It incudes elements that deal with radioactive wastes, hazardous chemical wastes, and mixtures of both types of waste. MEPAS uses mathematical formulas to predict the transport of chemical and radioactive contaminants to and through air, soil, surface water, and groundwater to where humans can be directly or indirectly exposed. Final exposure paths include direct exposure (through inhalation, skin exposure, drinking of water, etc.) as well as indirect exposure (eating of crops or fish, bathing, swimming, etc.) The MEPAS model can be run on a relatively simple computer system. In addition to estimating pollutant exposure amounts, which can be difficult or expensive to obtain, MEPAS, like HRS and DPM, needs other standard and often easily available data, such as rainfall, population density, soil type, and river flow.
The end result of MEPAS is a pair of risk estimates. The first risk estimate provides a maximum individual risk that can be predicted for the conditions specified for carcinogens (radio-nuclides as well as carcinogenic chemicals) and noncarcinogens. This first risk estimate is prepared from estimates of exposures caused by inhaling air; drinking water or milk; eating fish, vegetables, meat or soil; and recreational activities in contaminated surface water.
The second risk estimate is an indicator of risks to population groups: the Hazard Potential Index (HPI). It reflects the first risk estimates for individuals, weighted by the total number of people exposed. In general, it is standard practice to develop both individual and population risks to allow a more complete understanding of any given situation and to permit better-informed decisions.
Role of ERPS
The ERPS represents an application of multiattribute utility theory to the problem of ranking a set of alternatives for site remediation. Details of this system are reviewed by briefly discussing its role in the overall process of determining priorities and funding levels for environmental restoration activities. The basic structure of the model is then explained and evaluated, and the details of its implementation are discussed.
According to DOE, ERPS was intended to be used in support of its 5-year plan on an annual basis. The 5-year plan is DOE's basic management planning and budgeting document for EM activities. Updated annually, this plan describes all of the EM activities that DOE is conducting or is planning to conduct for the next few years.
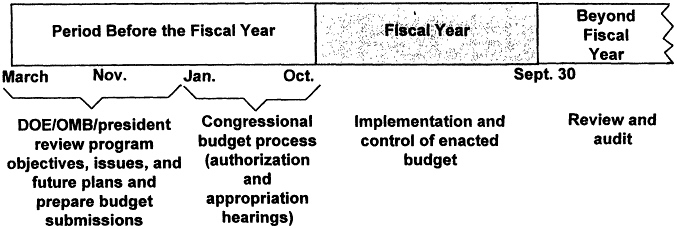
ERPS would in principal be useful in supporting three aspects
of the 5-year plan. In FY 93, for example, the system could be used to assist in allocating the actual funds appropriated by Congress for environmental restoration activities, in the event that Congress does not appropriate all the funds needed to carry out the activities previously planned for the current year. For FY 94, the system could be used to help explain and defend the proposed budget and activities before Congress during its deliberations. Finally, for FY 95, the system could be used to help consolidate the requests for funding environmental restoration activities at DOE facilities.
This use of the ERPS is illustrated in Figure 6-1 for the DOE 1995 budget-planning process. This process would begin in 1992 when the FT 95 requests for funding are received at DOE headquarters from the field offices and end in late 1994 when appropriations for FY 95 are issued to the field based on actual congressional appropriations and an analysis of priorities determined by EM.
An Overview of ERPS
ERPS, a multiattribute utility model, is set up to allow the simultaneous evaluation of multiple objectives:
-
Reduce health risks
-
Reduce environmental risks
-
Avoid adverse socioeconomic impacts
-
Respond to regulations
-
Reduce uncertainty
-
Avoid unnecessary economic costs
-
Achieve DOE cleanup policy milestones
In addition, the system is set up to allow a two-step screening
evaluation. These screening steps allow the determination of emergency activities and "time critical" activities. Emergency activities are self-explanatory. Time-critical activities are actions that are not emergencies, but need to be dealt with promptly; they include work to stabilize conditions that, if left untended, might deteriorate in ways that would create emergencies, and targeted study efforts to evaluate areas suspected of posing high, near-term risks. These two classes of activities are flagged for immediate funding. In effect, they are kicked out of the system at an early stage.
The rest of the system is then applied to other potential cleanup activities. The overall process is shown in Figure 6-1. The process incudes an initial phase carried out at the local level and a second phase at the national level. (The initial and second phases are not shown in Figure 6-1.)
At the local level, emergency and time-critical activities are identified and pulled out of the system at that point for immediate funding. All other possible activities are then identified and ranked (or scored) in accord with the seven objectives. Costs are also developed for each activity. Finally, activities are bundled into groupings called "budget cases." Each installation is charged to develop a small series of budget cases. These include a minimum budget case, which by definition will include time-critical activities and all other activities that meet the basic needs of the facility; other budget cases range upward to a maximum budget case, which includes all activities that the installation management believes that it could undertake in a given year.
The budget cases are then submitted to a central headquarters group where they are aggregated and analyzed for the entire set of environmental restoration operations. Both the estimated benefits (in the form of risks reduced or eliminated, for instance) and the estimated costs are covered in this analysis. The resulting analysis is then presented to DOE decision-makers as part of their consideration of alternative budget decisions.
Scientific Components of ERPS
The scientific evaluation of ERPS will focus on the methodology used for scoring the budget cases proposed by the field offices. An overview of the four steps required for multiattribute utility analysis is followed by a discussion of the details associated with their implementation in DOE's ERPS.
The Multiattribute Model
The ERPS is based on an implementation of multiattribute utility theory, an approach to ranking alternatives described in Chapter 3. From a scientific standpoint, multiattribute utility theory is a prescriptive approach to decision-making. It allows the orderly and simultaneous evaluation of multiple factors and objectives. To apply this technique in practice, three steps must be taken.
Step 1. Structure the decision problem. Structuring the decision problem includes identifying the alternatives (different actions that can be taken) and specifying objectives (goals of each different action with respect to DOE's seven objectives listed above), and attributes (what will be accomplished by each alternative). In ERPS, DOE field offices and installations play a major role in identifying and classifying budget-year activities and in defining budget cases (at least three) for evaluation using the multiattribute utility model.
The identification of the objectives is a critical step in the priority-setting model, since these same objectives are used by ERPS to compare budget cases from the same site, as well as to compare and to set priorities for budget cases from different sites. Therefore, the objectives have to be sufficiently general to make
mentally different kinds of environmental restoration activities in different geographical, political, socioeconomic, and ecological environments. Yet, these same objectives have to be sufficiently detailed and unambiguously defined so that each budget case can be evaluated on each objective.
Although this list of objectives might be sufficiently general to cover a wide range of ERPS-related budget concerns, it is not sufficiently well defined to allow specific budget cases to be evaluated quantitatively against each objective. To render more operational this list of objectives for the purposes of ERPS it was necessary to create an objectives hierarchy with these seven broad statements at the top and with more detailed objectives further down. The lower level objectives essentially define the higher level objectives in more detail, and can be thought of as a means to their ends. The objective hierarchy for ERPS is shown in Figure 6-2.
For each of the lowest-level objectives in the hierarchy, an attribute must be identified that can be used to measure the degree to which the objective is achieved. For some lower-level objectives, such as cost, the appropriate attribute would obviously be in dollar amounts. For other objectives, especially those that relate to concepts, such as community concerns that are more subjective, it might be necessary to construct a metric attribute using a categorical scale (e.g., 1 = major impact, 2 = some impact, 3 = little impact).
Step 2. Assess the possible impacts of different alternatives. In this step, DOE attempts to measure the impact of each alternative on each attribute. In ERPS this step is carried out by "scoring" the budget cases on each of the criteria. This is an important step, and the scores for each of the attributes in ERPS are based on a different set of instructions. For each attribute, these instructions explain how the impact of a budget case is to be measured or estimated. In some instances, these impacts are measured on a natural numerical scale, such as dollars, while in other cases the
scales are verbal and require subjective judgments. These constructed scales allow scores that range from 1 to 7. For most of the attributes, scores dose to 1 indicate favorable conditions and scores close to 7 indicate very unfavorable conditions. Further detailed discussion of the objectives and the instructions for scoring the attributes associated with them is presented in the next section.
Step 3. Determine preferences (values) for the decision-maker. The objective of Step 3 is to translate the scores assigned to each budget case on each alternative into a single number that can be used to rank the budget cases according to the preferences of the decision-maker(s). In the case of multiple attributes, this is accomplished by defining and assessing a multiattribute utility function. This process has four parts.
First, the functional form of the multiattribute utility function must be determined. Intuitively, the objective of this step is to define single-attribute utility functions over each of the individual attributes and then combine them mathematically to calculate an overall utility number for each alternative. In general, the single-attribute utility functions on the attributes could be combined in a variety of ways; for example, they could be added, multiplied, or combined using a complex polynomial form. However, if certain conditions of independence can be justified, then the form of the multiattribute utility function can be simplified to the additive case. In ERPS, the multiattribute utility model is additive at the level of the objectives.
Second, individual utility functions must be defined for the attributes and the objectives. These utility functions translate the scores on the attributes into measures of value or worth. The individual utility functions proposed on each of the attributes for the ERPS are different and will be discussed in the context of each of the objectives.
Third, weights must be determined for each of the objectives and attributes in an additive multiattribute model. Intuitively, it
is often appealing to interpret these weights as measures of the relative importance of each criterion. More rigorously, these weights represent the relative importance of changing each attribute (or objective) from its least desirable to its most desirable level.
Fourth, alternatives must be evaluated and compared. Once the alternatives have been scored on each of the attributes, and their corresponding utility function values have been calculated from the single attribute utility functions, it is a straightforward matter to multiply these utility values times their weights and to sum the results to determine an overall utility function score for each alternative. This approach is followed for each of the budget cases in ERPS to determine their overall rankings. In addition, it is appropriate and typical to perform a sensitivity analysis on the re-suits to investigate how the rankings might be affected if scores, single attribute utility functions, or objective weights are changed over a reasonable range. That is, the analyst systematically changes one element (for example, the weights from 0.1 to 0.6) to determine how much that element must be changed to alter the rankings. The goal of the sensitivity analysis is to identify the most sensitive elements in the model.
Defining the Seven Objectives in ERPS
How the scoring and the utility function values for the various attributes are determined for each of the seven objectives is discussed below, followed by a detailed description of the multiattribute model that combines these assessments.
Health Risks
ERPS uses three measures of health risks that are eventually
combined into two attributes: population health risk and individual health risk. The population health risk measures "the future expected peak annual health effects" in terms of the probability of an incidence of "a major, adverse health consequence." For this purpose, a major adverse health consequence is defined, in part, as a premature fatality, severe neurotoxic effect, or disabling birth defect (DOE, 1991b). The individual health risk is defined as the "estimated lifetime probability of a maximally exposed individual experiencing a major health effect." Finally, the third measure of health risk incorporated into ERPS is an estimate of health risk urgency and timing, which is defined as an estimate of the earliest time at which either the population or individual risks will actually equal their estimated values.
The scoring for the population and individual health risks is based on an approach that requires several steps. First, it is necessary to make an estimate of the baseline population health risk and the baseline individual health risk. These baseline risks are estimates of the potential health impacts that would occur if no future actions to reduce risks are taken. To determine the baseline population health risk score (on a scale from 1 to 7) for a site or facility, four possible sources of information are suggested:
-
A formal risk assessment that explicitly estimates the future peak annual health effects on a quantitative basis.
-
The use of judgment based on a subjective evaluation of future scenarios that could identify how adverse health effects could occur.
-
The use of the "undiscounted aggregate HPI score" from MEPAS (HPI means Hazard Potential Index. It is an estimate of the long-term average health effects for a population (Droppo et al., 1990).
-
The use of the Hazard Ranking System score from the model developed for EPA (see Chapter 4).
Guidelines for using information from any one of these measures
to determine the baseline population health risk score are given in the instructions for implementing ERPS.
An estimate of the baseline individual health risk is also required. According to the instructions for ERPS, this estimate should be based on quantitative risk assessments. If no quantitative risk assessments have been performed, then the assumption is made that the individual risk score should equal the population risk score. The scores of 1 through 7 correspond to the estimated lifetime probabilities of a maximally exposed individual experiencing a major health effect ranging from 10-1 to 10-7
To evaluate a specific budget case proposed by a field office, an estimate is made of the reduction in risk (either population or individual) that would result from the associated remediation activities. This requires two estimates. First, the fraction of the risks in the baseline case that would be addressed by the remediation activities is specified based on subjective judgment. Second, the fraction of the risks that are addressed that will be eliminated is identified, again based on subjective judgment. These two numbers are multiplied together to determine the percentage risk reduction that would be associated with the remediation activities. This percentage is then transformed into a "scoring decrement" in the 1 to 7 units that measured the baseline risk score using a scale provided in the instructions, or a simple mathematical formula. Finally, this scoring decrement is subtracted from the baseline risk score to determine the case risk score for the corresponding budget case.
In summary, the health effects (population and individual) of the budget cases are evaluated in terms of estimates of how much they reduce the risks associated with the baseline case. Each budget case is assigned two scores from 1 to 7, one for population risk and one for individual risk, Each of these scores can be translated into a corresponding probability of adverse health effects.
The next step is to use a single attribute utility function to translate these scores into measures of value. The transformation
for each of these health risk measures is an exponential function, which makes each of these health measures linear in the numbers of anticipated health effects. In addition, the health risk urgency and timing score is used to determine over how many years the number of anticipated adverse health effects should be discounted using a constant discount rate. Therefore, this transformation means that the health risks are actually measured as estimates of the reductions in the discounted (for timing) number of adverse health effects that would result from the remediation efforts associated with the budget cases. (In discussing the process of discounting, Droppo et al. (1990) state that normally, a major impact that will occur tomorrow is of more concern than an equal impact that will occur 7,000 years from now.)
This procedure for estimating health risks could be criticized on several grounds. The most obvious is the lack of specific scientific data for most of the estimates that are required to determine the baseline risk scores and to determine the effectiveness of the proposed remediation activities.
The scoring and scaling functions eventually lead to the use of a preference function that is linear in terms of the number of anticipated adverse health impacts. For many criteria, including anticipated numbers of deaths, social decisions are often made that imply that these preferences are not linear, but instead exhibit increasing or decreasing marginal values. However, over the range of anticipated health impacts that is considered in this model, the assumption of linearity seems appropriate.
A more subtle issue is the use of population risks and individual risks to estimate the health risks of budget cases. The multiattribute utility model that eventually combines these measures is additive, which implies that these measures are independent from one another in their effect on the ranking of alternatives. The use of these two measures may be viewed as a simplistic attempt to address a complex issue in risk analysis and public choice, the issue of equity. The population risk measure is an estimate of the
expected number of adverse health effects across the entire population that could be exposed to contamination. As a result, this measure could easily indicate a higher ranking for one site where there is a very low risk to any one individual within a large population that is exposed over another site where there is an extremely high risk for members of a small population. Some would argue that it is not equitable to allow the exposure of a small number of individuals to high risks even if the expected number of adverse health effects in the small population is lower than in the larger population. The attribute of individual risk allows a tradeoff to be made between the expected number of health impacts and the level of risk to the individual (or individuals) who receive maximum exposure. Although more sophisticated models of risk equity have been proposed for situations such as this, these two measures do allow consideration of this issue.
Another issue is that the notion of adverse health effects is not differentiated by degrees of severity or by the characteristics of the individuals that are exposed. Thus, a number of difficult considerations are not addressed by the approach in ERPS to estimate health risks, including the need to distinguish between the implications of an incidence of cancer in an 80-year-old individual versus a birth defect in a child. To the extent that these issues are important and could be differentiated at different sites, they would have to be considered outside of the priority-setting system because of the vast amount of data that would be needed to include the issues in the system.
Finally, the risk urgency and timing score is used to determine the number of years over which to discount the health effects not estimated to occur in the next 70 years (Droppo et al., 1990). If the discounting of health effects were not desired, this option is effectively eliminated from the model by setting the discount rate equal to zero.
Environmental Risks
The procedure with each budget case for evaluating the impacts on environmental risks is similar to the one used for health risks. First, a baseline environmental risk score is established for the site. Then the same procedure is followed for each budget case (using the same health risk worksheet) to determine estimates of the percentage of the environmental risks that would be addressed by the remedial activities associated with the case and the effectiveness of these activities. This determines a scoring decrement to be subtracted from the baseline score.
The baseline score for the environmental risk at a site is determined from two factors. The first is a measure of the sensitivity of the environmental resources at risk. The second is a measure of the environmental threat associated with the problems at the installation.
The score for sensitivity is determined by listing each major environmental resource and assigning it a score from 1 to 4, where 1 corresponds to a resource that is relatively less sensitive (e.g., a state-designated natural area) and 4 indicates a resource that is extremely sensitive (e.g., a national park). A worksheet is provided to aid in this scoring. The total environmental sensitivity score for a site is simply the sum of the scores associated with its individual resources. Next, the estimated level of threat is assigned a score from 1 to 5 depending on a judgment regarding the likelihood that the environment could actually be contaminated as a result of the installation's waste problems. Specific examples are given of situations that should be associated with each score. Finally, the baseline environmental score is determined by the product of the measure of the environmental sensitivity and the magnitude of the environmental threat. The resulting product is scaled to be between 1 and 7, the same scale for the scores assigned to the health risks.
The environmental score is assumed to be a logarithmic scale and is transformed by an exponential single attribute utility function to create a measure of value in the multiattribute utility function. From a scientific standpoint, this measure of environmental impact may be intuitively appealing, but it is a crude measure at best. This procedure illustrates a situation where an attempt has been made to simplify the implementation of the priority-setting system at the potential cost of some accuracy in the estimates. Direct estimates of the value of the remedial efforts associated with budget cases in alleviating environmental threats might be more accurate than these scores.
Socioeconomic Impacts
A score for the objective of minimizing negative socioeconomic impacts is derived from a simple model that combines the scores on three attributes. Once again, the scores are assigned from 1 to 7 for each attribute.
The first attribute related to the socioeconomic impact of a budget case is the level of public concern over the installation's problems. A score of 1 is used to indicate that the area residents demonstrate almost no knowledge or interest in the waste problems of the installation. A score of 7 indicates a very high level of concern, that might be characterized by frequent negative national newscasts and large-scale protest.
The second attribute is a measure of the impact of the budget case on the cultural and religious principles that are prevalent in the area. A score of 1 would indicate very low impact, while a score of 7 would be used to indicate major conflicts.
The third attribute is a measure of the economic or opportunity losses associated with the impact of the budget case on the surrounding community. Examples of potential losses are: 1) de-
pressed property values in close proximity to the installation; 2) frustrated demands to use contaminated facilities, lands, or other resources; and 3) decreased recreational value. If these losses are anticipated as a result of the selection of a budget case, an estimate of the economic equivalent of these losses is required. A score of 1 is assigned to estimated economic losses of no significance, while a score of 7 is assigned to estimated losses on the order of $100 million total or $10 million annually.
Once a budget case has been scored on these three attributes, its overall socioeconomic score is calculated by a nonlinear mathematical equation involving these three attribute scores. Specifically, each of the three scores is squared, the squares are summed, and the square root of this total is taken and normalized to the range of 1 through 7. This equation was determined by a panel of experts convened for this purpose.
Finally, the score for each budget case is transformed by an exponential single attribute utility function into a linear scale that measures the value of these socioeconomic impacts. From a scientific point of view, this approach is crude and again represents a trade-off between technical rigor and the need to create a model that is relatively easy to implement. However, since the transformation of the three attribute scores into an overall score for the socioeconomic impact of the budget case was reviewed by a panel of experts, it may be a reasonable approximation to a valid measure for this important, but rather vague, objective.
Uncertainty Reduction
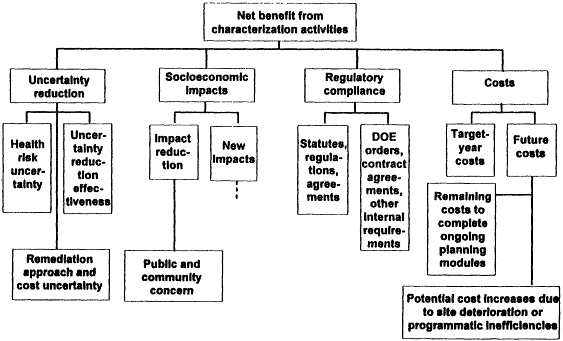
Perhaps one of the most innovative aspects of the ERPS is the inclusion of "uncertainty reduction" as an objective in the multiattribute utility model that is used to rank the budget cases. In the early stages of environmental restoration work, a great deal of
uncertainty might exist at an installation regarding the actual amounts of various radioactive and toxic wastes, the risks to health and to the environment associated with these wastes, and the costs of the actions that will be necessary to mitigate these problems. Therefore, it is necessary to undertake some activities that may be classified as characterization activities, whose sole purpose is to reduce some of these risks.
One of the advantages of a formal analysis of a problem using decision analysis techniques is that the value of eliminating some of the uncertainties associated with alternatives (budget cases) can be explicitly determined in economic terms. These ideas have been incorporated into the ERPS to determine a score for the objective of uncertainty reduction. If this objective were not included, then activities and budget cases that focus on characterizing the nature and significance of the hazards associated with potential problems at an installation would not be valued appropriately by the priority-setting system.
The details of the procedure used to determine a score for the reduction of uncertainty that may be achieved by a budget case are complex and require responses to a worksheet with seven different parts. Therefore, a summary of the logic behind this worksheet will be given rather than a description of its individual steps.
The value of uncertainty reduction at a specific installation depends on (1) the degree of the uncertainty associated with the risks at the installation; (2) the degree of the uncertainty associated with the appropriate remediation activities and therefore with their total costs; and (3) the effectiveness of the proposed characterization activities in reducing the uncertainties associated with (1) and (2). The first parts of the worksheet for estimating the uncertainty reduction associated with a budget case require a best-guess estimate of the current risks associated with the problems being characterized and an estimate of how much higher those risks could be. These estimates are based on the scores that were developed to measure population and individual health risks.
The next parts of the worksheet require estimates of the range of possible remediation costs associated with the same problems. High and low cost estimates are required to determine an implied probability distribution over costs. Finally, judgments are required to estimate the effectiveness of characterization activities in eliminating all or only percentages of the risks associated with risks and costs. From this information, a uncertainty reduction score is determined on a scale from 1 to 7. This scale too is transformed by an exponential function into a linear scale that assigns value to the uncertainty reduction activities.
Conceptually, the inclusion of the objective of uncertainty reduction in the ERPS is a sound and important feature of the model, even though estimating the score for this objective is complicated and requires several judgments that would be difficult to make.
Regulatory Responsiveness
The determination of a score for the objective of being responsive to all regulations requires judgments regarding three issues: (1) How likely is it that a regulatory violation will occur? (2) How serious will the violation be if it occurs? and (3) How soon might the violation occur? Worksheets are provided to assist in making these judgments for the baseline situation at the facility and for the different budget cases.
The likelihood that a budget case will result in an allegation of a regulatory violation is estimated on a scale from 1 to 5, where a 1 indicates that the budget case will keep the facility on track with regard to regulations and a 5 indicates that it is almost certain that one or more violations will occur. In a similar manner, the seriousness of a violation, if it should occur, is scored on a range from 1 to 5, with a 1 corresponding to a violation of minor signifi-
cance (e.g., a slippage in meeting a nonlegally binding or a nonenforceable agreement) and a 5 corresponding to a violation of major significance (e.g., numerous enforceable obligations will be missed, significant monetary penalties will be assessed, and DOE will be charged with knowingly and recklessly endangering public health, welfare, or the environment). Finally, the time at which the regulatory problem is likely to occur is scored on a 5-point scale.
These three scores are then combined into a total regulatory score scaled from 1 to 7 using a mathematical equation. Essentially, this equation corresponds to multiplying the seriousness of the violation by its likelihood, and discounting the result at 25% per year of delay. An exponential function is then used to translate this score into a measure of value for the multiattribute utility function.
Ability to Meet DOE Milestones
This objective is measured in a straightforward manner;, it is not included as an objective in the multiattribute utility function. Very simply, if a budget case does not include sufficiently effective activities to permit achievement of DOE long-term policy milestones (e.g., the 30-year cleanup goal for DOE sites), then it is assigned a score of 1. Any case with a score of 1 must include a description of the specific milestone that is threatened.
Costs
Costs associated with the budget cases must also be estimated. Although the estimates of these costs may be difficult in practice, the requirements for determining them are straightforward.
First, the costs associated with the target budget year are estimated. Second, the remaining costs that are needed to complete
multiyear remediation or characterization studies that are initiated or continued by the activities within the budget case are estimated. Third, any impacts on future costs are estimated. These costs could be, for example, the increased costs when a particular budget case forces a delay in remediation activities that would alleviate an existing, deteriorating problem.
Aggregation of Measures of Value
The steps described above lead to scores (typically from 1 to 7) and then to measures of value through the transformation of these scores with a single attribute utility function (typically an exponential transformation). These measures of value are then aggregated using the following multiattribute utility model:
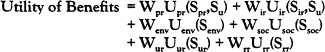
where the W's are weights on the objectives, the U's are the single attribute utility functions, and the S's are the scores on the objectives. The subscripts refer to the following objectives:
pr = population risks,
ir = individual risks,
u = risk urgency,
env = environmental risks,
soc = socioeconomic risks,
ur = uncertainty reduction, and
rr = regulatory responsiveness.
Finally, the net utility of each budget case is calculated from the expression
where rc = remaining costs and FC = future costs.
The additive form of this multiattribute utility function implies the assumption of certain independence conditions regarding the preferences of the decision-makers for the different objectives. Technically, these independence conditions are known as preference independence and difference independence (for a discussion, see von Winterfeldt and Edwards, 1986). Informally, speaking, these conditions are satisfied if the preferences of a decision-maker regarding the performance of an alternative on one objective is not affected by the level of its performance on another objective. It seems likely that this technical condition might be violated for the objectives of minimizing population health risks and individual health risks. However, the practical implications of this violation, if it exists, should not alter significantly the rankings produced by ERPS.
The final issue to be considered is the selection of the weights (the Ws) in the multiattribute model. As discussed earlier, these weights should reflect the relative importance of changes from the least desirable to the most desirable levels of performance on each of the objectives.
In ERPS, the combination of logarithmic scores (the Ss) and exponential single attribute utility functions (the Us) has the implication that each of the objectives is measured on a linear scale. In this special case, it is also possible to interpret these weights as a trade-off ratio. In addition, because two of the objectives are measured in dollars, these trade-off ratios can be expressed in terms of the number of dollars that would be paid to gain a desirable unit increase in each of the other objectives.
In a pilot test of this model in 1990, the values for the weights that were used are shown in Table 6-1, along with their corresponding interpretations in terms of dollars. In this pilot test, the
largest weight (36%) was placed on reducing health risks. An important issue for the final implementation of this model is the process that will be used to determine these weights, since the rankings of the budget cases will be very sensitive to this choice.
TABLE 6-1. Current weights for DOE ERPS.
|
Factor |
Weight |
Basis |
|
Health risk |
36% |
$5M/health effect |
|
|
|
Individual weight = 1/5 of population weight |
|
Uncertainty reduction |
32 % |
Implied by weight on health and dollar tradeoffs |
|
Environmental risk |
13 % |
$400M to eliminate a "7" |
|
Socioeconomic impact |
9.5 % |
$300M to eliminate a "7" |
|
Regulatory compliance |
9.5 % |
$300M to eliminate a "7" |
|
Other: Risk urgency/timing = 5% discount rate. Remaining and future costs = 10 % discount rate. Source: T. Longo, DOE, unpulished data presented to the committee, April 10, 1991. |
||
SUMMARY EVALUATION OF DOE's PRIORITY SETTING FOR HAZARDOUS WASTE SITES
The DOE priority-setting process was less well developed during the period of the committee's activities and so it did not receive as much evaluation as EPA's HRS and DOD's DPM. Like those mathematical models, DOE's ERPS model was developed as an aid in DOE's overall priority-setting process. The ERPS model is much more comprehensive than that of the other agencies and considers social, economic, and political impacts as well as risk to
human health and the environment. Although ERPS covers a much broader scope of considerations, it nevertheless should address the criteria identified in Chapter 2 for effective model development and application and should contain certain specific desired technical features. The following is a summary of the evaluation of these criteria with respect to ERPS to the extent that the committee could do so.
General Issues in ERPS Model Development and Application
Defined Purpose: The purpose of ERPS appears to be defined sufficiently well. It is to serve as an aid in allocating funds in a given year, in developing funding proposals to Congress in subsequent years, and in projecting fund requirements in future years. The model would help set priorities for these needs based upon a variety of social, economic, and political considerations, as well as impacts on human health and the environment.
Credibility and Acceptability: The committee could not evaluate this aspect sufficiently at this time. General acceptability of the model would be obtained through open evaluations by interested parties, good documentation, appropriate demonstration of the impact of model sensitivity and uncertainties, and good model validation.
Appropriate Logic and Implementation of Mathematics: Based on the committee's general assessment, ERPS is quite comprehensive.
Model Documentation: Adequate documentation of ERPS was not available at the time of the committee's deliberations.
Model Validation: ERPS is still under development, and a formal validation of the kind envisioned by the committee has not yet been conducted.
Model Sensitivity and Uncertainty Analysis: Inadequate information on these aspects was available to the committee for evaluation. One feature of the model is consideration of the value of reducing uncertainty through data collection and evaluation. Thus, the importance of uncertainty has been recognized by model developers. However, the model considers many different social, political, economic, environmental, and health issues in the development of rankings. In addition, many inputs to the model are based upon subjective judgements. It will be crucial in a broad and comprehensive model of this type to conduct a wide range of sensitivity analyses to help the model developers and others understand the impacts of uncertainties in data input on the resultant relative rankings of sites. The model will need modification in areas where small uncertainties lead to significant changes in budget case rankings.
Specific ERPS Technical Features
Applicability to All Waste Sites: ERPS is a comprehensive model that addresses both radioactive and nonradioactive hazardous wastes, and is it applicable to all DOE sites.
Allowance for Dynamic Tracking: Dynamic tracking is one of the important features for which ERPS was being developed. DOE planned to update model inputs on an annual basis and to consider in each year's funding allocations and requests the reductions of risk achieved at sites based on ongoing remediation efforts.
Discrimination Between Immediate- and Long-Term Risk: As with the other two agencies, DOE plans to address immediate risks outside of ERPS, and ERPS itself will be used to address longer-term problems.
Inclusion of Cost Estimates of Remediation: Cost estimation
for remediation and associated risk reduction achieved are major features of ERPS.
Transparency: ERPS is quite transparent. The multiattribute utility theory that forms the basis for ERPS is a valuable tool for organizing a complex of information for review by others. The weighting factors used are readily apparent. However, the impact of changes in any given factor on the site-ranking outcome is not clear. For this reason, the sensitivity and uncertainty analyses indicated above will be needed.
User-Friendliness: ERPS allows input of subjective judgment in the scoring if the scorer does not have adequate scientific data available. This does lead to user-friendliness, but also could be subject to abuse and poor decision-making. The trade-off here between user-friendliness and sound ranking of sites needs consideration.
Appropriate Security: This aspect was not addressed by the committee.
Doe Priority Setting Process
Because ERPS was under development and has not been implemented for priority setting, the committee was unable to determine how well it would fit into the overall priority-setting process. ERPS is intended to be used to address cleanups that pose longer-term, rather than immediate, threats to public health and the environment. However, the committee also notes that DOE has entered into many agreements with EPA and various states that would override the relative evaluations of sites provided by ERPS. How DOE would address the conflicts likely to develop between such prior agreements and site rankings as developed by ERPS is not dear. A system such as ERPS could be an important tool in helping to address such conflicts by providing a more objective
evaluation of desired remedial priorities. Thus, while the committee is not in a position to judge whether the ERPS would provide the objective ranking of sites for remediation that is needed, it nevertheless believes that a well-developed, documented, validated, and comprehensive model can help greatly in making sound decisions about what sites to remediate first, and the degree of cleanup that is desirable.


