
8
COMPARINGFEDERALRANKINGMODELS
THE DECISION-MAKING PROCESSES
The U.S. Department of Defense, U.S. Department of Energy, and U.S. Environmental Protection Agency have evolved three unique processes for choosing sites to remediate and for deciding the degree of hazard at each site. The committee reviewed these processes, specifically in an attempt to understand where each agency's model fits into their overall priority-setting process. Much less written information was available to the committee about the overall prioritization processes themselves than about the ranking models used in the processes. Written descriptions were often unavailable about the overall process and most of the information was obtained by questioning experts who visited the committee. With this caveat, the committee compares and contrasts in this chapter the proce-
dures used by three federal agencies to assist in making decisions about remediation priorities.
Mandates for Remedial Action
A knowledge of the remedial action mandates of DOD, DOE, and EPA is critical to understanding their decision-making processes. EPA is required by federal law to be responsible for abandoned and active hazardous waste sites, underground storage tanks, a variety of other hazardous waste programs, and the integration of environmental laws, such as the Resource Conservation and Recovery Act (RCRA) of 1976 and the Toxic Substances Control Act (TSCA) of 1976, that impinge on hazardous wastes (e.g., polychlorinated biphenvls). EPA is also required by law to obtain funds for cleanup from responsible parties and from a tax on chemical products. Both of these fund-raising aspects are controversial. EPA is required to work with state environmental agencies and to serve in lieu of such agencies in some states. EPA is also expected to provide outreach for advice to local communities, partly in a manner mandated by the Superfund Amendments and Reauthorization Act (SARA) of 1986. In short, EPA is mandated to be involved in major decisions and is required to directly deal with a broad gamut of interested parties. Its decisions are open to public scrutiny at several stages in the process.
In contrast to EPA, DOE and DOD were initially protected from outside intervention by national security concerns. However, when contamination became an issue at DOD and DOE sites, these agencies were given responsibility by Congress for their own cleanup. Unlike EPA, their source of funds for work at sites is the federal government, not industry or state or local governments.
Site complexity is another important issue. DOD and especial-
ly DOE have some extraordinarily complicated sites that include hundreds, and sometimes thousands, of contaminated areas. While EPA is responsible for many more sites, these typically are easier to manage because they do not contain such large quantities and mixtures of radioactive and chemical wastes. Finally, closure of DOD bases and DOE sites imposes additional problems and complexities of scientific, social, economic, and political relevance on these two federal agencies.
Listing and Screening of Sites
DOD's, DOE's, and EPA's priority-setting processes have evolved to reflect the differences in their mandates, historical responsibilities, and site complexity. Superfund site nominations can come from a state, another. federal agency, or other sources, which gives EPA minimal control over nominations. In contrast, DOE and DOD sites are primarily self-nominated by DOE and DOD personnel.
EPA was mandated by Congress to develop a method to pick at least 400 sites for the National Priorities List (NPL). Furthermore, Congress suggested factors to be used for choosing sites for NPL designation. The combination of a need to pick only a fraction of more than 50,000 potentially nominated sites and congressional input into the variables to be considered in the selection process led EPA directly to the development of a relatively simple mathematical screening model, the Hazard Ranking System (HRS), which is used to determine which contaminated sites will become part of the NPL and which will not. Since EPA must negotiate with responsible parties, states, and other stakeholders, it takes great care to document all of its data inputs on the assumption that its decisions might be legally challenged.
DOE and DOD have had much more control over which sites
to choose for analyses and remediation. The two agencies have divided their sites among special programs for rapid cleanup became of potential imminent hazards. For example, sites have been sorted into categories of higher priority cleanup before a base can be closed and less immediate action because they pose a less imminent but chronic threat. DOD (including the Army, Navy, and Air Force) and DOE exercise considerable control over the entire process. They can decide within their funding limitation whether or not to provide monitoring and cleanup funds to every potential site. Unlike EPA, initial scientific data inputs are not required to screen the large number of potential sites to obtain a smaller manageable set. DOE and DOD can collect information throughout the process at all sites. EPA in contrast does not have the resources to collect detailed data at tens of thousands of sites.
The DOD and DOE models described in this report reflect the greater control these agencies have over the decision-making process. DOE has the political independence and resources to develop a priority-setting method that requires extensive data gathering collection at every step in the process for its most hazardous sites. Because each site may contain mixtures of extremely toxic and radioactive as well as other types of wastes, DOE needs much information to make sound billion-dollar site cleanup decisions that encompass entire sites as well as modules within each site. Furthermore, the costs and benefits of remediating some DOE sites are potentially so substantial that DOE includes a cost and benefit section in its proposal formal decision-making model.
DOD's mandate leaves it somewhere between EPA and DOE with respect to the need for initial site-screening and extensive scientific data. DOD can provide money to base commanders for investigating every site, but not all DOD sites can be remediated fully at the same time. Consequently, DOD can collect data for prioritization at a later time in the overall process than EPA, but uses it within a simple ranking model to provide guidance to headquarters for decisions about the relative ranking of sites for cleanup.
Designation for Remediation
The combination of mandate and site complexity is also reflected in site-selection for remediation. Once a site is legally approved for inclusion on the NPL, more scientific data are gathered by EPA, usually in connection or in agreement with responsible parties and states. When these data have been gathered, they are used along with economic information to develop alternative remediation scenarios as part of the remedial investigation and feasibility study (RI/FS). These analyses, which lead to a Record of Decision for recommended remedial action, are sometimes challenged by stakeholders in court.
Responsible parties would like to use innovative technologies or methods that limit their costs and future liability. The local public is usually characterized as wanting sites remediated to their original uncontaminated condition, although Chapter 1 suggests this is not always the case. States frequently prefer remediating sites where the economic burden is on the responsible parties. Although the federal government contributes 90% of the total cost of remediation and the states contribute only 10% for abandoned sites to some states this is still burdensome during this period of little or no economic growth. Largely for this reason some states have had far fewer sites remediated than, for example, California and New Jersey, which have had more state funds available. States also tend to favor solutions that minimize continuing operating costs (e.g., pumping and treating contaminated groundwater) because states are responsible for 100% of the governmental share of the operating and maintenance costs. EPA must contend with all of the diverse interest groups when it makes decisions.
For many of the major sites, DOD and DOE have signed legal contracts with the states and EPA that mandate specific targets for cleanup of these selected sites. Many of the DOD and DOE sites are on the NPL and thus fall under EPA jurisdiction, but sites with such legal agreements dearly take priority over other sites.
DOD and DOE have made some formal attempts to include local officials and concerned citizens in their decision-making process, but their mandate to consult with other interested parties is not nearly as strong as it is for EPA.
COMPARATIVE SCORING EXERCISE OF FEDERAL RANKING MODELS
Objective and Background
Mathematical models are being used or are under development by EPA, DOE, and DOD to serve as aids in the overall priority-setting process described above for determining which sites to cleanup first. The site rankings resulting from model calculations are often thought to be a major determining factor in selection of sites for cleanup, but this is not always the ease. Many other considerations enter into these decisions, as already discussed. Nevertheless, mathematical models can help to evaluate complex factors thought to be important, including risk to public health and the environment. The committee spent most of its efforts in a review of the models being used or developed by the three federal agencies; those models tended to be much better documented and more subject to scientific scrutiny than the overall priority-setting processes themselves.
To learn about the relative performance of models used for ranking sites, the committee felt that it was essential to apply DOD's DPM, DOE's MEPAS, and EPA's HRS to a common set of sites. The committee performed its analysis with the awareness that these models have different purposes, features, and data requirements. The scoring exercise helped to familiarize the committee with the models' input data requirements and operating constraints, and characteristics that contribute to similarities and
differences in model outputs. For the five hazardous waste sites selected, the exercise also helped the committee to determine whether the three models produced similar relative hazard rankings based on potential exposures to humans.
The purpose of this scoring exercise was not to determine which model is right or wrong nor whether one ranking method is better than another, but to compare outputs obtained using input data developed from the same set of contaminated sites. Table 8-1 summarizes the features of each model. Table 8-2 identifies the environmental transport pathways addressed by each model. Note that although features of DOE's Environmental Restoration Priority System (ERPS) are shown in Table 8-1, it was not included in the scoring exercise because, as discussed in Chapter 6, its design and application are very much different from DPM, MEPAS, and HRS.
Differences in the models' features make an exact comparison of the models very difficult For example, the HRS and the DPM are scoring systems, whereas MEPAS is a fate and transport (FaT) model-based system. Scoring systems assign arbitrary numerical values to FaT and other parameters that characterize the site. These numerical values are then combined by an arbitrary algorithm and normalized to yield a site score. The process of contaminant migration from a site is not directly determined in a scoring system. Conversely, FaT model-based systems use contaminant mass balances in complex mathematical formulas to predict and quantify the migration of contaminants to potential receptors. MEPAS includes FaT algorithms for site contaminants and an arbitrary final numerical score, hazard potential index, to scale-quantify the risk to human health. Although different in nature, the three models might be expected to produce similar relative rankings when applied to the same set of hazardous waste sites—that is, to give the same indication of which sites produce the higher health risk.
Each agency was provided with a common set of site descrip-
TABLE 8-1 Comparison of Features of EPA's Hazard Ranking System (HRS), DOD's Defense Priority Model (DPM), DOE's Multimedia Environmental Pollutant Assessment System (MEPAS), and DOE's Environmental Restoration Priority System (ERPS)
|
Feature |
HRS |
DPM |
MEPAS |
ERPS |
|
Purpose |
|
|
|
|
|
Screening |
Yes |
Yes |
Yes |
Yes (for emergencies) |
|
Alternative evaluation |
No |
Possible |
Yes |
Yes |
|
Resource allocation |
No |
No |
No |
Yes |
|
Types of sites covered |
All |
DOD |
DOE |
All |
|
Contaminant type |
|
|
|
|
|
Radioactive |
Yes |
Yes |
Yes |
Yes |
|
Nonradioactive |
Yes |
Yes |
Yes |
Yes |
|
Risks |
|
|
|
|
|
Human health |
Yes |
Yes |
Yes |
Yes |
|
Environmental |
Yes |
Yes |
No |
Yes |
|
Socioeconomic |
No |
No |
No |
Yes |
|
Feature |
HRS |
DPM |
MEPAS |
ERPS |
|
Cost estimates of remediation |
|
|
|
|
|
Alternatives |
No |
No |
No |
Yes |
|
Dynamic tracking |
Suggested, but not appropriate |
Could be adapted to do so |
Could be do so adapted to |
Yes (year to year) |
|
Required QA/QC |
Yes |
Yes |
Yes |
Yes |
|
Explicit value-preference weights |
No |
Yes |
No |
Yes |
|
Transparency |
Faira |
Yes |
No |
No |
|
User-friendly |
Faira |
Yes |
Yes |
Yes |
|
Security features |
Yes |
No |
Yes |
No |
|
Process of model review |
|
|
|
|
|
Peer review |
Yes |
Yesb |
Yes |
Yes |
|
Public participation |
Yes |
Some |
Yes |
Yes |
|
Comments |
Yes |
Yes |
Yes |
Yes |
|
Internally consistent logic and math |
Yes |
Yes |
Yes |
Yes |
TABLE 8-2 Environmental Transport Pathways Addressed in EPA's Hazard Ranking System (HRS), DOD's Defense Priority Model (DPM), and DOE's Multimedia Environmental Pollutant Assessment System (MEPAS)
|
Pathway |
HRS |
DPM |
MEPAS |
|
Air-vegetation |
No |
No |
Yes |
|
Soil-vegetation |
No |
—a |
Yes |
|
Water-aquatic biota |
Yes |
— |
Yes |
|
Terrestrial animals |
No |
— |
Yes |
|
Air-water |
No |
Yes |
Yes |
|
Water-air |
No |
Yes |
Yes |
|
Air-soil |
Yes |
Yes |
Yes |
|
Water-sediment |
No |
No |
Yes |
|
Sediment-water |
No |
No |
Yes |
|
Soil-water |
Yes |
Yes |
Yes |
|
Soil-groundwater |
Yes |
Yes |
Yes |
|
Groundwater-soil |
No |
No |
Yes |
|
Groundwater-surface water |
Yes |
— |
Yes |
|
a Not determined. |
|||
tions, narrative, background, and data, and they were asked to run their respective models and to provide the committee with the scoring results. The sites were selected in consultation with representatives of EPA, DOD, and DOE from a database describing actual sites. In selecting the sites, an effort was made to obtain a broad representation of site characteristics such as contamination and site type, potential for human exposure, and potential for ecological impact. To ensure comparable applications, extensive interagency communications occurred. Upon completing the model runs, each agency summarized its results and submitted reports to the committee. The numbers 1-5 were used instead of site names.
Description of the Five Hazardous-Waste Sites Included in the Scoring Exercise
Site 1
Site 1 is a sanitary landfill located on glacial till that was used for solid waste disposal. No engineered liner exists below the landfill. Before 1981, disposal of waste at the site appears to have been uncontrolled and largely undocumented. A vertical french drain located on one corner of the site was used from 1969 to 1978 to dispose of approximately 29,000 gallons of liquid hazardous waste, including various organics, waste oil, diesel fuel, kerosene, and fluids containing polychlorinated biphenvls (PCBs). The french drain was day capped in 1979. No waste was removed prior to capping. Smaller french drains at other locations in the landfill might have been used for disposal of asbestos from demolition and reconstruction projects. The amount of asbestos disposed in the landfill fluctuated from 615 cubic feet in 1984 to 2,000 cubic feet in 1987. The landfill is located 0.3 miles from the nearest resident community and industrial facilities, 0.01 miles from wetlands located in a nature preserve, and 0.25 miles from agricultural lands. Demographics show 3,300 people reside within a 1-mile radius of the site, 12,000 people within a 2-mile radius, and 39,600 people within a 3-mile radius. Approximately 8,000,000 people surround the site within a 50-mile radius.
Site 2
Site 2 is a settling basin that was designed and operated to allow wastewater to percolate through the soil at the sides and bottom. Soil beneath the settling basin has been classified as sand. During its operation, it received approximately 3,000 cubic meters
per day of wastewater. Effluent from the site was discharged into a tributary of a nearby creek. Liquids (containing nitrates and organic solvents) often overflowed, entered the groundwater, and cropped out into the nearby creek and a downstream river and lake. The primary source of effluent sent to the basin was characterized as electroplating waste. The site is surrounded by forested countryside and nonforested areas comprising lowland hardwood swamps, sand hills, old agricultural fields, and aquatic areas. Two large population centers are within 25 miles of the site; one has a population of 25,000 people. The population density in the counties surrounding the site ranges from 23 to 560 people per square mile. Approximately 583,000 people surround the site within a 50-mile radius.
Site 3
Site 3 is a drum storage yard site with 78,000 drums stored on an asphalt pad. This site is located by a stream that discharges into a river. The subsurface below the site is characterized as a layer of day with varying content of silt, sand, and rock fragments that overlies limestone and dolomite rock. The drums contain inorganic and organic waste sludge that was collected from a retention basin and holding pond. The outside of the drums show signs of internal corrosion. Sludge contained in 45,000 of the drums has been stabilized in concrete grout; those drums are not thought to contribute to fugitive emissions. Another 32,000 drums contain raw sludge. Liquid sludge has leaked from some of the drums onto the asphalt pad and possibly into the surrounding soils. Solid sludge might also be escaping from some drums. 8,000 drums have been drained of free liquid and moved elsewhere on-site. The site is surrounded by predominantly rural land consisting of forested, agricultural and industrial areas, with two ma-
jor population centers of approximately 28,000 and 180,000 people within 25 miles. Approximately 820,000 people surround the site within a 50-mile radius.
Site 4
Site 4 is a hilltop building complex used for material testing and high-explosive diagnostic work The site is surrounded by hills, ridges, ditches, and gullies. The subsurface under the site is characterized by considerable horizontal and vertical variability. Volatile organic compounds (VOCs), primarily trichloroethylene, have been pumped through above-ground pipes within the complex. Leaks in the pumping-station building, the valve system outside the pumping-station building, and the work areas have led to VOC releases into the environment. Spills within the complex have been washed into floor sumps that drained into the septic system. The septic system leach field is also a source of VOC release. The population near the site is fewer than one person per square mile. The site is surrounded by grassland. Land use around the site is primarily agricultural and recreational. Approximately 4,140,000 people surround the site within a 50-mile radius.
Site 5
Site 5 comprises waste pits which received various types of metal-containing slurry or dry solid waste. Some pits were lined with compacted native clay and others had rubberized elastomeric membranes. Next to the waste pits (no longer in use) is a burn pit that was used for disposal of chemicals and other combustible waste. In the same area, a clearwell was operated as a settling ba-
sin for process waste and storm water runoff. Leakage through the pit bottoms and runoff into a nearby creek has led to groundwater and surface water contamination. The release of these wastes into the environment has occurred for over 35 years and has led to contamination of air, soil, surface water, and groundwater. The site is surrounded by forested countryside. Within a 5-mile radius of the site, an estimated population of more than 24,000 people resides. Approximately 2,500,000 people surround the site within a 50-mile radius.
Model Results and Comparison of Scores
The following is a derailed analysis of the scores and an evaluation of the comparative scoring exercise. Table 8-3 lists the scoring results and descriptive statistics for the three models. The scores are displayed graphically in Figure 8-1 as an aid to visual comparison of the outputs.
TABLE 8-3 Results from Scoring Five Sites Using DOD's Defense Priority Model (DPM), EPA's Hazard Ranking System (HRS), and DOE's Multimedia Environmental Pollutant Assessment System. (MEPAS)
|
|
Model Score by Site Number |
Descriptive Statistics |
||||||
|
|
1 |
2 |
3 |
4 |
5 |
Ma |
SD |
Ratio |
|
DPM |
45.4 |
28.6 |
19.9 |
15.2 |
33.5 |
28.5 |
11.8 |
0.4 |
|
HRS |
73 |
28 |
1.2 |
2.2 |
4.6 |
21.8 |
30.7 |
1.4 |
|
MEPAS |
53 |
58 |
33 |
23 |
56 |
45 |
16 |
0.4 |
|
a M = Mean; SD = Standard deviation; Ratio = Standard deviation/mean. Source: L. Zaragoza, EPA; data provided to the committee September 4, 1992. |
||||||||
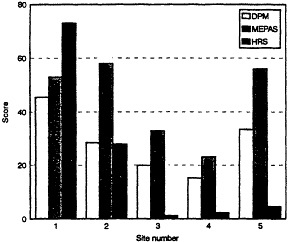
FIGURE 8-1 Graphical presentation of scores
Upon preliminary inspection of Figure 8-1, it appears that the three models give similar hazard ranking predictions. However, upon closer inspection and interpretation, a different result emerges. Although it is argued that the models were developed for different purposes and use different data inputs, among other things a stated or implied purpose of each model is to rank relative potential hazards. The three models do not agree as to which site of the five poses the highest hazard. ("Hazard" is a generic term for all three models; "hazard level" corresponds to the magnitude of the site scores that are used for screening, priority setting for cleanup, or inclusion on the NPL.) Table 8-4 presents the distribution of site rankings obtained from each model arranged according to each site's hazard level.
DPM and HRS rank Site 1 highest, while MEPAS ranked it much lower as moderate-low. There is no uniform agreement as to the next-to-highest hazardous site. DPM and MEPAS rank Sites 2 and 5 as moderate, and HRS ranks Site 2 as low and Site 5 as very low. All three models rank Site 3 as low or very low and Site 4 is ranked as very low. It is disconcerting that the models agree better on those sites that might have a low hazard level than those that might have a high hazard level.
TABLE 8-4 Distribution of Rankings of Five Sites According to Output from DOD's Defense Priority Model (DPM), EPA's Hazard Ranking System (HRS), and DOE's Multimedia Environmental Pollutant Assessment System (MEPAS)a
|
Site's Hazard Level |
DPM |
|
HRS |
|
MEPAS |
|
Very high |
—b |
— |
|
— |
|
|
High |
1 |
|
1 |
|
— |
|
Moderate-high |
— |
|
— |
|
— |
|
Moderate-medium |
2, 5 |
|
— |
|
1, 2, 5 |
|
Moderate-low |
— |
|
— |
|
— |
|
Low |
3 |
|
2 |
|
3 |
|
Very low |
4 |
|
3, 4, 5 |
|
4 |
|
a Numbers refer to site identification. b Denotes no site ranked with this hazard level. |
|||||
Is it significant that for Site 5 the MEPAS and DPM rankings are moderate-medium while for HRS the same site is ranked as very low? Based on the data presented in the site description, this site would seem to very objectionable. That the HRS model would erroneously rank this site as a very low hazard—if this is indeed an error—suggests that it, and likewise the other models might have misranked possibly numerous other sites.
As noted previously, although the models were developed for slightly different purposes, identifying high-hazard sites was an underlying feature in all three models. All therefore should have this basic capability, the committee believes it is not appropriate here to apply statistical arguments or other such mathematical formalisms to compare the model predictions in an absolute sense. With respect to ferreting out high-hazard sites, all three models should be absolutely in agreement rather than statistically in agreement some percent of the time.
The developers of the respective models scaled the scores arbitrarily such that a score of 100 represents the very highest hazard sites and 0 represents the clean sites. The highest numerical score was 73, obtained by HRS for Site 1. The lack of high scores does
not necessarily mean that all five sites selected for scoring happened to be relatively low in hazard. For example, an HRS score of 28.5 or higher places a site on the NPL.
Normalized scores for a model were obtained by dividing the individual site score values by the model average for all sites. A normalized graphical comparison of scores appears in Figure 8-2. On this basis, the numerical congruence of DPM and MEPAS is very good, while HRS follows the general trend of the others. Since the general site ranking protocol embedded in each model is basically the same, as noted in the separate chapters on each model, this congruent behavior is to be expected. Although there is congruence of the DPM and MEPAS scores, MEPAS uses detailed transport and fate algorithms while DPM and HRS use a simpler structured-value approach to model transport and fate elements in arriving at scores. Considering the congruence of DPM and MEPAS, it appears that the simpler approach might be sufficient when relative scores are desired. More comparative testing should be done to explore this hypothesis.
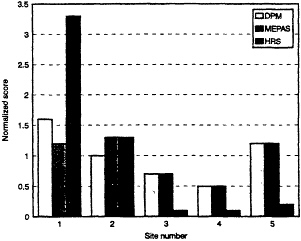
FIGURE 8-2 Graph of normalized scores
DPM and MEPAS have different methods by which they identify contaminants associated with a site. In general, applications
of MEPAS require that the contaminant data most directly associated with the waste site be used in preference to data indirectly attributed to the site. For most MEPAS applications, the data judged most readily attributable to a single waste unit are estimates of the quantities of contaminants placed at the waste site (i.e., the contaminant inventory). Contaminant concentrations in environmental media near the waste site (e.g., groundwater contaminant concentrations) can only be indirectly associated with a specific waste site because multiple potential contaminant sources usually exist in the vicinity of the site. Thus, although MEPAS has the capability to use groundwater and surface water concentrations as source terms, users often choose to use inventories as source terms. Conversely, DPM relies heavily on observed concentrations of contaminants in the air, surface water, groundwater, or soil near the waste site to be scored. If no sampling has been done at the site, DPM assumes a worst-case approach by assuming all chemicals in the inventory have contaminated the groundwater and surface water pathways, but not for the pathways of atmospheric transport. Thus, DPM site scores are based on contaminants identified by sampling the surrounding environmental media, whereas MEPAS scores can be and often are based on contaminants identified in contaminant historical inventories. A discrepancy arises when sampling data used for DPM scoring indicate the presence of contaminants that are not identified in the contaminant inventory used for MEPAS scoring. The presence of additional contaminants not identified in the inventory might result from the identification of contaminants that have migrated from other sources or from incomplete contaminant inventories.
In several instances, MEPAS and DPM identify the same contaminants of primary concern, yet produce conflicting rankings of secondary contaminants. The committee suspects that this discrepancy results from the use of differing benchmark values as known standards with which to compare the estimated intake.
MEPAS bases its index of relative risk, the Hazard Potential Index (HPI), on toxicological indicators of potential harm—the slope factor for carcinogens and the reference dose for noncarcinogens—thereby yielding a value of cancer risk and a hazard quotient for carcinogens and noncarcinogens, respectively. Conversely, DPM derives its benchmarks from regulatory limits (e.g., maximum contaminant levels) and does not differentiate between carcinogens and noncarcinogens. Some of the DPM's benchmarks are derived from the same toxicity values MEPAS uses, since regulated values are not available for every chemical for every pathway. Although MEPAS and DPM are expected to correctly identify a specific contaminant as the primary risk producer at a site, the discrepancy created by use of regulated values could contribute to the different relative rankings of secondary contaminants.
Unlike DPM and HRS, which account for potential harm to both human health and the surrounding ecosystems, MEPAS considers only risks to human health.
Site 1
The DPM and MEPAS evaluations of Site 1 differ in that MEPAS identifies the atmospheric transport pathway as the pathway producing the highest risk, whereas DPM identifies the groundwater pathway as the pathway contributing most to the site score, followed closely by the atmospheric pathway. The high groundwater score of DPM can be attributed to the fact that DPM identified and scored the site using groundwater contaminants that were not identified in the MEPAS source term. With consistent contaminants, both models probably would have identified the same pathway. The evaluation of the atmospheric pathways uses a consistent set of contaminants, and consequently, the rela-
tire rankings of contaminants evaluated in the atmospheric pathway were in good agreement.
For this site, MEPAS evaluated risk from surface water contamination resulting from the recharge of contaminated groundwater but did not evaluate the pathway of overland runoff to surface water. DPM evaluated surface water hazard from overland runoff, but not from contaminated groundwater recharge. DPM considers groundwater recharge of surface water in the groundwater pathway rather than in the surface water pathway. Neither model run identified the surface water pathway as a significant contributor to the overall site risk.
While the DPM and the MEPAS evaluations scored the surface water pathway low, the HRS scored the surface water pathway with the maximum points. This high score was due to an observed contaminant release to a watershed that has a hatchery within 15 miles. An observed release in this situation automatically receives an HRS moderate target score of 120 points for a food chain threat and it increases the surface water pathway score since at least one highly toxic and bioaccumulative substance was present at the site.
Site 2
For Site 2, DPM and MEPAS identified the groundwater pathway as the pathway of primary concern; HRS scored groundwater as low. Like Site 1, several groundwater contaminants were identified and used in the DPM scoring that were not evaluated with MEPAS, because prior modeling of this site with MEPAS relied on the contaminant inventory as the source term.
The primary reason that the HRS scored the groundwater pathway low is because of the relative emphasis placed on linking con-
taminants and targets. HRS evaluated multiple aquifers at Site 2. No releases were observed in the highest scoring aquifers, which had a fairly high target score, and consequently, the pathway score was substantially lowered. The aquifers with observed releases had few targets and received very low scores.
MEPAS evaluated a groundwater-to-surface water pathway for this site while DPM evaluated an overland runoff to surface water pathway. Again, DPM scored this site using sampling data that identified potentially hazardous contaminants that were not identified by the users of MEPAS as part of the contaminant inventory. This discrepancy explains why the surface water pathway was more significant in the DPM scoring than in the MEPAS scoring.
Both MEPAS and DPM evaluated atmospheric transport of contaminants from this site, but the relative rankings of the contaminants varied. This difference is probably due to the differing toxicity values used by each of the models to produce an index of relative risk.
Site 3
For Site 3, both DPM and MEPAS identified the overland runoff to surface water pathway as the pathway of primary concern. The groundwater pathway was found by both models to be less significant, and both models found little or no risk from atmospheric transport pathways. Due to these similarities, both models ranked this site fourth in relation to the others, indicating relatively consistent predictive abilities of the two models.
HRS evaluated the surface water pathway as low. An explanation for this difference is that the DPM accounts for the presence or absence of a sensitive environment and the distance to the sensitive environment while HRS does not. HRS weights the sensi-
tive environment based on surface water characteristics, such as stream flow, and not on distance (unless there is documented actual contamination of the sensitive environment, in which case the HRS score is not flow-weighted).
Site 4
MEPAS and DPM ranked Site 4 lower than all of the others. Despite this similarity, the models differ in the proportion of risk attributed to each contaminant transport pathway. The DPM score is driven by the groundwater pathway, whereas MEPAS identifies low but roughly equal risks from both the groundwater and atmospheric pathways. Because the atmospheric components of other site scores are in good agreement and both models use the same soil concentration of trichloroethylene (1 μg/g) to estimate risk from the atmospheric pathway, the reason for this discrepancy is unclear.
Because the only nearby stream is intermittent in nature and is recharged by groundwater upgradient from this site, MEPAS did not consider the surface water pathway a viable pathway for contaminant migration from Site 4. No surface water sampling data existed for the site. DPM assumed a worst-case approach by assuming all surface soil constituents could contaminate the surface water. The fact that the surface water pathway in DPM only contributed 1% of the overall site score even when based on the worst case confirmed the MEPAS assumption that risk from the surface water pathway was negligible.
HRS does not consider intermittent streams to be surface water bodies unless the area has less than 20 inches of mean annual precipitation. Because the nearest permanent water body was greater than 2 miles away, HRS did not score the surface water pathway for this site.
Site 5
Although MEPAS and DPM ranked Site 5 second out of the five sites scored, the primary risk-producing pathway was different for each model. MEPAS identified the surface water pathway as the pathway contributing the highest risk, whereas the DPM identified the groundwater pathway as the primary contributor to the overall site score. HRS scored the groundwater pathway low since sampling data did not indicate that contaminants had actually reached the target and no large drinking water supply well was near the site.
MEPAS and DPM identify PCBs (Arochlor 1254) and 1,1-dichloroethane as the contaminants of primary concern in the surface water and groundwater, respectively. The relative significance of secondary contaminants differ in all pathways. As described above, the committee attributes the difference in relative significance of secondary contaminants to differing methods of deriving benchmarks.
Scoring Exercise Conclusions
The scoring of these five sites indicates the following
-
Scores obtained from all three models generally follow the same trend from site to site; however, in each model this trend results from very different reasons.
-
Model hazard rankings do not agree on which site is the highest or next to the highest.
-
Model hazard rankings do agree on which sites are a relatively low hazard.
-
A fundamental difference in the recommended use of con-
-
taminant data results in a different set of contaminants being evaluated by each model, which leads to a discrepancy in the differences in site scores.
-
A fundamental difference in the recommended use of data to weight different environmental transport pathways also leads to a discrepancy in the differences in site scores.
-
Even when relatively consistent site scores are produced, the dominant risk-producing contaminants and transport pathways usually differ between models.
-
Differences in evaluation of site data, rather than model structure, appear to be the major factor leading to variance in site scores. However, DPM and HRS evaluate potential risk to human health and the environment, whereas MEPAS evaluate potential risk to human health only. The effect of such a difference on the scoring results is unknown.
GENERAL CONCLUSIONS
Comparing the performance of ranking models is a useful exercise. It should be used on a regular basis in the future to compare the performance of newly developed or modified models against the output of established ones. The results of more complex and expensive models should be compared with older and simpler models. A set of reference sites should be established for use in developing input data for a wide range of hazardous potential (high to low). Using a set of about 12 dissimilar sites would help ensure that the models are compared on the basis of a broad range of site characteristics. The approach would be useful for checking whether revised algorithms are performing as expected or whether the models can discriminate, in a numerical sense, among various degrees of potential site hazards in the range of high to low. Ob-


